Home » Behind the Headlines (Page 6)
Category Archives: Behind the Headlines

Construction Spending 2021 Update 8-2-21
Construction Spending Actual through June 2021
Total Construction Spending is up 5.4% year-to-date (ytd) from the same six month period 2020. Residential is up 24.5%, Nonresidential Buildings is down -10.1% and Nonbuilding Infrastructure is down -5.4%.
The single largest impact to the change in this forecast from last month is Highway and Street. Highway spending in June fell 5%, while my forecast was predicting a gain of +3%. I then lowered my forecast for the rest of this year.
Year-to-date through June, while residential is up 24.5%+, all but one single nonresidential market is down. 15 of 16 nonresidential markets, 98% of combined total nonresidential market value, are down a total of -8%. Only Sewage/Waste Water is up 2.5% ytd. That’s half of the $ in the table item Sewer / Water / Conservation. For the remainder of the year, the rate of nonresidential decline will slow to -4%.
Construction starts are leading the way to recovery, but construction spending, which is dependent mostly on starts from previous years (nonres bldgs 2020 down -20%), will remain depressed for nonresidential construction well into 2022. New nonresidential starts could double from the current rate of growth and it still wouldn’t be enough to turn 2021 nonresidential spending positive.
It is remarkable that both total new construction starts and total construction spending are UP for 2021, but that needs further explanation.
Residential starts increased +9% in 2020 and forecast up +19% in 2021. Residential spending increased +15% in 2020 and is forecast up +18% in 2021 and up +7% in 2022. Both residential starts and spending are at all-time highs. That is what is driving the totals to new highs.
Nonresidential Bldgs starts fell -4% in 2019, -21% in 2020 and are forecast up only +2.5% in 2021. 2021 starts are still -22% below the peak in 2018. Nonresidential Bldgs spending fell only -2% in 2020 but is expected to fall -8% in 2021 and -5% in 2022.
Nonbuilding starts were flat in 2019, fell -15% in 2020 and forecast indicates +4% growth in 2021. Nonbuilding starts are 11% lower than 2019. Nonbuilding spending gained only +1% in 2020, but forecast fell -3% in 2021 and is expected to drop -5% in 2022.
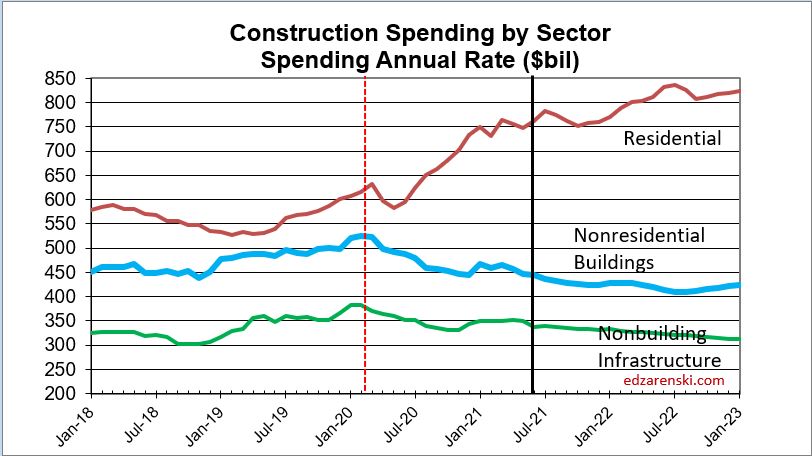
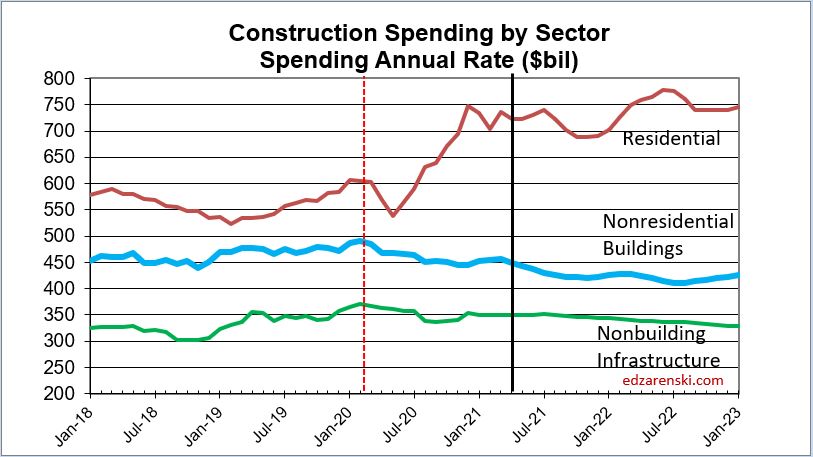
The Total Construction Spending plot doesn’t show enough detail. As described above, more detail is needed to understand what is going on. The sector plot below shows residential up and nonresidential down..

Recovery in both nonresidential buildings and nonbuilding backlog begins to build in a few markets in 2021. But overall, spending in nonresidential buildings and nonbuilding is exceeding new starts, therefore both will begin 2022 with lower backlog than 2021. Total all nonresidential 2021 starting backlog dropped -13% from 2020. Starting backlog at beginning of 2022 will be down another -8%. Backlog increases for 2023.
Aside from residential, recovery to the levels of revenue (spending) recorded in Q1 2020 or earlier won’t show up before 2024.
The following table shows ytd through June $ and forecast for 2021/2022. Almost every nonresidential market is down ytd and down compared to the average in Q1 2020 before Pandemic Recession.

Impact of Pandemic Slowdown
The impact of reduced starts in 2020 is showing up in the 2021 year-to-date results. Total Nonresidential Buildings starts were down -20% in 2020. Nonres Bldgs starts for the 1st 6 months of 2021 are level with 2020, still down -8% from the pre-pandemic high in Q1 2020. There is some good news! Nonres Bldgs starts in Q2 2021 are now back above the pre-pandemic high, indicating recovery underway. Nonbuilding Infrastructure starts were down -10% in 2020, but returned to pre-pandemic high several months ago.
Due to the large drop in new starts from Apr 2020, that continued at a level down -20% to March 2021, some nonresidential markets will be affected by a downward trend in spending for two to three years.
The greatest downward impact from a -20%, year-long loss of starts on nonresidential spending will be felt throughout 2021 and into 2022.
Over the next 9 months, every sector will post more down months (in spending) than up months, although the declines will be most noticeable in nonresidential buildings.
Overall performance by sector has changed very little since May.
While most markets recover to positive new starts growth in 2021, spending growth lags, showing the downward trend in 2021 as a result of lost starts in 2020.
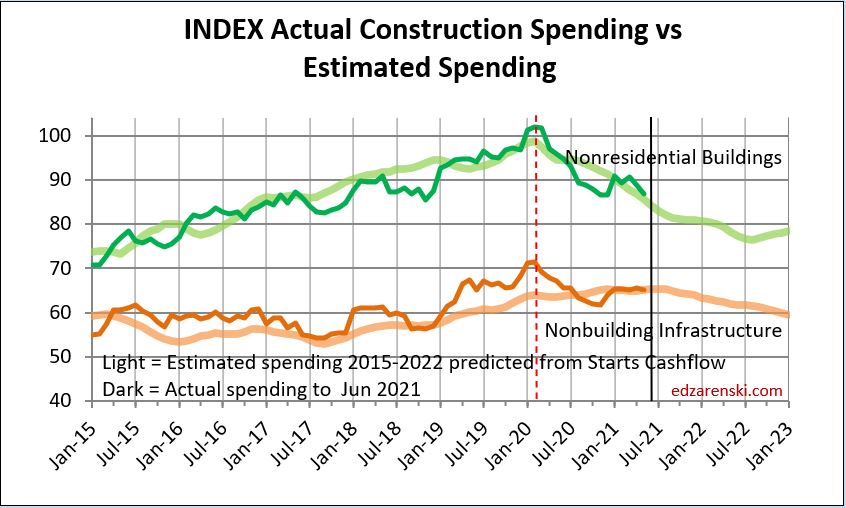
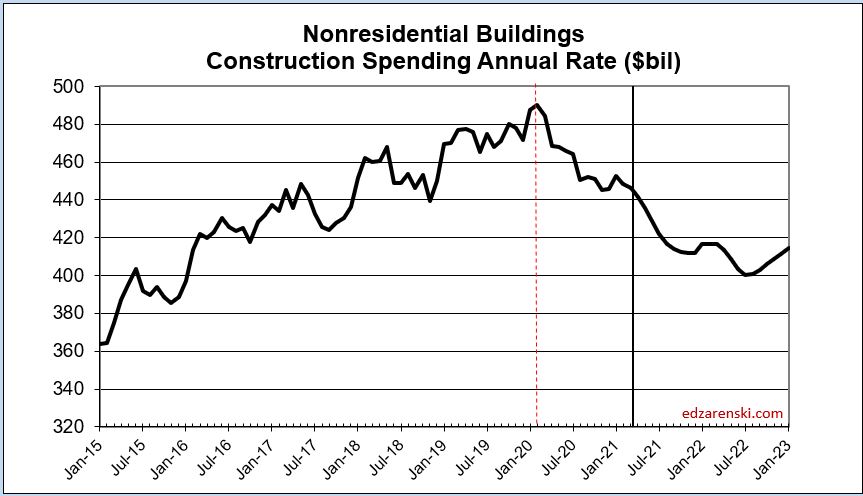
This next plot changes the scale of the spending plot so the nonresidential buildings data can be visualized much easier. This is the exact same data as in the Construction Spending by Sector plot above. The scale change helps immensely to visualize the decline in nonresidential buildings spending. By midyear 2022, the annual rate of spending will be -20% lower than the pre-pandemic peak. It could take two to three years after that to recover to the pre-pandemic level of spending.

A typical batch of new construction starts within a year gets spent over a cash flow schedule similar to 20/50/30, that is, 20% of all starts in the year gets spent in the year started (or over the 1st 12 months), 50% in the next year ( next 12 mo) and 30% in years following. Total nonresidential buildings starts in 2020 were down -20% ($90 bil in spending) and nonbuilding was down -10% ($35bil). Under normal conditions, we know how much of that $125 bil would have occurred in 2020, 2021 and 2022. That’s a loss of spending this year, and that loss remains a steeply downward slope as long as starts remain depressed. Nonresidential buildings starts, depressed for 13 months, posted strong starts indicating recovery beginning in April this year.
If INFRASTRUCTURE BILL starts don’t begin until the 2nd half of 2021, only 30% (of the 1st year cash flow 20/50/30 that is based on 12mo) gets spent in the 1st year. Therefore, even if $100 billion in new infrastructure starts begin in the 2nd half 2021, only 30% x 20% or only about 6% would get spent in 2021. That’s $6 billion, or less than 1% of annual construction spending. So, there will be very little, if any, impact on 2021 construction spending as a result.
Total Public Infrastructure and Public Institutional, the total public work pool for which infrastructure investment is a potential, represents a total LESS THAN $350 BILLION, only 25% of all construction.

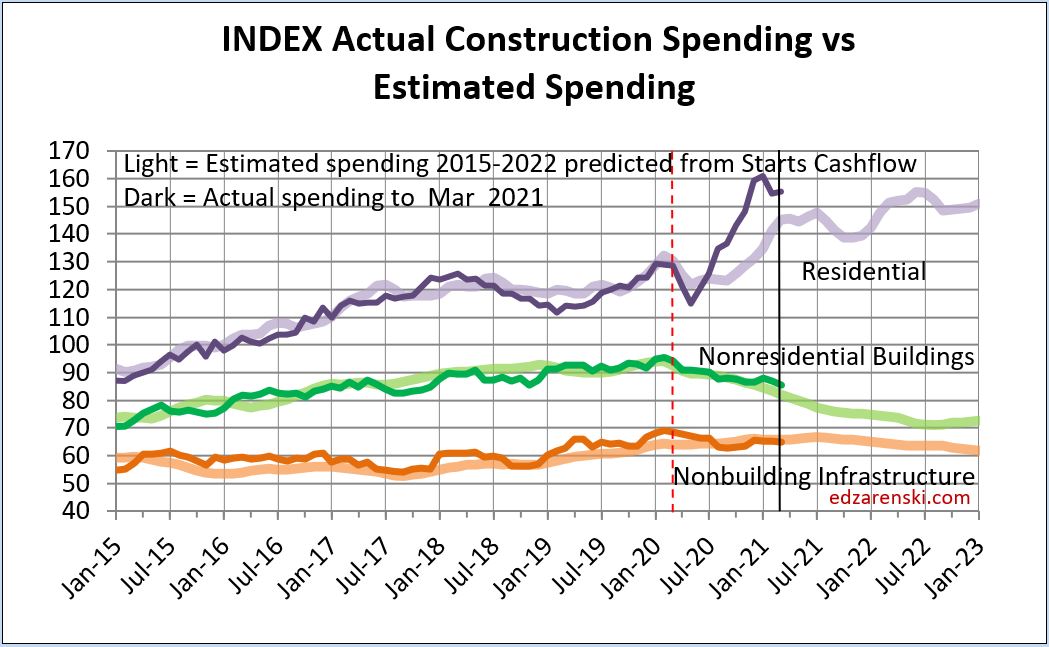
All the forecast spending in the data above is developed from monthly cash flow of new starts. This plot shows what the history looks like when comparing the cash flow forecast to the actual spending growth. Although actual spending is somewhat more uneven, the forecast accurately predicts the direction spending is headed.
JOBS DATA updated 8-6-21
Construction Jobs for July are expected to increase. Jobs are now down 3 consecutive months. Comparing jobs year-over-year in residential is strongly skewed by the rapid declines then rapid growth in 2020. That did not occur in nonresidential. July posted an increase of 11,000 jobs. Year-to-date thru July construction is up by 21,000 jobs. Jobs are down -227K (-3.0%) from Feb 2020 peak. Hours worked are down less than -1%, equivalent to about 50,000 jobs. Expect this downward trend to accelerate into year end.
Construction spending minus inflation (Volume) supports jobs. Most of the increase in residential construction spending this year is INFLATION. Nonresidential spending and volume are both down. There is no meaningful increase in total construction volume to support jobs growth.
Don’t ignore inflation. While residential spending is forecast UP 19% in 2021, 11% of that is inflation. Real volume is up only +8%. Nonres Bldgs volume after inflation is forecast down -12%, Nonbuilding volume down -7%.
If you are still measuring your business growth by change in revenue, you’re including inflation as part of your growth. Inflation is simply more paper dollars exchanging hands, not growth.
Total construction jobs through July measured from peak pre-pandemic (Feb 2020) are down 3%. Volume growth (spending minus inflation) from Feb 2020 to July 2021 is down 6%. Since the onset of the pandemic, we now have 3% more jobs than we have volume of work to support those jobs. The result is a 3% loss in productivity.
Residential change in revenue from Feb 2020 to July 2021 is up +28%. But the real change in volume after inflation is up only +13%. Residential jobs are up only 3%. This is where the greatest need is currently.
Nonresidential Buildings change in revenue from Feb 2020 to July 2021 is down -15%. After inflation, the real change in volume is down -19%. Nonres Bldgs jobs are down only -7%. This is considerable excess jobs to support the current work.
Nonbuilding Infrastructure change in revenue from Feb 2020 to July 2021 is down -10%. After inflation, the real change in volume is down -17%. Nonres Bldgs jobs are down only -6%. This is considerable excess jobs to support the current work.
The need identified in residential, and likewise the excess identified in nonresidential are not as extreme as both seem. There are a large number of jobs classified as nonresidential that actually perform residential work. Any large firm, and all it’s employees, regardless of the job they perform, if they primarily work on nonresidential buildings, is classified nonresidential for the purpose of the jobs count. However, the buildings they work on are always classified as to building type. This often occurs in several large primarily nonresidential trades such as concrete, structural steel and HVAC, when working on multifamily high-rise buildings. These crossover jobs are not separable from the major classification.
In constant $ (spending adjusted for inflation), even though residential constant $ volume is up 13% from Q1 2020, current total $ volume of all types of work, residential and nonresidential, is 6% lower than the peak average in Q1 2020. Total all $ volume will fall another 5% by year end 2021.
Construction spending is on track to increase 4.7% in 2021 over 2020. But after taking out inflation, spending minus inflation in 2021 will be DOWN 2%. Residential spending increases $115 billion (+18%), but after 11% inflation residential volume increases only $50 billion. All nonresidential spending decreases $49 billion but after adjusting for 4%+ inflation real nonresidential volume is down $86 billion. Total construction volume (spending minus inflation) is expected to decline 5% from May to Dec. Construction Jobs are expected to follow suit.
Construction volume growth is falling due to huge volume of nonresidential starts (-22%) that disappeared in 2020. The affect of those lost starts, which would have had peak spending in mid-2021, is such that the volume of work is declining throughout 2021.
Of concern is that since Feb 2020, total construction volume has recovered to a point that is down 7%, but jobs have increased back to a level that is down only 3%. Jobs are increasing at a rate that is closer to the growth in construction spending, which is substantially greater than the rate of growth of construction volume.
Jobs are increasing faster than the volume of work (which supports jobs). What are the implications of this to the construction industry? The industry as a whole now expends 4% more labor (jobs) to put-in-place every $1 billion worth of work than it did in Feb 2020. That impacts job total labor cost. That is lost productivity and impacts inflation.
Although residential jobs are currently increasing, nonresidential jobs will continue to fall, dropping another 4% over the next 12 months. If jobs growth follows more closely to volume growth, which it should, this time next year construction could be down another 200,000 jobs.

2021 Midyear Forecasts
Here’s how the current year-to-date spending performance, as of June data, compares to various firms’ Midyear Forecasts. The ytd provides insight into expected final 2021 performance. For example, the year-to-date Educational spending is -10.8% with 6 months of spending recorded. One firm has forecast educational will finish up 3.5% for the year. With only 6 months remaining (estimate to complete or etc), here’s how the remaining 6 months would need to perform for that to happen.
[(forecast% x 12) – (YTD% x 6)] /6mo etc = [(+3.5% x 12) – (-10.5% x 6)] /6 = [(+42) – (-64)] /6 = 106/6 = +17.6%.
For the next six months Educational spending would need to average +17.6% growth over last year to swing from currently down -10.8% to end the year up +3.5%. Well, Educational spending is down 16% from the 2020 high, has fallen 9 of the last 13 months and is down an average of -1.5%/mo for the last 5 months. With this performance over the past year, the probability is exceedingly low that Educational construction spending is going to flip from a negative monthly rate of spending to an avg of +17%/mo for the next six months to finish the year up +3.5%. There are numerous examples like this in the forecasts.


AIA Midyear Consensus 2021
7-16-21
The AIA Midyear Consensus solicits the nonresidential buildings construction spending forecast from a number of firms and publishes those results and the Consensus average. The table posted here includes all the AIA forecasts and Construction Analytics 7-2-21 forecast.
https://www.aia.org/articles/6416440-outlook-has-improved-for-construction-spen

Also included in this table is the year-to-date (ytd) actual spending through May. With 5 months of actual data, that ytd result should sway any forecast for any market estimate of year end result. A review of several years of history over all markets shows there are very few instances in the historical data where year end performance swings by more than 10% from ytd at month 4 or 5. Normal variances for about 80% of instances are in the range of 3% to 5%. So with few exceptions, at 5 months into the year, we could estimate year end will be within +/-5% of year-to-date. And yet, there are many instances in these forecasts that are outside that expected range.
The question is, can we determine, how accurate are these forecasts? Some rudimentary checks and balances, and some simple proportional math, provide the answer.
If you forecast a construction spending mrkt to finish 2021 at -30%, but the ytd after 5 months is -5%, the next 7 months would need to average near -50% to get to -30%. With the change in the yoy rate less than -3%/mo, it can’t happen.
If you forecast a construction spending market to finish 2021 at +3.5%, but the ytd after 5 months is -11%, the next 7 months would need to average +14% above Jun-Dec 2020 to get there. That’s a 25%/mo swing from the current rate that would need to hold steady for 7 months.
Likewise, If you forecast a construction spending market to finish 2021 at +11%, but the cum ytd after 5 months is -3%, the next 7 months would need to average +21% above Jun-Dec 2020 to get there. That’s a 24%/mo swing from the current rate for 7 months. Swings like that just don’t happen.
Another market with a glaring example, this time in almost every forecast. Lodging forecasts in the AIA Consensus range from -14% to -20%, with one wild estimate at -43%. Construction Analytics forecast for Lodging is -26%. The year-to-date is -27%. Well, from April to December 2020, spending fell at a rate of 4%/month. In the 1st 5 months of 2021, spending has been down slightly, still hovering near the December low. There are no indications that spending is poised for a rebound. In fact the forecast calls for spending to continue falling through 2021. The current monthly rate of spending averages -25%/mo from 2020. In order to hit any of the forecasts between -14% and -17%, the current rate of spending would need to flip by 15 to 20 percentage points for all of the remaining 7 months of 2021. Spending would need to increase at a rate of 2.5% per month for the next 7 months. This is a good time to remind everyone that Lodging construction starts last year dropped 45%, so the trend is down, not up. Current indications are that spending will decline 9 out of the next 12 months.
The forecasts in this Consensus report have numerous examples like those above. Nonresidential Bldgs actual ytd for the 1st 5 months is -10.5%. Consensus forecast for 2021 is -3.9%. The next 7 months each would need to avg +1% over 2020 to get there. The monthly rate of spending is currently -6% to -10% below 2020 and has fallen 13 of the last 15 months. That’s not going to flip to +1% immediately and stay at that level for 7 months.
The argument cannot be used that monthly data should not be compared to 2020 because of the rapid decline due to shutdowns skewing all the data. That did not occur in nonresidential buildings. Nonres bldgs spending declined 5% in April, but then it averaged a steady -1.5%/mo decline for the remainder of 2020. As of May 2021, spending is right where it was in December, still 16% lower than March 2020. There are no huge down months in 2020 to which 2021 spending would be compared resulting in a large increase to year-to-date percent.
At midyear, the ytd values give some indication of how the year will end. There are a few examples in historical data in which a market did swing by 10% or more from midyear to year-end, but there is less than 10% chance of a market varying by more than 10% and more than an 80% chance markets vary by only 3% to 5%. Rarely does -2% become +8% or +7% become -3%.
11-1-21 updated table added Here’s the same Midyear forecasts with year-to-date updated to September spending. Only the year-to-date has been updated in this table. All forecasts are as posted in July.
6 out of 8 construction spending forecasts for nonresidential buildings reported in the AIA Midyear Outlook Jul’21 could now only be realized IF construction spending YOY for the next 3 months turns positive, in some cases it would need to grow to +10% to +12% YOY for the next 3mo. Currently, YOY is -7%. Construction spending YOY has been near -8% to -7% for last 4 months. The next 5 months is forecast to improve, but improves only to -4%, does not turn positive. There are no indications in the forecast that total nonres bldgs YOY spending will turn positive this year.

And here’s the 2021 Midyear Forecasts compared to the Final 2021 spending.

Compare Current Construction Forecasts
Compare Construction Analytics current construction spending forecast to the most recent forecasts by FMI and ConstructConnect.
Construction Analytics (CA) and ConstructConnect (CCon) forecasts include year-to-date spending. FMI report is titled 2021 2nd quarter edition, but also states based on 4th quarter 2020 actuals.
Both FMI and CCon forecasts have not yet been updated to include 2019 and 2020 revisions released on 7-1-21.
Construction Analytics forecast includes 2019 and 2020 revisions and includes May ytd spending.
Spending Total Put-in-place Forecasts for 2021 range from $1,422 billion (FMI) to $1,574 billion (CCon). Construction Analytics (CA) forecast is $1,526 billion. This is quite a wide spread. Here’s a few of the major differences:
Residential CA = $741 bil, FMI = $627 bil, CCon = $728 bil
Educational CA = $99 bil, FMI = $103 bil, CCon = $108 bil
Healthcare CA = $48 bil, FMI = $49 bil, CCon = $53 bil
Power CA = $110 bil, FMI = $120 bil, CCon = $137 bil
Transportation CA = $56 bil, FMI = $54 bil, CCon = $65 bil
https://edzarenski.com/2021/07/01/construction-spending-2021-thru-may/
https://www.constructconnect.com/blog/quarterly-u.s.-put-in-place-forecast-report-summer-2021
The FMI forecast for residential appears to not yet have been updated to reflect record spending from October through May. I’d expect that will soon be updated. Residential spending year-to-date (ytd) is up 23% and has averaged a seasonally adjusted $740bil for the past 7 months. For the remainder of the year it’s expected to decline about 0.5%/month, but residential spending will still finish 2021 well over $700 billion.
For Power to end up at CCon = $137bil in 2021, considering the ytd through May is already -7%, the remaining 7 months of the year would need to average up 30%. Markets don’t jump that much higher and maintain that level for the next 7 months.
The spread of Spending Put-in-place Forecasts for 2022 ranges over an even wider difference, from $1,355 billion (FMI) to $1,703 billion (CCon). Construction Analytics (CA) forecast for 2022 is $1,533 billion. This is an exceptionally wide spread with some obvious areas of attention.
2022 Residential CA = $779 bil, FMI = $567 bil, CCon = $781 bil
2022 Nonresidential Buildings CA = $421 bil, FMI = $432 bil, CCon = $474 bil
2022 Nonbuilding CA = $333 bil, FMI = $356 bil, CCon = $448 bil
note: Transportation and Communication carried in nonbuilding for like comparison.
At this time of year some firms will present midyear forecasts. My latest report is May ytd data released July 1. With the August 2nd and 6th spending and jobs releases for June we have half a year of data, I’ll base a midyear report on that. I don’t expect any big change since the May data. Not all midyear forecasts will have the same ytd data, so could vary in that respect. So, watch for the midyear forecasts!
Here’ is a link to the results of 8 firms forecasts at Midyear 2020 compared to actual revised final 2020 spending. Also here is the same firms 1st forecast for 2021 compared to actual year-to-date 2021
Speaking Engagement – Advancing Preconstruction 2021
Join us August 30 – September 1 in Dallas TX
I will be presenting to the plenary session on Main Conference Day 1, Tuesday August 31 on the following:
The State of Construction Post-Pandemic: Revealing Trends in Demand, Supply & Cost Escalation
• Revealing the economic reality and outlook in terms of construction volume and its impact on jobs and prices
• Identifying key metrics and data sources that will give you a reliable indication of inflation for your market
• Determining the likely impact of an Infrastructure Bill and other major construction investments on market forces
The 6th annual Advancing Preconstruction 2021 conference is North America’s largest gathering of contractors, design firms and clients looking to improve coordination of the design phase. You’ll hear how to align cost, schedule and project specifications to set projects up for success.
From conceptual estimating and winning work to constructability reviews and model-based quantity take-off, you’ll discover the latest technologies and workflows across five educational tracks.
New additions for 2021 include:
- Post-pandemic outlooks with a focus on cost escalation for major markets and bidding strategies
- Deep dives into estimating for specific CSI divisions including earthwork, steel, mechanical and electrical
- Benchmarking ways to conduct design reviews and maintain quality of coordination, including with remote working
- How direct material procurement, prefabrication, IPD and other trends could radically alter preconstruction and reduce costs
- https://advancing-preconstruction.com/

Construction Spending 2021 update 6-1-21
Construction spending April 2021
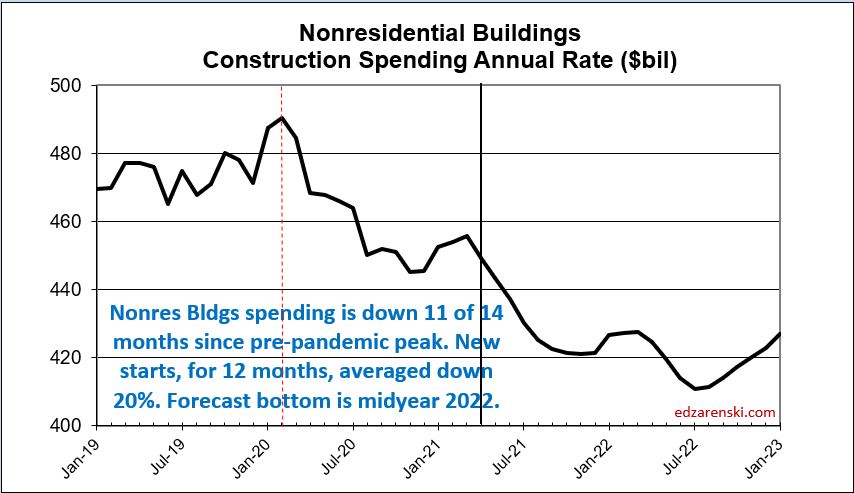
Construction Spending is up 5.8% year-to-date (ytd), however that’s broken down into three parts, up 21.8% for residential, down -6.2% for nonresidential buildings and down -4.9% for nonbuilding infrastructure.
In the 1st 3 months of 2020, spending had reached an all-time high averaging a SAAR of $1,461 billion.
In the 1st 3 months of 2021, spending hit a new all-time high averaging a SAAR of $1,515 billion. In April, spending is now up to $1,524 billion.
But these new highs belie the situation in spending. Year-to-date, while residential is up 20%+, 14 of 16 nonresidential markets, 95% of total nonresidential market value, are down.
In Apr and May 2020, residential spending fell -6% and -5%, down a total of -11% in two months. Then residential spending increased every month for the remainder of 2020, By Dec 2020 residential spending was 24% higher than in Q1 2020. Residential spending for 2021 is forecast to end up 15.4% for the year, but (the annual rate in) Dec 2021 will be -8% lower than Dec 2020.
Nonresidential Bldgs did not follow the same magnitude of declines, down only -3.5% in April 2020 and only -0.5% in May. But Nonresidential Bldgs spending has been down 10 out of 13 months since March 2020, now down -7.5% from the avg in Q1 2020. Nonres Bldgs spending, forecast down -5.7% from current over the next eight months, is forecast to end at -6.0% for 2021.
Construction starts are leading the way to recovery, but construction spending this year, which is dependent mostly on starts from the previous year (down -22%), will remain depressed for nonresidential construction well into 2022. Recovery in backlog begins to build in a few markets in 2021. However, new nonresidential starts could double from the current rate of growth and it still wouldn’t be enough to turn 2021 nonresidential spending positive.
Aside from residential, recovery of revenue (spending) won’t begin in earnest until 2023.
The following table shows ytd through Apr $ and forecast for 2021/2022. Almost every nonresidential market is down ytd and down compared to the average in Q1 2020 before Pandemic Recession.

The impact of reduced starts in 2020 is starting to show up in the 2021 year-to-date results. Total Nonres Bldgs starts were down 22% in 2020, Nonbldg Infrastructure down 13%. Some of these markets will be affected by a downward trend in spending for two to three years.
2020 starts for select markets:
- Amusement -38%
- Commercial/Retail -14%
- Office -20%
- Lodging -50%
- Manufacturing -57%
- Power -38%
The greatest downward impact on spending will be felt in mid-2021. Over the next 9 months, every sector will post more down months than up months, although the declines will be most noticeable in nonresidential buildings.
For the next few months the residential year-to-date comparison will be skewed. It is going to increase due to the steep fall-off in spending back in April and May 2020. Then months of strong growth, a total +38% in 7 months in residential from May 2020 onward, with no equivalent growth increase this year, will cause ytd comparisons to decrease. So, even though residential spending is not forecast to increase any more in 2021, residential spending will peak at +25% year-to-date in the May-June data (due to the steep decline in spending in 2020) before falling back to end at +15% ytd for year end.
YTD for nonresidential buildings, currently at -6.2%, will remain near this level for the rest of the year.
The following table shows two data sets: all markets spending compared to avg 1st qtr 2020 and forecast change for next 8 months. The forecast for the remainder of 2021 showing the trend, up or down, is down for almost every nonresidential market. So while most markets recovery to positive new starts growth in 2021, spending growth lags showing the downward trend in 2021 as a result of lost starts in 2020.

This next plot changes the scale of the spending plot so the nonresidential buildings data can be visualized much easier. This is the exact same data as in the Construction Spending by Sector plot above. The scale change helps immensely.
A typical batch of new construction starts within a year gets spent over a cash flow schedule similar to 20/50/30, that is, 20% of all starts in the year gets spent in the year started, 50% in the next year and 30% in years following. Total nonresidential buildings starts in 2020 were down 22% ($100bil in spending) and nonbuilding was down 13% ($50bil). Under normal conditions, we know how much of that $150 bil would have occurred in 2020, 2021 and 2022. That’s a loss of spending this year, and that loss remains a steeply downward slope as long as starts remain depressed. Nonresidential starts, down now for 12 months, posted some hint of recovery in April.
If infrastructure starts don’t begin until the 2nd half of the year, only 25% to 30% (of the 1st year 20/50/30 that is based on 12mo) gets spent in the 1st year. Therefore, even if $100 billion in new infrastructure starts begin in the 2nd half 2021, only 30% x 20% or only about 6% would get spent in 2021. That’s $6 billion, or less than 1% of annual construction spending.
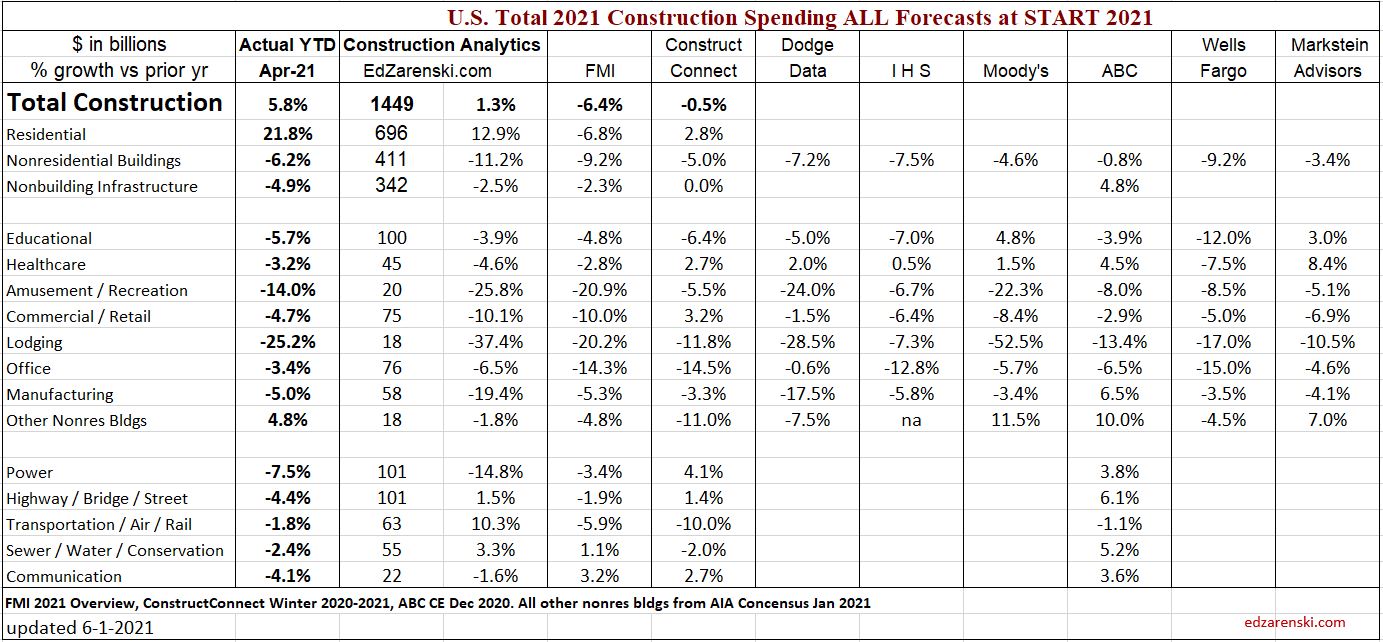
This table shows the ytd 2021 compared to the initial forecasts by Construction Analytics and eight other firms. The ytd and the forecast for the remainder of 2021 (table above) provide insight into expected final 2021 performance. Up above I’ve compared ytd to my current forecast. Here, ytd$ is compared to all the initial forecasts for 2021.
6-4-21 Construction jobs report released. Down 20,000 jobs for May. Both March and April revised down slightly. Jobs have increased only 23,000 for the 1st 5 months of 2021. Construction is still down 225,000 from Q1 2020.
I’ve been calling for a slowdown or slight decline in jobs growth. Construction spending adjusted for inflation (constant $) is down 2% since Dec-Jan. The trend is down for the rest of the year.
Construction volume growth is falling due to huge volume of nonresidential starts (-22%) that disappeared in 2020. The affect of those lost starts, which would have had peak spending in mid-2021, is such that volume of work is declining throughout 2021.

Construction Inflation May 2021
SEE Construction Inflation 2021 – Q3 Updated 10-15-21
update 6-15-21 PPI for May
Post Great Recession, 2011-2020, average nonresidential buildings CONSTRUCTION INFLATION is 3.7%. Residential cost inflation averaged over 5% for the last 8 years.
The 30-year avg inflation rate (including recession) for Nonres Bldgs is 3.5% and for Residential it’s 3.4%.
The 30-year avg inflation rate (EXCLUDING recession years) for Nonres Bldgs is 4% and for Residential it’s 4.75%.
I expect non-residential buildings construction inflation in 2021 to range between 3.2% to 3.5%, with potential to be held lower. Expect residential inflation of 7% to 8% with potential to push slightly higher.
As of March 2021, PPI for materials inputs to construction is up 12% to 14% yoy, measured to last March before the bottom dropped out. The PPI Buildings Cost Index for final cost to owner is up only 2%.
Almost every construction market has a weaker spending outlook in 2021 than in 2020. Approx. 50% of nonres spending in 2021 is generated from 2020 starts.
- Nonres Bldgs starts fell 22% in 2020.
- Nonbuilding starts were down 15%.
- Residential starts were up 6%.
While there are several reasons that construction inflation will increase, downward pressure on spending will temper construction inflation.
as of 6-15-21, May PPI report > Inputs to Nonres Constr YTD21 +13.3%. Final Demand Nonres Constr YTD21 +2.7%. Five solid months of 2021 data shows the Input costs of materials IS NOT being passed along to final cost to owner. This could change, but for now final costs of construction are holding well below input costs.

A look back at Res, Nonres and Nonbldg construction inflation over the last 30 years shows rarely has there been any substantial increase in inflation when construction spending is headed down.
- Nonres Bldgs spending 2020 -2.0%, 2021 -7.7%, 2022 -4.5%
- Nonbuilding spending 2020 +2.8%, 2021 -1.3%, 2022 -3.2%
- Residential spending 2020 +12.2%, 2021 +17%, 2022 +4.8%
Over 30 years, looking at the 3 major sectors, Res, Nonres Bldgs and Nonbldg = 90 pcs of data. 27 out of 90 times spending decreased or stayed flat for the year. Only 3 out of those 27 times when spending was down/flat did inflation come in over 3%. Avg inflation for the 27 down/flat yrs is less than 1%. For those 27 times, only 3 times were PPI Inputs less than 2%.
An estimator must differentiate between “added quality” and inflation. Added components or increased level of finish are not inflation, but are picked up in the estimators increased unit costs. Inflation captures higher labor, mtrl, margin costs for same level of build out.
Granite counters and Italian tile floors vs PLam counters and vinyl floor coverings is an increase in quality, not inflation. Increased SqFt is an increase in quantity, not inflation.
7-21-21 June PPI data will probably drive up inflation cost in this report. SEE PPI as of June-July 2021
The report attached below, written in May, suggests inflation that has been changing rapidly. Please read the most recent posts on inflation and the PPI for materials and final costs for updated information.
Follow this link for Construction Spending 2021 Update 8-2-21
Follow this link for Construction Spending 2021 update 5-3-21
Follow this link for 2021 Construction Economic Forecast 2-2-21
Download the full Inflation Report here

Nonres Bldgs Recovery to Pre-Pandemic? When?
5-10-21
Economists should be talking about this. While residential starts and spending are at all-time highs, nonresidential buildings starts have been down for months and spending is still declining.
Since Apr 2020 and now through March 2021, Nonresidential Bldgs construction starts, for 12 months, have averaged down 25%+ compared to Q1 2020. Recent Q1 2021 is still down 22% from Q1 2020.
A full year of nonres bldgs starts generates over $400 billion in spending. With starts down 25% for the past 12 months, that’s a loss of over $100 billion in spending that would have occurred over the next 1 to 3 years.
Spending follows as starts move, only later, so spending will fall.
Actual nonresidential buildings construction spending has been down 10 of the last 12 months. Now in Mar 2021 it is at its low point, 9% lower than Q1 2020. The forecast for the remainder of 2021 is down near 1%/month.
A simple model built to show when starts have maximum impact on spending indicates by Dec 2020 Nonres Bldgs construction spending put-in-place would be 10% lower than Q1 2020. Spending was actually 9% below Q1 2020. So the model seems to be on track.
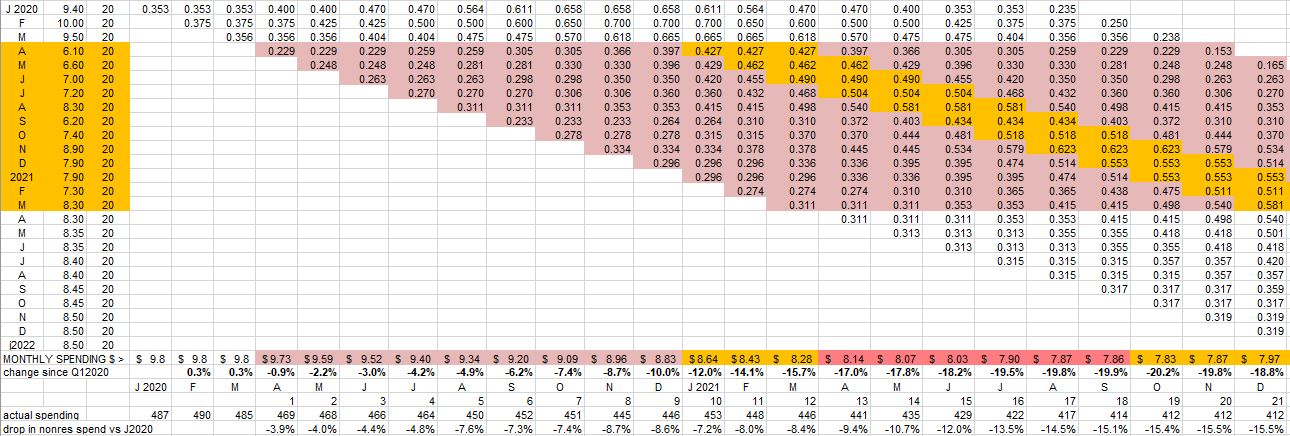
This table sets Feb 2020 starts to a baseline of 10.0. All other starts afterwards are entered at the percentage of actual $ starts that month compared to Feb 2020, so 8.30 in March of 2021 represents starts for Mar 2021 were 83% of Feb 2020. A lost start is negative spending. So, instead of thinking of the peak month of spending, that becomes the month of greatest loss. Those months near the middle of the schedule, are highlighted here.
Dodge is forecasting new construction starts for nonres bldgs will increase ~4% in 2021 and ~10% in 2022. That means starts in 2021 will still be 20% lower than Q1 2020 and starts in 2022 will still be 12% lower. This has major implications.
Even at 10%/yr growth in new starts in 2022, 2023 and 2024, Nonres Bldgs Starts would not return to pre-pandemic level until mid 2024. If starts remain lower than Feb 2020 through 2023, then spending will remain lower than Feb 2020 through 2024.
That model, that’s on track so far, shows maximum impact from reduced 2020 starts will occur in Q2-Q3 2021. But what about 2021 starts? Negative impact continues longer than the # of months starts remain lower than Q1 2020. We now have 12 months of starts still averaging 22% below Q1 2020, so even when we begin to improve, we are measuring from a new base 22% down. For each lower month the greatest negative impact in spending is 10-12 months later. That loss of spending is shown in the following chart for Nonres Bldgs Spending.
By the end of 2021, Nonres Bldgs construction spending put-in-place is forecast to be almost 20% lower than Q1 2020. If the Dodge forecast of 4% growth in starts for 2021 is correct, then, even though 2021 had growth, it’s off the bottom, and 21 months of starts will have averaged down 22% from Q1 2020.
Nonresidential Bldgs construction spending follows as starts go. If starts are down, future spending will be down.
Nonresidential Buildings spending $ put-in-place will not return to pre-pandemic levels before 2024 or 2025.
Construction Economics – An Eye on Forecasts
5-5-21
How can you tell if your preferred construction economic forecast is on track to finish the year as predicted?
For comparison, in the following link I’ve collected initial 2021 construction spending forecasts from nine different sources. Measuring Forecasting Methodology & Accuracy
As of 5-3-21, three months of actual data are in. The first step is to compare that current actual data to the predictions. The next step is to use a bit of math to answer the question, Can we get there from here?
Here’s examples:
First let’s look at Lodging. In the AIA initial 2021 Outlook, ABC forecast -13% and Moody’s forecast -52%. Current spending year to date through March is -25%. Are either of these forecasts achievable?
Lodging construction starts dropped 11% in 2019 and dropped another 50% in 2020. The seasonally adjusted annual rate (SAAR) of spending fell from $33bil in Q1 2020 to $24bil in Q1 2021, down 27%. The current rate of spending is coming in between 25%-30% below same month last year (yoy).
Now do the math.
Look at the ABC forecast for lodging. To finish the year down -13%, monthly spending needs to average -13% for all 12 months of 2021. 12 months x -13% = -157. But 3 months, down cumulatively 25%, are already known. 3 months x -25% = -75. What would need to occur for the last 9 months to reach a total 2021 spending down -13%?
12 x -13% = -157 minus 3 x -25% = -75, therefore -157 minus -75 = -82. In the remaining nine months, Lodging would need to fall a cumulative 82%, or 82/9 = an average of 9%/month.
Well, the current rate of spending is down 25% yoy and construction starts the previous two years are down 60%. Cash flows seem to indicate spending will not increase this year. There is little hope of seeing an increase in monthly spending in 2021. Since new starts are less than half of only two years ago, spending is unlikely to increase from a monthly rate down 25% to a monthly rate down only 9% for the next nine consecutive months. Therefore this forecast is unlikely to play out. The ABC forecast is too optimistic.
*********************************
Now let’s look at the Moody’s forecast for lodging. To finish the year down -52%, monthly spending needs to average -52% for all 12 months of 2021. 12 months x -52% = -624. But 3 months, down cumulatively 25%, are already known. 3 months x -25% = -75. What would need to occur for the last 9 months to reach a total 2021 spending down -52%?
12 x -52% = -624 minus 3 x -25% = -75, therefore -624 minus -75 = -549. In the remaining nine months, Lodging would need to fall a cumulative 549%, or 549/9 = an average of 61%/month.
Well, the current rate of spending is down 25% yoy and construction starts the previous two years are down 60%. Cash flows are indicating monthly spending will drop 3% to 4% per month this year. Spending would need to decline 61-25=36% in one month and stay at that rate for the remainder of the year, OR, spending would need to start falling at a rate of 12%/month and continue 12% lower every month for the remainder of the year. By December, spending would be down over 100%, so this is not even feasible. Therefore this forecast cannot play out. The Moody’s forecast is far too pesimistic.
*********************************
Second, let’s look at Manufacturing. In the AIA initial 2021 Outlook, ABC forecast +6.5% and Moody’s forecast -3.4%. Current spending year to date through March is -9%. Are either of these forecasts achievable?
Manufacturing construction starts dropped 10% in 2019 and dropped another 57% in 2020. The seasonally adjusted annual rate (SAAR) of spending fell from $78bil in Q1 2020 to $71bil in Q1 2021, down 10%. The current rate of spending is coming in between 7%-11% below same month last year (yoy).
*********************************
Look at the ABC forecast for manufacturing. To finish the year up +6.5%, monthly spending needs to average +6.5% for all 12 months of 2021. 12 months x +6.5% = +78. But 3 months, down cumulatively 9%, are already known. 3 months x -9% = -27. What would need to occur for the last 9 months to reach a total 2021 spending up+6.5%?
12 x +6.5% = +78 minus 3 x -9% = -27, therefore +78 minus -27 = +105. In the remaining nine months, Manufacturing would need to gain a cumulative 105%, or 105/9 = an average of +12%/month.
Well, the current rate of spending is down 9% yoy and construction starts the previous two years are down 67%. Cash flows seem to indicate spending will continue to drop at a rate of 2% to 3% per month this year. There is little hope of seeing an increase in monthly spending in 2021. Since new starts are down 67% from two years ago, spending is unlikely to increase from a monthly rate down 9% to a monthly rate up 12%, a swing of 21%, for the next nine consecutive months. Therefore this forecast is highly unlikely to play out. The ABC forecast is far to optimistic.
*********************************
Now let’s look at the Moody’s forecast for manufacturing. To finish the year down -3.4%, monthly spending needs to average -3.4% for all 12 months of 2021. 12 months x -3.4% = -41. But 3 months, down cumulatively 9%, are already known. 3 months x -9% = -27. What would need to occur for the last 9 months to reach a total 2021 spending down +3.4%?
12 x -3.4% = -41 minus 3 x -9% = -27, therefore -41 minus -27 = -14. In the remaining nine months, Manufacturing would need to fall a cumulative -14%, or -14/9 = an average of -1.5%/month.
Well, the current rate of spending is down 9% yoy and construction starts the previous two years are down 67%. Cash flows are indicating monthly spending will drop 2% to 3% per month, every month this year. Spending would need to begin falling at a rate of only -1.5%/month and continue -1.5% lower every month for the remainder of the year. A decline of 67% in starts over the previous two years solidifies a rate of decline beyond that at near 3%/month. This scenario would depend on cutting the rate of decline in half for the remainder of the year, but the lack of starts in previous years provides no help to achieve that goal. The Moody’s forecast is too optimistic.
*********************************
It’s in your best interest to know how to assess the plausibility of forecast components before you question an analysis that varies widely from your preferred forecast. It may be your preferred forecast that is way off.

ABI – DMI – CBI Leading Indicators
The American Institute of Architects Architectural Billings Index
The Dodge Momentum Index
The Associated Builders and Contractors Construction Backlog Indicator
These three construction leading indicators are often referenced. Do you reference any of these indices? Do you know what the index represents?
The American Institute of Architects Architectural Billings Index, ABI, is a diffusion index, measuring work on architectural firms’ drawing boards, measured as above 50 if increasing and below 50 if decreasing. The index is comprised of survey responses from firms representing 45% institutional work, 40% commercial work and 15% residential work. The index is said to lead commercial construction spending by 11 months and institutional construction spending by 7 months. BUT, the correlation is this, the ABI is compared to “the percent change in year over year construction spending”.
https://content.aia.org/sites/default/files/2016-04/Designing-Construction-Future_3-14.pdf
Year over year percent change can provide skewed results. If last year construction spending was on a slow decline every month, and this year spending is level from month to month, that would show up as a continually increasing year over year percent growth. Because year over year spending percent is increasing, it could be misinterpreted that current year spending is growing, but it is flat. In another example, if last year construction spending was slowly increasing every month, and this year spending is slowly increasing every month at the same rate of growth, that would show up as no growth in year over year spending, but actual month to month spending is slowly increasing. Year over year spending can be influenced by last year activity as much as current activity and may not show the current trajectory in spending.
The Dodge Momentum Index, DMI, measures the earliest known indication of projects in planning. This includes only projects that are actually in design. The index is comprised of gathered results for nonresidential projects, excluding megaprojects and excluding manufacturing. The index is said to lead nonresidential construction spending by 12 months. However, it’s individual components could lead Institutional spending by 15 months and Commercial spending by 7 months. We see that the ABI refers to the point in time when the project is already under design and that leads spending by 7 to 11 months. It would be expected that the Dodge index has a longer lead time. As an indicator of early planning Dodge excludes projects that are about to go out to bid, preserving the intent of a leading indicator.
https://www.construction.com/download/Dodge_Momentum_Index_WhitePaper.pdf
The Associated Builders and Contractors Construction Backlog Indicator, CBI, attempts to measure the work in backlog, or growth in the value of work on contractor’s books. It measures the current month of total remaining value of projects in backlog (nonresidential only) divided by the previous fiscal 12 months total revenues, times 12. The resulting output purports to measure months of remaining backlog or remaining revenues. Of course, projects have varied schedules to completion that may take many more months if not years to complete, so contractors may not run out of work in the few months indicated by the CBI. Therefore, this index does not measure months to backlog extinction, it simply sets the result to base 12. It could just as well be times 100 and set to base 100. This index also may be influenced by something that occurred a year ago that may not reflect the current activity. What this index really measures is the current backlog as a percentage of previous fiscal year revenues, just skip the part that multiplies that percent times 12. It provides no indication of expected annual revenues. The ABC CBI has always produced a result around 8 to 9 months, that would indicate backlog is about 65% to 75% of previous year revenues.
Construction Analytics collected starts and spending data back to 2005, which is sufficient in turn to provide an analysis of backlog since 2010. With exception of residential, which has short durations and for which backlog is always only about 30%-35% of previous year revenues, for all other work, never was backlog shown to be less than the previous year spending.
https://abc.org/Portals/1/CEU/ABC%20CBI%20and%20CCI%20Methodology.pdf
Construction Starts – A Leading Indicator to Spending
Construction starts, although a general indicator that construction spending may be poised to grow (or fall), can also be misinterpreted. Construction starts refers to a total project value at a point in time, the contract award or the start date. For nonresidential construction, all projects that started prior to the beginning of a year will account for at least 80% of all spending within that upcoming year. Construction spending is that total project value spread out over the project scheduled duration from start to finish. Building construction spending peaks at 50% to 60% into the schedule.
Construction starts may be increasing, but rather than resulting in increased monthly spending, those starts may represent longer duration contracts. Increases in new starts does not always indicate an increase of monthly spending, but may instead represent lower monthly spending for a longer duration into the future.
All of these indices do not correlate directly to construction spending. To forecast construction spending, a cash flow schedule of all construction starts must be prepared. In any given month, spending on construction includes some monthly portion of spending from all projects that started in all previous months but that have not yet reached completion. A cash flow schedule of all monthly construction starts is the best indicator that directly forecasts construction spending.
Construction Analytics prepares estimated cash flow schedules from monthly reports of new construction starts and exclusively uses cash flow to forecast future construction spending. The cash flow schedule also allows to directly calculate the estimate to complete backlog in current $.
Know what an index represents before you put all your faith in following that index to develop your forecast.