Home » Posts tagged 'spending' (Page 7)
Tag Archives: spending
Construction Economics Brief Notes 3-10-18
3-10-18
Jobs and Volume
The period 2011-2017 shows both spending and jobs growth at or near record highs.
Construction added 1,339,000 jobs in the last 5 years. The only time in history that exceeded jobs growth like that was the period 1993-99 with the highest 5-year growth ever of 1,483,000 jobs. That same 1993-99 period had the previous highest 5-year spending and volume growth going back to 1984-88.
Construction added 185,000 jobs in the last 4 months. That’s happened, for any 4-month period, only 5 times since 1984. The last time was 2005-06, during the fastest rate of spending increases since 1984.
Nonresidential spending increased 43% since 2010, but there was 30% inflation. Real nonresidential volume since 2010 has increased by only 12%. Jobs increased by 27%, 15% in excess of volume growth.
Residential spending increased by 110% since 2010, but after inflation, real residential volume increased by only 57%. Jobs increased by only 37%, 20% short of volume growth.
Residential Construction Jobs Shortages
Inflation
Times of rapid spending growth are usually accompanied by higher rates of inflation.
Historical 20-year average total composite construction inflation, without including recession years, is 4.2%. When including the recession years, the average is 3.5%.
For the last 4 to 5 years average inflation for nonresidential buildings is 4.5% to 5%.
For the last 4 to 5 years average inflation for residential buildings is 5.5% to 6%.
Inflation in the highway sector averaged only 2.5% for last seven years. The power sector has experienced 5% deflation over the last 4 years.
Inflation in Construction 2018 – What Should You Carry?
Current$ vs Constant$
Construction spending reached a new high in 2017 at $1,236 billion in current $. The previous high in current $ was $1,161 in 2006. Spending surpassed that in 2014 and has been increasing since. But that is in current $, which includes inflation.
Comparing current $ spending to previous year spending does not give any indication if business is increasing. The inflation factor is missing. If spending is increasing at 4%/year in a time when inflation is 6%/year, real volume is declining by 2%.
After adjusting all spending to equivalent 2017$, we see that all years from 1997 through 2008 had greater volume than 2017. In 2005 volume reached a peak at $1,450 billion. While spending in current $ is 7% higher than the previous high spending, volume is still 15% lower than the previous high volume.
Spending
Total All 2018 construction spending is projected to increase 8% to $1.330 trillion.
Spending measured in current 2018$ will reach an all-time high, however, measured in constant inflation adjusted dollars, will still come in 14% below the 2005 high. When comparing inflation adjusted constant dollars, 2018 spending will still be lower than all years from 1998 through 2007.
Nonresidential Buildings new starts are up 60% in four years. 2018 starting backlog is the highest ever, up 15% from 2017. Spending for 2018 is projected to increase 9%. For 2018, Educational spending is projected to increase 14%, the strongest growth since 2007. Starting backlog increased 10%/year for the last three years. Manufacturing posted several very large project starts in 2017. Spending is projected to increase 12% in 2018.
Non-building Infrastructure 2018 starting backlog is the highest ever, up 10%+ each of the last 3 years. Spending reached an all-time high in 2015 and stayed within 0.3% of that high for 2016. Spending for 2018 is projected to increase 8% to an all-time high. Transportation terminals new starts in 2017 jumped 120%. Rail project starts increased more than 100%. Starting backlog for all transportation work is the highest ever, up 100% in the last two years. Spending is projected to increase 20-25%/year for the next two years.
Public construction is a subset of both Nonresidential Buildings and Non-building Infrastructure. Due to long duration job types, 2018 starting backlog is up 30% in the last 3 years. In 2018, 40% of all spending comes from jobs that started before 2017. Leading 2018 spending growth are Educational and Transportation with a combined total forecast 20% growth. Expect 2018 public spending to increase 6% to 8%, the best growth in 10 years.
Residential spending is more dependent on new starts within the most recent 12 months than on backlog from previous starts. Total starts for the last 6 months are the highest since 2006, but new starts in 2018 are projected at only +7%. Residential spending in 2018 is projected to increase only 6% after five years of increases over 10%.
2018 Construction Spending – Briefs 1-26-18
Infrastructure and Public Work
Only 60% of all Infrastructure spending is publicly funded. That public subset of work averages growth of less than $10 billion/year.
The two largest markets contributing to public spending are Highway/Bridge (32%) and Educational (26%), together accounting for nearly 60% of all public construction spending. At #3, Transportation is only about 10% of public spending.
Infrastructure construction spending is near all-time highs and has been for the last several years. Public spending is 10% ($30bil) below all-time highs, the largest deficits coming from Educational, Sewage/Waste Water and Water Supply.
Current levels of backlog and predicted new starts gives a projection that Public Non-building Infrastructure spending will reach an all-time high in 2018 and again in 2019.
Down the Infrastructure Rabbit Hole
For the latest info see 2018 Construction Spending Forecast – Mar 2018

Construction Spending is Back
3-9-18
We’ve all seen headlines like, “Construction Spending is back to previous level”, or “Construction Spending back to a new high.” Here’s how even true information can be deceiving.
It’s true, construction spending in current $ reached a new high in 2017 at $1,236 billion. The previous high in current $ was $1,161 in 2006. Spending surpassed that in 2014 and has been increasing since. But that is in current $, which includes inflation.
Let’s say a store will sell a bushel of apples, cost $100 in 2014, $110 in 2015, $120 in 2016 and $130 in 2017. If we look at the current $ spent on apples each year, it looks like business is booming, up 30% in 3 years. But the reality is, with the exception of inflation, the apple business has not changed at all. Only one bushel of apples sold every year. The year to year change in un-adjusted current $ is the increase in cost, not the increase in volume.
Comparing current $ spending to previous year spending does not give any indication if business is increasing. The inflation factor is missing. If spending is increasing at 4%/year in a time when inflation is 6%/year, real volume is declining by 2%.
Total construction spending in constant $ (inflation adjusted $) reached $1,236 billion in 2017. After adjusting all previous spending to equivalent 2017$, we can see that all years from 1997 through 2008 had higher volume than 2017. In 2000-2001 volume was just over $1,400 billion and in 2005 volume reached a peak at $1,454 billion. While spending in current $ is 7% higher than the previous high spending, volume is still 15% lower than the previous high volume.

Nonresidential buildings construction spending in constant $ (inflation adjusted $) reached $419 billion in 2017. Previous spending adjusted to equivalent 2017$ shows that all years from 1995 through 2010 had higher volume than 2017. Volume reached a peak $536 billion in 2000 and went over $500 billion again in 2008. Spending in current $ is almost back to the peak of $438 billion in 2008, but volume is lower than almost all years from 1985 to 2010 and is still 22% lower than the 2000 high volume.

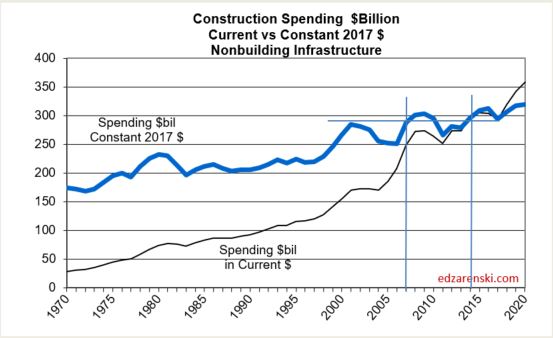
Non-building Infrastructure construction spending in constant $ reached $294 billion in 2017. Recent highs were posted in 2015 and 2016 at $305 billion and $304 billion and 2018 is expected to reach $319 billion. Previous spending adjusted to equivalent 2017$ shows that 2008 and 2009 were both just slightly higher than $300 billion. Volume reached a peak $313 billion in 2016. Spending in current $ hit new highs in 2015 and 2016. This is the only sector that has current $ and constant $ at or near all-time highs.
Residential buildings construction spending in constant $ reached $523 billion in 2017. Previous spending adjusted to equivalent 2017$ shows that all years from 1996 through 2007 had higher volume than 2017. Volume reached a peak $748 billion in 2005. Only the years 2004-2006 had higher spending in current $. The 2005 current $ peak of $630 billion is still 17% higher than 2017, but 2017 volume is still 30% lower than peak volume.

This has several implications besides misleading headlines that claim construction is at a new high. Just look at the period 1996-2007 on the residential plot. Spending in current $ increased 130% from $270 billion to $620 billion. But this was during a period that recorded some of the highest residential construction inflation on record. Inflation was 90%. Follow the guidelines up to constant$ and see that real volume increased only 40% from $530 billion to $750 billion.
If you are hiring to meet your needs and you see that spending (revenue) has increased by 130%, do you hire to meet revenue? No. Hiring requires a knowledge of volume growth. Residential jobs during this time frame increased by 55%, more than real volume growth, but no where near the 130% spending growth.
The above plots were developed using current and historical Census construction spending and inflation indices were developed from construction industry resources, documentation which can be found here on this blog.
See also
Residential Construction Jobs Shortages 2-3-18
Constant Dollar Construction Growth 11-2-17
Inflation in Construction 2018 – What Should You Carry? 2-15-18
ESCALATION / INFLATION INDICES

2018 Construction Outlook Articles Index
Articles Detailing 2018 Construction Outlook
Links will open in a new tab
These links point to articles here on this blog that summarize end-of-year data for 2017 and present projections for 2018.

Most Recently Published
July Construction Starts Fall but 3moAvg at New High
Construction Spending June 2018 8-1-18
June Construction Starts Reach New Highs 7-25-18
Construction JOLTS – What’s wrong with this picture? 7-10-18
Construction Spending 2016-2017 Revisions 7-1-18
New Construction Starts May 2018 Near All-Time High 6-24-18
Construction Spending April 2018 – 6-1-18
Notes on March 2018 Construction Spending 5-2-18
Construction Activity Notes 4-25-18
2018 Construction Spending Forecast – Nonresidential Bldgs 3-28-18
2018 Construction Spending Forecast – Mar 2018
Construction Economics Brief Notes 3-10-18
Construction Spending is Back 3-9-18
Publicly Funded Construction 2-28-18
PPI Materials Input Index 2-20-18
Down the Infrastructure Rabbit Hole 2-16-18
Inflation in Construction 2018 – What Should You Carry? 2-15-18
Residential Construction Jobs Shortages 2-3-18
2018 Construction Spending – Briefs 1-26-18
Cautions When Using PPI Inputs to Construction! 1-15-18
Indicators To Watch For 2018 Construction Spending? 1-10-18
Spending Summary 2018 Construction Forecast Fall 2017 12-3-17
Backlog 2018 Construction Forecast Fall 2017 11-10-17
Starts Trends 2018 Construction Forecast Fall 2017 11-8-17
In What Category is That Construction Cost? 11-15-17
Construction Jobs / Workload Balance 11-7-17
Constant Dollar Construction Growth 11-2-17
Is Infrastructure Construction Spending Near All-Time Lows? 10-10-17
Summary
2018 Construction Spending Forecast – Mar 2018
2018 Construction Spending – Briefs 1-26-18
Spending Summary 2018 Construction Forecast Fall 2017 12-3-17
Construction Spending is Back 3-9-18
2017 Results
2018 Construction Spending Forecast – Mar 2018
Spending Summary 2018 Construction Forecast Fall 2017 12-3-17
2018 Starting Backlog & New Starts
2018 Construction Spending – Briefs 1-24-18
Backlog 2018 Construction Forecast Fall 2017 11-10-17
Starts Trends 2018 Construction Forecast Fall 2017 11-8-17
Construction Starts and Spending Patterns 9-26-17
2018 Spending Forecast
2018 Construction Spending Forecast – Mar 2018
2018 Construction Spending – Briefs 1-26-18
So, About Those Posts “construction spending declines…” 10-4-17
Construction Spending Almost Always Revised UP 5-1-17
Nonresidential Buildings
2018 Construction Spending Forecast – Nonresidential Bldgs 3-28-18
2018 Construction Spending Forecast – Mar 2018
2018 Construction Spending – Briefs 1-24-18
Nonres Bldgs Construction Spending Midyear 2017 Forecast 7-24-17
Residential
2018 Construction Spending Forecast – Mar 2018
Residential Construction Jobs Shortages 2-3-18
Infrastructure Outlook
2018 Construction Spending Forecast – Mar 2018
Down the Infrastructure Rabbit Hole 2-16-18
2018 Construction Spending – Briefs 1-24-18
Is Infrastructure Construction Spending Near All-Time Lows? 10-10-17
Infrastructure – Ramping Up to Add $1 trillion 1-30-17
Calls for Infrastructure Problematic 1-12-17
Public Construction
2018 Construction Spending Forecast – Mar 2018
Publicly Funded Construction 2-28-18
Spending Summary 2018 Construction Forecast Fall 2017 12-3-17
Infrastructure & Public Construction Spending 3-5-17
Materials
PPI Materials Input Index 2-20-18
Jobs
Residential Construction Jobs Shortages 2-3-18
Construction Jobs / Workload Balance 11-2-17
Construction Jobs Growing Faster Than Volume 5-5-17
Inflation
Inflation in Construction 2018 – What Should You Carry? 2-15-18
Constant Dollar Construction Growth 11-2-17
Construction Inflation Index Tables UPDATED 2-12-18
Construction Cost Inflation – Commentary updated 2-13-18
US Historical Construction Cost Indices 1800s to 1957

Spending Summary Construction Forecast Fall 2017
3-15-18 see also 2018 Construction Spending Forecast – Mar 2018
12-2-17
Summary
Total construction spending in 2017 will reach $1,236 billion, an increase of 4.2% over 2016. Residential spending is above 10% growth for the 5th consecutive year.
Year-to-date construction spending growth through October is 4.1%.
Residential leads construction spending growth in 2017 for the seventh consecutive year, up 10.6%. My Nonresidential Buildings forecast has been lowered since July but finishes the year up 2.8%. Only Non-building Infrastructure will not improve over 2016, down 3.7% for the year. However, Non-building Infrastructure has been at an all-time high for the previous two years.

This forecast is down slightly since July due to reductions in both nonresidential buildings and non-building infrastructure. Educational, Office, Power and Highway, four of the five largest markets which together make up half of all nonresidential spending, were all lowered. Some of these markets are prone to very large post-annual upward revisions and that has the potential to add to 2017 spending when those revisions are released in July 2018. In the July 2017 revisions, Power spending for 2016 was revised up by 10%.
History shows spending has been revised up 51 times in the last 55 months. I wouldn’t be surprised to see future revisions smooth out spending in unusually low periods (April and July) and increase total 2017 spending above this forecast. I suspect revisions in July 2018 may show 2017 spending as high as $1,250 billion. The average post-annual total spending revision for the last five years is +2.3%. The total revision to 2016 was only 2.2%.
None of the spending detailed in this analysis includes any projections of potential work from future infrastructure stimulus.
Total construction spending in 2018 is currently forecast to reach $1,334 billion, an increase of 8.0% over 2017. For the first time since pre-recession, Non-building Infrastructure will lead all spending with potential to increase by 10% growth over 2017.
Non-building Infrastructure is forecast to lead 2018 spending with an increase of 10.2% due to very large projects in Power and Transportation. Nonresidential Buildings growth is strong for 2018, forecast up 9.3%. Residential spending in 2018 slows to only 5.7% growth after six years averaging 13%/year.
Total spending will reach a new high in 2018 for the third consecutive year. However, in constant $ adjusted for inflation, spending is just back to the level of 2008. The all-time constant $ high was reached in 2005. Adjusted for inflation, 2018 will still be 12% below that level. At current rates of growth, we would not eclipse the previous high before 2022.

Growth of 8% in 2018 or $100 billion in construction spending demands a few words on jobs growth. Construction requires about 5000 workers for every added $1 billion in construction volume. Construction jobs have never increased by 500,000 in one year. However, $100 billion in added spending is not the same as $100 billion in volume, and jobs grow based on volume. Although spending will increase 8%, construction inflation has been hovering near 4.5% to 5% for the last five years. Real volume growth in 2018 after inflation is expected to be just over 3% or $40 billion. That would mean the need, if there are no changes in productivity, is to add about 200,000 additional workers in 2018, a rate of jobs growth that is well within reach since that is below the average jobs growth for the last seven years.
Residential Buildings Spending
Total Residential spending in 2017 will finish at $523 billion, up 10.6% from 2016. Residential spending is above 10% growth for the 5th consecutive year.
Residential spending was expected to dip between May and October due to a low volume of work contributed from starts cash flows. The actual data shows, after reaching a seasonally adjusted annual rate (saar) of $536 billion in March, the high for the year, spending dropped 3% to 4% to as low as $515 billion saar three times and has averaged only $520 billion saar from April through October. New starts in Q1’17 reached an 11-year high, so I expect the rate of spending to increase at year end. Residential work will close out the year with 10.6% growth, the 5th consecutive year over 10%. Average growth the last six years is 13%/year.
Residential spending is 50% single family, 13% multi-family and 37% improvements.
Residential Improvements has posted 18% growth year-to-date. Single Family spending is up 9% while multi-family is up only 4%. That is compared to 2016 when improvements for the year finished up 10%, SF up 4% and MF up 5%. Census does not include flood damage repairs in improvements but does include full flood damaged structure replacements in improvements.
Total residential spending in 2018 slows to a forecast of $553 billion, only 5.7% growth over 2017.
Due to the shorter duration of projects, nearly 70% of residential spending within the year is generated from new starts. Unlike Nonresidential, backlog does not contribute nearly as much to Residential spending within the year. New Residential starts in Q1’17 reached an 11-year high. Residential starts are at a post-recession high.
Residential spending will reach a 12-year high in 2018. Adjusted for inflation, all years from 1996 through 2007 were higher. Inflation adjusted spending is still 30% below the all-time high reached in 2005.

Nonresidential Buildings Spending
Total Nonresidential Buildings spending in 2017 will come in at $420 billion, up only 2.8% from 2016.
Commercial/Retail is expected to finish the year with +13% growth and Lodging +9%. An unexplained surprise was Office, which by early indicators was predicted to show large gains in spending. Two independent sources reported new office starts in 2016 up 25% to 30%. Starting backlog coming into 2017 was near or at an all-time high. Spending was forecast to jumped at least 20% in 2017. Instead, spending posted declines from May to September and is now forecast to finish with only a 4% gain. This market accounts for the single largest miss in my forecast posted in Feb 2017.
The only major nonresidential building in decline this year is Manufacturing. Manufacturing spending was expected to fall in 2017 after peaking in 2015 from massive growth in new starts in 2014. Spending stayed close to that level in 2016. Based on cash flows from starts, spending was expected to decline in 14 of the last 18 months. It declined in 11 of those months. We are at the point of turn-around with only one monthly decline predicted in the next three months and no spending declines expected next year. For 2017, Manufacturing new starts are up 35%.

Nonresidential Buildings starts in the six months from Aug 2016 to Jan 2017 posted the (then) highest amount of new starts since Jan-Jun 2008, also the year Nonresidential Buildings spending peaked. Then new starts in the six months Apr-Sep 2017 just surpassed both those previous peak highs.
Nonresidential Buildings 2018 starting backlog is 50% higher than at the start of 2014, the beginning of the current growth cycle. Starting backlog has increased for five years at an average 10%/year. Spending from starting backlog, up 10% in 2018, increased for five years at an average 9%/year.
Total nonresidential buildings spending in 2018 is forecast to reach $458 billion, an increase of 9.3% over 2017. Office, educational and manufacturing make up 70% of the growth.
Nonresidential Buildings will reach a new high for spending in 2018, surpassing the previous 2008 high. However, adjusted for inflation, spending is 18% below the all-time high reached in 2000.
Non-building Infrastructure Spending
Total non-building infrastructure spending in 2017 drops to $293 billion, down 3.7% from 2016.
Non-building Infrastructure spending, always the most volatile sector, dropped to yearly lows from June through September. Infrastructure construction spending in August dropped to the lowest since November 2014. However, this was predicted. Cash flow models of Infrastructure starts from the last several years show current dips in monthly spending are being caused by uneven project closeouts from projects that started several years ago.
Current backlog is at an all-time high and spending will follow the expected increased cash flows from the elevated backlog. Environmental Public Works (Sewage/Waste disposal down 16%, Water Supply down 9% and Conservation/Dams & Rivers down 7%) posted the largest declines in 2017 and accentuated the declines in the infrastructure sector. The sector is expected to increase slightly in the last quarter 2017. In recent months there are already substantial gains being posted in Conservation and Transportation.
No future growth is included from infrastructure stimulus and yet 2018 is projected to increase by 10%.

Total non-building infrastructure spending in 2018 is forecast to reach $324 billion, an increase of 10.5% over 2017. My forecast for 2018 is predicting every infrastructure market will post gains, but it is the Power and Transportation markets that account for almost all the growth in 2018. Transportation new starts in 2017 grew 120% due to massive new air terminal and rail projects. Spending growth in the Power market is not quite so apparent. Combined Power new starts are down for both 2016 and 2017, but the spending gains are coming from projects that started in 2015, a year in which starts were up over 120%.
Non-building Infrastructure will reach a new high for spending in 2018. This sector had posted a new high in 2015 and nearly equaled that in 2016. Adjusted for inflation, spending in 2018 will be nearly equal to the all-time highs reached in 2015 and 2016.

Public Spending
Total public spending for 2017 remains flat at $287 billion with most major public markets down for the year.
At midyear, I expected Educational and Highway to support a Public spending increase in 2017. Those gains did not materialize. A decline in Highway spending offset small gains in Educational. By far the largest Public spending decline is in Sewer and Waste Disposal, down 16%.
Public spending hit the low for the year in July. It increased for the last three months, most recently by an 11% increase in Public Educational spending in October. We are now near the high for the year and can expect to see another six months of growth before spending levels off in mid-2018.

When you see graphics that present Residential, Nonresidential and Public spending all on the same plot, they are not additive. Only Residential and Nonresidential can be added to reach total spending. Public is a subset of Nonresidential, composed partly of Nonresidential Buildings (~40%) and partly Non-building Infrastructure (~60%), with a slight amount of residential.
The two largest markets contributing to public spending are Highway/Bridge, 32% of total Public spending, and Educational, 25% of Public spending. The third largest market, Transportation, is only about 10% of Public spending. Environmental Public Works combined makes up almost 15% of public spending, but that consists of three markets, Sewage/Waste Water, which accounts for 8%, Water Supply and Conservation. Office, Healthcare, Public Safety and Amusement/Recreation each account for about 3%.
All of Highway/Bridge is Public spending. Only 80% of Educational spending is Public and only 70% of Transportation is Public. Environmental Public Works markets are 99% Public.

Total Public spending in 2018 is forecast to reach $305 billion, an increase of 6.3% over 2017. Public spending in 2018 will reach the highest year over year growth since 2008.
Educational and Transportation will contribute equally and together account for almost 60% of the Public spending growth in 2018. Transportation new starts in 2017 grew 120% due to massive new air terminal and rail projects. Educational new starts total for the last three months posted the highest quarter in at least seven years. The 2nd highest quarter was also within the last 12 months, so still contributes fully to 2018 spending. 2018 signifies a turn-round in Public spending which has not posted significant growth since the recession.
See this companion post for Starts Trends Construction Forecast Fall 2017 11-8-17
After New Starts, dollars are tracked in Backlog, Backlog Construction Forecast Fall 2017 11-10-17
For more on Jobs and Workload see Construction Jobs / Workload Balance 11-7-17
For effects of inflation see Constant Dollar Construction Growth 11-2-17

In Which Category is That Construction Cost?
Seldom do two sources present information the same way!
In the construction industry, a disconnect exists in the reporting of construction starts data and actual spending data. Problems may arise when data is used to perform comparisons or forecasts between starts and spending. New starts and backlog may be listed in one category and spending for the same markets may be listed in another.
Almost universally, reporting of actual construction spending data follows the U.S. Census Put-in-Place Spending format. I adjust all other construction starts input/forecasting data that I use to conform to these Census Construction Spending Put-in-Place definitions. Here are some pitfalls to be aware of:
The U.S. Census Construction Put-in-Place (Construction Spending) Release follows these definitions.
Residential spending $ includes about 35% renovations and improvements that has no units associated with the dollars, so that portion of $ should not be included in a comparison to housing starts.
In census spending, MF dormitories is in educational and all types of MF healthcare related homes are in healthcare.
Demolition is not included in renovations/improvements. Partial repair of flood damaged homes is NOT included in residential improvements. Full replacement of flood damaged homes is included as improvements, not new single family. Here is the US Census definition of flood repairs
Offices includes pubic buildings such as city halls and courthouses. Includes data centers and bank buildings. Excludes medical office buildings, offices at manufacturing sites and offices at educational or healthcare facilities. Excludes Public Safety.
Commercial includes all retail buildings, warehouses, parking lots and garages. Excludes parking at educational/healthcare facilities.
Census DOES separate the costs for buildings that are mixed use retail/office/residential.
Educational, along with K-12, includes administrative offices, health centers, parking, residence halls, classrooms, educational research labs, food service and sports/recreation facilities at schools or colleges and universities and all associated infrastructure and maintenance facilities at the educational site. Also includes public libraries, science centers and museums.
Healthcare includes similar support and infrastructure to educational. Also includes medical office buildings, non-manufacturing and non-educational research labs.
Amusement and Recreation includes performing arts centers, civic centers, convention centers, sports and recreation facilities not located at schools or colleges.
Transportation includes air freight and passenger air terminals, runways, bus and railroad passenger terminals, light rail and subway facilities, railroad track, railway structures and bridges, docks and marine terminals and maintenance facilities and infrastructure associated with each.
Some sources of design or new construction starts data carry terminal buildings as commercial buildings, institutional buildings or other public nonresidential buildings. Census caries the building cost of all terminals grouped in with the non-building infrastructure costs of Transportation. Some sources carry public buildings such as city halls and courthouses as Public Safety but Census carries cost data for public buildings such as city halls and courthouses in Offices. Some sources classify laboratories as commercial and warehouses as industrial/manufacturing but Census includes warehouses in Commercial and Labs, depending on use, can be either Educational, Healthcare or Manufacturing.
Dodge Data New Construction Starts
Dodge includes monthly New Construction Starts for Terminals and Courthouses in Other Institutional Buildings, a Nonresidential Buildings category. The Census actual spending report includes Terminals in Transportation and Courthouses in Offices.
Although all of these still remain in Non-building Infrastructure, Dodge includes Rail, Mass Transit, Airport Runway and Pipelines in Other Public Works. Although not often mentioned by Dodge, it is assumed Communications is also included in Other Public Works. Census includes all mass transit in Transportation, Communications is listed separately and pipelines are included in Power.
Dodge does not identify Renovations in their residential starts data. Census reports SF and MF spending and Total Residential spending with the difference between Total and SF+MF being Renovations. Multifamily spending accounts for less than 15% of all residential actual spending. Dodge MF starts account for 30% of all residential starts dollars. Furthermore, Dodge totals for MF starts $ for the last 7 years exceed the actual total of MF spending for the year by 30% to 50%. Dodge MF data represents more than just MF starts. Which may mean it includes renovations starts. It might also include student housing.
Constructconnect (CC) Construction Starts Forecast
New starts for Transportation Terminals is in a line by the same name but subtotaled in Commercial (Nonresidential Buildings) starts. Census includes Terminals in Transportation.
CC lists Courthouse starts subtotaled in Institutional. Census carries Courthouses in Office (Commercial).
CC lists Military as a line item subtotaled in Institutional. This might include Office, Housing, Warehouse, etc., which would be carried by Census in Office, Residential, Commercial, etc., respectively.
CC lists Laboratories (Schools & Industrial) together and subtotals all labs in Commercial. Census separates labs by commercial, research and educational and carries spending in Manufacturing, Healthcare or Educational respectively which would subtotal spending in Manufacturing (industrial), or Institutional (Healthcare and Educational).
CC does not list rail or transportation separately, but does list Airport and Misc Civil (Power,etc.). This leads me to think rail is included in the line item with Misc Civil (Power, etc.). Also, CC does not list Communication, which I suspect is included in Misc Civil (Power, etc.) Already noted above is that Terminals is subtotaled in Commercial. Census carries rail, runway and terminals in Transportation and keeps Communication and Power separate from others.
CC provides an alternate table of new starts data that corresponds to a proprietary software, INSIGHT. This table of starts data reshuffles categories very far from anything that would resemble Census spending output.
The AIA publishes a twice annual Consensus Construction Forecast, comparing forecast of Nonresidential Buildings spending using inputs from seven or eight firms. Every firm but one follows a similar organization. The difference is FMI includes both Transportation and Communications in Commercial Nonresidential Buildings. I’m not aware of another other firm that reports these two categories of spending as Nonresidential Buildings. Both are typically carried as Non-building Infrastructure. That these categories include costs for projects such as rail beds, rail right-of-way civil structures, loading platforms, airfield runways and support structures, communication transmission lines and cell towers supports the more standardized inclusion of these items in Infrastructure.
Similar discrepancies may exist when comparing starts or spending to indexes, such as the AIA Architectural Billings Index, which broadly classifies projects as commercial, institutional or residential. Some resources classify Amusement/Recreation as institutional and some as commercial. In particular, the shifting of costs between Nonresidential Buildings and Non-building Infrastructure creates a particularly meaningful disparity between spending forecasts.
As you can see, there are numerous instances where the data are often mixed up. From the point of view of the forecaster, initial input data cannot always be used directly to forecast or match spending output. Some manipulation of the data may be required to make input and output match.
As an example, I move the Dodge data starts for Terminals from nonresidential buildings to non-building infrastructure Transportation, so that really changes my totals from theirs for Nonresidential Buildings to Non-building Infrastructure. My spending output conforms with most all others, most of whom also follow the Census PIP definitions.
What does your source for data take into consideration? Know your data!

Ahead of the Sept Construction Spending Forecast
10-25-17
On November 1, September construction spending will be released. The September spending release is always a solid turning point for the 2017 forecast. Here’s a few facts leading into the forecast which will incorporate this data and be posted soon after the 11-1-17 spending release.
2017 construction spending will come in at $1,250 billion, up 5.5% from 2016.
Largest $ contributors to growth in 2017 spending: Residential $56b, Commercial Retail $12b, Office $6b.
Largest $ declines in 2017 spending: Manufacturing -$8b, Public Works -$6b.
Total construction spending averaged 8%/yr growth last 6 yrs (2014 & 2015 at 11%). Expect 6% in 2018, 5% in 2019
Construction spending on Infrastructure leads growth for the next 3 years and it has nothing to do with an infrastructure spending bill.
Infrastructure spending in 2018 is led by Power and Transportation markets.
Most of the 2018 spending in the Power market will be generated from starts in 2016. Equally strong 2017 starts will generate most of the Power spending in 2019.
Public construction spending in 2018 will reach highest yr/yr growth rate in over 10 years powered by Educational spending.
Commercial/Retail spending in 2018 slows but most other nonresidential buildings still show strong growth, especially Office and Educational.
Residential spending slows to a crawl after more than 100% growth in last 6 years. Currently predicting only 5% to 6% growth over next 2 years.
Residential spending may change during the year because, while spending in all other markets is dependent on starting backlog, residential spending is primarily dependent on new starts within the year
Largest $ contributors to growth in 2018 spending: Power $22b, Office $15b, Educational $10b, Transportation $5b.
Largest $ declines in 2018 spending: none greater than -$2b.
Nonresidential Buildings and Infrastructure construction will both hit new all-time highs for starting backlog in 2017 and 2018. Both will see a 9% increase in spending in 2018.

Infrastructure construction spending never dropped due to the recession as much as Nonresidential Buildings or Residential.
Nonres Bldgs dropped 35% from $438bil in 2008 to $284bil in 2011.
Residential dropped 60% from $630bil in 2005 to $252bil in both 2010 and 2011.
Infrastructure declined only 8% from $274bil in 2009 to $251bil in 2011. It rebounded to $305bil in 2015, a new high.
Nonres Bldgs spending is just 3% below the previous high but residential is still 16% below 2005.
In constant$, adjusted for inflation, Nonres Bldgs peaked at $537bil in 2000 and Residential peaked at $755bil in 2005.
Nonres Bldgs is still 21% below the inflation adjusted peak. Residential is still 30% below.
Infrastructure reached an inflation adjusted peak in 2009 at $300bil. It hit a new high in 2016 at $313bil and in currently down 6% from that high. It will set a another new high in 2018.

Watch for the new 2017-2018 Spending Forecast to be posted within the week after the September data is released 11-1-17.
These other recently posted articles also have information relative to the 2017-18 forecast
Is Infrastructure Construction Spending Near All-Time Lows?
Construction Starts and Spending Trends 2017-2018

Is Infrastructure Construction Spending Near All-Time Lows?
10-10-17
Is Infrastructure construction spending near all-time lows? This question is raised because I saw comments to this affect recently posted on a major national construction professional organization twitter feed.
First, this raises several other questions:
- Exactly what construction markets are being referenced as infrastructure?
- Does this reference include public work only, or both public and private?
- Are educational and health care being included as infrastructure?
- Does this reference constant inflation adjusted spending?
The construction markets typically referred to as infrastructure, in order of largest to least volume, include; Power, Highway, Transportation, Sewage/Waste Water, Communications, Water Supply and Conservation. Sometimes also considered are Educational (3rd after Highway), Healthcare (after Transportation) and Public Safety (2nd smallest).
If only public work is included, everything changes. Most (90%+) of Power spending is private, so it represents less than 3% of public work. The largest contributors in this case are: Highway (32% of public work), Educational (25%), Transportation (11%), Sewage (8%) and Water Supply (4%). No other market is greater than 3% of public work.
And finally, is the reference to current dollars as originally spent within each year, or to constant inflation adjusted dollars, adjusting all historical expenditures to constant 2017 dollars? Any comparison to determine if real growth has occurred should be in constant dollars, in this case all adjusted to 2017.
Typical infrastructure, not including educational, healthcare or public safety, but including all public and private sector work produces this result:

However, the most likely reference is to typical public infrastructure, not including educational, healthcare or public safety. This scenario includes only the public sector work of typical infrastructure and eliminates private spending. This eliminates 90%+ of all power work, 30% of transportation and 100% of communications, in total, more than $100 billion in current dollars. This is the result:

In both instances, the lows, whether using current or constant dollars, occurred between 1993 and 2004. The highs are recent, all occurring from 2007 to 2016. 2017 spending dropped somewhat from 2016, but this is still prone to revision, which is always up.
To answer the question, Is Infrastructure construction spending near all-time lows? NO! Infrastructure construction spending is not at or even near all-time lows. Public sector infrastructure is lower than All infrastructure, but All infrastructure is not even near recent lows. It is near all-time highs!
Infrastructure construction spending in June-August dropped to the lowest since November 2014. However, this was not unexpected. Cash flow models of infrastructure starts from the last several years show monthly spending dips and peaks. Current dips in spending are being caused by uneven project closeouts from several years ago. The actual current backlog is at an all-time high and spending will follow the expected cash flow.

Infrastructure starting backlog hit a new all-time high in 2017 and will again in 2018. Public Infrastructure new starts reached all-time highs in 2013 and 2015 and are on track to go higher in 2017. 80% of infrastructure spending within the year comes from backlog at the start of the year and that backlog may be comprised of jobs one, two, three and even four years old.
Infrastructure spending in 2017, although down slightly from the all-time high reached in 2015 and nearly equaled in 2016, will reach a new high in 2018.
(This analysis does not include any spending projections from an infrastructure investment bill).
Highway spending is currently benefiting from projects that started in 2015 but that have unusually high value and long duration. They contribute spending well into 2018 beyond the duration that typical projects have ended.
Transportation Terminal starts in the first three months of 2017 were more than three times higher than any three-month period in the previous five years. However, 2017 spending is still affected by uneven starts from two to three years ago, holding down gains in the 2nd half. Transportation will show only a 1% gain in 2017 but produces double digit gains in 2018.
Infrastructure construction spending is near all-time HIGHS and has been for the last several years. That is not meant to indicate there is no need for infrastructure investment. I think the need is well established, particularly for public infrastructure. However, I’ve been writing about infrastructure for more than a year, pointing out the level of activity in this sector and the difficulty that will arise when we try to increase work volumes. The approach to adding new work and the discussions surrounding this approach should reference accurate data, and that should include an accurate representation of current workload and future ability to absorb more work.
For much more in-depth related to infrastructure construction see this post Infrastructure Spending & Jobs

So, About Those Posts “construction spending declines…”
You know those articles you’ve been seeing, “Worst year for construction spending since 2010″, well there’s some truth to that, BUT
2017 is the 6th year of the expansion. It has slowed, but… Here comes the BUT!
10-4-17 – Construction numbers are at all-time highs! Slowing or not, activity is very strong. Looking behind the headlines, here’s what we see;
Residential construction spending is slowing the most, from +11% in 2017 to only +2% in 2018 after six years averaging 13%/yr. Nonresidential buildings spending this year just kept up with the rate of inflation (4%), none-the-less, it’s at record highs. It doubles that rate of growth to 8% in 2018. Non-building infrastructure, down 2% in 2017, next year expect growth of 10%+, coming from long duration jobs.
The real performance numbers in Infrastructure are completely hidden. Spending was near flat for three years. But during that time, contrary to every other sector which experienced inflation of 15%, Non-building Infrastructure experienced deflation of 7%. (Gee, didn’t I read somewhere that activity within a sector is a primary driver of inflation?) Anyway, flat spending means volume really increased by 7% during that time. Spending by itself never tells the whole story!
There were some expected dips in spending recently, Manufacturing, Power, Highway, and there will be more in early 2018. BUT, there are also expected boosts in spending, Office, Commercial/Retail. Some of these already have matched up with the forecast, and there are more to come in 2018, Power, Transportation.
All Nonresidential Backlog is at record highs.

Buildings and Infrastructure will both hit new all-time highs for starting backlog in 2017 and again in 2018. For four years, from 2010 to 2013, all nonresidential backlog remained fairly constant. Since then, backlog for infrastructure is up 30% and for buildings it’s up 60%. (75% to 80% of nonresidential spending within the year comes from backlog at the start of the year. For residential, 70% of spending comes from new starts within the year.) Buildings will hit spending records in both 2017 and 2018. Infrastructure spending will hit a new high in 2018.
Ignoring for the moment that comparing any month to the same month last year can be grossly misleading as to the direction the markets are headed (for reasons explained in other recent posts on this blog), 2017 total spending growth is the lowest % yr/yr growth since 2011 (not 2010). Does that make it “worst”?
Spending will gain +5.6% in 2017, the least gain in six years. Last year was +6.5%, 2013 was +6.6%. The average for the last six years is +8%. So 2017 is the worst. Pretty damn good worst!

August Construction Spending 10-2-17
Data released 10-2-17
Preliminary Report August Construction Spending
August construction spending was posted today at $1.218 trillion, up 0.5% from the 1st revision to July.
- Residential spending is up 0.5% from July, up 12.3% YTD.
- Nonresidential Buildings spending is up 1.8% from July, up 4.5% YTD.
- Non-building Infrastructure is down 0.5% from July, down 3.4% YTD.
Year-to-date through August posted at $806 billion, up 4.7% from same period 2016.
What you should know – Revisions:
Since the bottom of the recession in January 2011, through June 2017 (78 months), spending vs the prior month was 1st reported down 42 times. Values were revised up 64 times, but not all months turned positive. After revisions, spending was down vs the prior month fewer than 20 times.
Monthly values are revised the next two months after initial release. Spending has been revised UP 15x in last 18 months. The average revision in following two months is +1.0%. This table shows the growth before and after revisions this year. Notice, spending was 1st reported down vs the prior month 5 times through June. After revisions spending is down only twice.

All values for the year are revised again in following May data report. The final revision has been UP 49 of the last 53 months. Average post-annual revision 2016 +2.2%; 2015 +4.3%; 2014 +4.4%. The average post-annual revision for the last 4 years is just over 3%.
Year-over-year and year-to-date comparisons of construction spending are generally understated by about 2% to 3% until the final revision of spending data is posted in May the following year.
Year-to-date construction spending through August is posted at $806 billion, up 4.7% from same period 2016. However, the post-annual revision has already been applied to all months in 2016. The same revision will not be applied to 2017 data until May 2018 data is published next year, so current YTD is always understated. Based on post-annual revisions for the last 4 years, adjustments range between +2% and +4%. The most recent six months has averaged +2.4%. So YTD 2017 spending will very likely increase and could be in the range of 6% to 8%.
Market Specific Revisions
Specific markets vary both higher and lower than the average revision. For example Power has been revised on average +10%, while Educational was revised less than 2%. Highway and Transportation revisions have averaged less than 1% over the last 18 months.
Construction Spending Revisions After 1st Release Through August Data:
Every month this year except April has been revised UP. The April data looks like such an anomaly (largest monthly decline since the recession) that I expect next May we will see April get revised up by +1% to +1.5%. July data gets revised next month and I expect to see an additional +1% to +1.5%.
- Total Construction UP 49 of last 53 months, avg 3.7%/mo.
- Total Construction UP 17 of last 19 months, avg 2.5%/mo.
- Residential revised UP 30 of last 31 months, avg 6.8%/mo.
- Residential UP 18 of 19 avg 3.6%/mo.
- Commercial UP 18 of 19 avg 5.7%
- Educational UP 13 of 19 avg 1.7%
- Power UP 19 of 19 avg 10.7%
- Commercial/Retail May +6.7%, June +3.8%, July +3.7%
- Lodging May +4.3%, June +0.2%, July +1.4%
- Educational May -0.7%, June +3.4%, July -1.8%
- Transportation May +3.5%, June +2.1%, July -1.8%
Spending Forecast
2017 construction spending is expected to reach $1,252 billion, up 5.6% from 2016. Average annual rate of spending will increase to $1,300 at year end. I wouldn’t be surprised to see future revisions to Mar-Apr-May spending smooth out that erratic period and add to total $ 2017.
In my forecast, I rely on the revision data by market to add a conservative adjustment for expected normal revisions.
My current Forecast has spending year-to-date through August up nearly 6% over 2016. Spending in the 2nd half 2017 will increase 1.5% to 2% over the 1st half 2017 and will increase more than 5% over the 2nd half 2016.
- All sectors have already hit spending lows for the year and will increase 4% to 8% over the next six months.
- Infrastructure will finish the year with totals down 2%, but the annual rate of spending could potentially increase 8% from July to year end. 2018 shows 11% growth.
- Nonresidential Buildings may finish up 5% in 2017, the sixth consecutive year of growth. For 2018 expect 8% growth.
- Residential spending will be up nearly 12% for 2017, the sixth year over 9%. Spending growth in 2018 slows to 2%.
- Backlog and the share of spending within the current year from that backlog is at an all-time high for nonresidential buildings and non-building infrastructure.
- Public work for 2017 will finish down 1.5%. By far the largest public spending declines are in Environmental Public Works, especially Sewer and Waste Disposal.
- Public spending is headed for a sizable rebound in 2018, up 9%.
- Every large Public category is forecast to show solid growth from the 4th qtr 2017 through all of 2018.
- This analysis does not include any spending projections from an infrastructure investment bill.
- Largest declines 2017; Manufacturing -11% ytd; Environmental Public Works -16% ytd.
- Largest increases 2017; Office +10% ytd; Commercial +16% ytd; Residential +13% ytd.

See this article Construction Starts and Spending Trends 2017-2018 for more on spending trends
