Home » Forecast (Page 14)
Category Archives: Forecast

Construction Cost Inflation – Commentary 2019
1-28-20 See the new post Construction Inflation 2020
8-10-19 updated plots and commentary
General construction cost indices and Input price indices that don’t track whole building final cost do not capture the full cost of escalation in construction projects. To properly adjust the cost of construction over time you must use actual final cost or selling price indices.
Click Here for Link to a 20year Table of 25 Indices
Inflation in construction acts differently than consumer inflation. When there is more work available, inflation increases. When work is scarce, inflation declines. A very large part of the inflation is margins, wholesale, retail and contractor. When nonresidential construction was booming from 2004 through 2008, nonresidential final price inflation averaged almost 8%/year. This was at a time when input costs were averaging between 5% and 6%/year. When residential construction boomed from 2003 to 2005, inflation in that sector was 10%/year. But from 2009 through 2012 we experienced deflation, the worst year being 2009. Residential construction experienced a total of 17% deflation from 2007 through 2011. From 2008 to 2010, nonresidential buildings experienced 10% deflation in two years.
The following plots are all the same data. Different time spans are presented for ease of use.


8-10-19 note: this 2005-2020 plot has been revised to include 2018-2020 update.

Nonresidential Buildings – Since 1993, the 25-year long-term annual construction inflation has averaged 3.5%, even when including the recessionary period 2007-2011. Long-term average inflation, without recessionary declines, is 4% for 20 non-recessionary years since 1993. During rapid growth period of 5 years from 2004-2008, inflation averaged 8% per year. Since 2011, nonresidential buildings inflation has averaged 3.8%, averaging 4.25%/yr. for the last 4 years with a high of 5.1% in 2018.
Residential, from 2007- 2011 experienced 5 consecutive years of deflation, down 20%. In the 4-year boom just prior to that, 2003-2006, inflation averaged 9% per year. Residential inflation snapped back to 8.0% in 2013. It slowed to 4.4% in 2018 but has averaged over 5% for the last three years.
Construction Spending growth posted two separate 4-year periods of 40%+ growth, up 41% in 2012-2015 and up 40% in 2013-2016, exceeding the growth during the closest similar four-year periods 2003-2006 (+37%) and 1996-1999 (+36%), which were the two fastest growth periods on record with the highest rates of inflation and productivity loss. Growth peaked at +11%/year in 2014 and 2015, exceeded only slightly by 2004-2005.
Spending growth slowed to 7.0% in 2016 and only 4.5% in 2017. In 2018, spending dropped to a gain of only 3.3%. It’s expected, after revisions that 2019 spending will finish at a gain of less than 2%.
Producer Price Index (PPI) Material Inputs (excluding labor) costs to new construction increased +4% in 2018 after a downward trend from +5% in 2011 led to decreased cost of -3% in 2015, the only negative cost for inputs in the past 20 years. Input costs to nonresidential structures in 2017+2018 average +4.2%, the highest in seven years. Infrastructure cost are up near 5% and single-family residential inputs are up 4%. But material inputs accounts for only a portion of the final cost of constructed buildings.
Labor input is currently experiencing cost increases. When there is a shortage of labor, contractors may pay a premium to keep their workers. All of that premium may not be picked up in wage reports. Also, some of the labor inflation is due to lost productivity due to less skilled workforce. Unemployment in construction is the lowest on record. There is some sign of jobs growth slowing down in Q2 and Q3 2019, and potentially getting slower.
Nationally tracked indices for residential, nonresidential buildings and non-building infrastructure vary to a large degree. When the need arises, it becomes necessary that contractors reference appropriate sector indices to adjust for whole building costs.
Click Here for Link to a Table of 25 Index Values
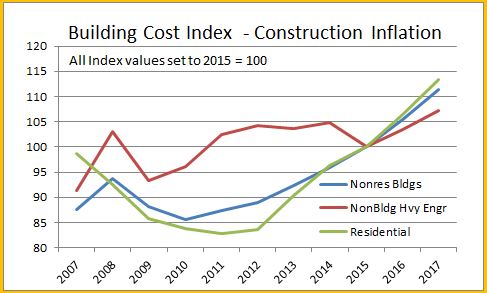
ENRBCI and RSMeans input indices are prefect examples of commonly used indices that DO NOT represent whole building costs, yet are widely used to adjust project costs. An estimator can get into trouble adjusting project costs if not using appropriate indices. The two input indices for nonresidential buildings did not decline during the 2008-2010 recession. All other final cost indices dropped 6% to 10%.
From 2010 to 2019, total final price inflation is 110/80 = 1.38 = +38%. Input cost indices total only 106/85 = 1.25 = +25%, missing a big portion of the cost growth over time.

CPI, the Consumer Price Index, tracks changes in the prices paid by urban consumers for a representative basket of goods and services, including food, transportation, medical care, apparel, recreation, housing. This index in not related at all to construction and should never be used to adjust construction pricing. Historically, Construction Inflation is about double the CPI. However for the last 5 years it averages 3x the CPI.
Taking into account the current (Jan 2018 12 mo) CPI of 2% and the most recent 5 years ratio, along with accelerated cost increases in labor and material inputs and the high level of activity in markets, I would consider the following forecasts for 2018 inflation as minimums with potential to see higher rates than forecast.
Residential construction, from 2007- 2011, experienced five consecutive years of deflation, down 20%. In the 4-year boom just prior to that, 2003-2006, inflation averaged +9% per year. Residential construction inflation saw a slowdown to only +3.5% in 2015. However, the average inflation for five years from 2013 to 2017 is 6%. It peaked at 8% in 2013. It climbed back over 5% for 2016 and reached 5.8% in 2017. For 2018, residential final cost inflation indexes are up only 4.5%. Residential construction inflation for 2019 is now about 4% to 4.5%.
A word about Hi-Rise Residential. About 95% of the cost of a hi-rise residential building would remain the same whether the building was for residential or nonresidential use. This type of construction is totally dis-similar to low-rise residential, which in large part is stick-built single family homes. Therefore, a more appropriate index to use for hi-rise residential construction is the nonresidential buildings cost index.
Nonresidential Buildings inflation, during the rapid growth period of five years from 2004-2008, averaged 8% per year. Inflation averaged near 4% per year for the 4 years 2014-2017.
Several Nonresidential Buildings Final Cost Indices averaged over 5% per year for the last 2 years and over 4% per year for the last 5 years. Nonresidential buildings inflation totaled 22% in the last five years. Input indices that do not track whole building cost would indicate inflation for those four years at only 12%, much less than real final cost growth. For a $100 million project escalated over those four years, that’s a difference of $8 million, potentially underestimating cost.
Nonresidential buildings spending slowed from 2017 to 2019 but is now entering a phase in which it may reach the fastest rate of growth in three years, which historically leads to accelerated inflation. Construction inflation for nonresidential buildings for 2018 and 2019 was 5%/yr. For 2020 expect 4.25%, rather than the long term average of 3.5% to 4.0%.
Non-building infrastructure indices are so unique to the type of work that individual specific infrastructure indices must be used to adjust cost of work. The FHWA highway index increased 17% from 2010 to 2014, stayed flat from 2015-2017, then increased 6%+ in 2018. The Highway index for 2019 is up about 6%. The IHS Pipeline and LNG indices increased in 2018 but are still down 20% since 2014. Coal, gas, and wind power generation indices have gone up only 6% in seven years. Refineries and petrochemical facilities have dropped 5% in 4 years but 2018 regained the level of 2013. Input costs to infrastructure are down slightly from the post recession highs, but most have increased in the last year. Input cost to Highways are up 5.0% and to the Power sector are up 3.6% in 2018. Work in Transportation and Pipeline projects has increased dramatically in 2017 and 2018.
Infrastructure power indices registered 2.5% to 3.5% gains in 2017 and again in 2018. Highway indices increased 6.6% in 2018. Anticipate 4% inflation for Power sector and at least 5%-6% inflation for Highway in 2019 with the potential to go higher in rapidly expanding markets, such as pipeline or highway.
This plot for nonresidential buildings only shows bars representing the predicted range of inflation from various sources with the line showing the composite final cost inflation. Note that although 2015 and 2016 have a low end of predicted inflation of less than 1%, the actual inflation is following a pattern of growth above 4%. The low end of the predicted range is almost always established by input costs, while the upper end of the range and the actual cost are established by selling price indices.
8-10-19 note: this 2005-2020 plot has been revised to include 2018-2020 update.

A word about terminology: Inflation vs Escalation. These two words, Inflation and Escalation, both refer to the change in cost over time. However escalation is the term most often used in a construction cost estimate to represent anticipated future change, while more often the record of past cost changes is referred to as inflation. Keep it simple in discussions. No need to argue over the terminology, although this graphic might represent how most owners and estimators reference these two terms.

In every estimate it is always important to carry the proper value for cost inflation. Whether adjusting the cost of a recently built project to predict what it might cost to build a similar project in the near future or adding an escalation factor to the summary of an estimate for a project with a midpoint 2 years out, or answering a client question, “What will it cost if I delay my project start by one year?”, whether you carry the proper value for escalation can make or break your estimate.
- Long term construction cost inflation is normally about double consumer price inflation (CPI).
- Since 1993 but taking out 2 worst years of recession (-8% to -10% total for 2009-2010), the 20-year average inflation is 4.2%.
- Average long term (30 years) construction cost inflation is 3.5% even with any/all recession years included.
- In times of rapid construction spending growth, construction inflation averages about 8%.
- Nonresidential buildings inflation has average 3.7% since the recession bottom in 2011. It averaged 4.6% for the 4 years 2016-2019.
- Residential buildings inflation reached a post recession high of 8.0% in 2013 but dropped to 3.5% in 2015. It averaged 4.6% for the 4 years 2016-2019, but is at the low point of 3.3% in 2019.
- Although inflation is affected by labor and material costs, a large part of the change in inflation is due to change in contractors/suppliers margins.
- When construction volume increases rapidly, margins increase rapidly.
- Construction inflation can be very different from one major sector to the other and can vary from one market to another. It can even vary considerably from one material to another.
Click Here for Link to a Table of 25 Index Values

Construction Spending 2016 – Midyear Nonresidential Markets
Construction Spending 2016 – Nonresidential Markets
9-8-16
Refer here to the Construction Spending 2016 Midyear Summary
Nonresidential Buildings
Nonresidential Buildings spending for July totaled a SAAR of $403 billion, down slightly from June but up 1.3% from the May dip. Spending YTD for nonresidential buildings through July is up 8.0% over 2015. The current 3-month average of $403 billion is up slightly from the 1st quarter but is still 9% below the peak in 2008.
How does actual spending YTD compare to my early 2016 forecast?
Nonresidential Bldgs predicted YTD $236.9b, actual YTD $228.1b (-$8.8bil, -3.7%).
Nonresidential Buildings spending for 2016 predicted in Dec 2015 $439.2b. Now with YTD data through July forecast spending for 2016 is $410.9b (-$28.3bil, -6.4%).
Total Nonresidential Buildings construction spending increased 9.7% in 2014 and 13.8% in 2015 and will grow 8.5% in 2016 and 6.3% in 2017.

Nonresidential Buildings Spending History
- 5 years 2004-2008 up 64%
- 3 years 2006-2008 up 45%
- 3 years 2009-2011 down 36%
- 2 years 2014-2015 up 25%
Manufacturing construction spending YTD is down 2.6% from 2015. However, that is because 2015 manufacturing construction spending reached all-time highs after record new starts in 2014, some of which will extend spending into 2017. 2016 is on track to reach the second highest year of spending on record, only slightly below 2015. Although new starts YTD in 2016 are down 75% from 2015, that will have most affect next year. A very large volume of starts in mid-2014 and early 2015 will generate spending extending into the 2nd half of 2016and early 2017. Total manufacturing construction spending for 2016 will finish 2% below 2015. Due to declining new starts in 2015 and 2016, spending in 2017 will drop more than 10%, and yet still be the 3rd highest year on record. Manufacturing construction represents 19% of total nonresidential buildings spending.

Office construction spending YTD is up 22% from 2015. Although new starts are currently down slightly from last year, starts are expected to grow 4% for 2016. Office starts have been strong since 2013. Vacancy rates peaked in 2010 and demand for office space has been increasing. A large component of office construction is data centers. Although we may see a few months of spending declines in late 2016, the large volumes of spending generated by several years of strong starts will keep total spending high. Office construction spending increased 23% in 2014 and 19% in 2015 and it will grow 23% in 2016 and 15% in 2017. Office construction represents 17% of total nonresidential buildings spending.
Commercial construction spending YTD is up 11% from 2015. Commercial new starts have been increasing slowly for the last 4 years. Spending will remain nearly flat for the next several months and is forecast to grow very slowly through mid-2017, then taper off slightly. Commercial construction had its biggest years in 2012-2013-2014 with growth of 11%, 12% and 18%. Total commercial construction spending for 2016 will finish 9% higher than 2015 and 2017 will grow 3% to 4%. Commercial construction represents 18% of total nonresidential buildings spending.
Lodging construction spending YTD is 29% higher than 2015. Lodging construction spending has exceeded the growth rate of all other markets. Starting in 2012 annual spending increased 19%, 25%, 24% and 30%. However, during that time lodging averaged only 5% of total nonresidential buildings spending. It now represents just under 7%. Total lodging construction spending forecast growth for 2016 is 25%. For 2017 expect spending growth of only 8%.

Educational construction spending YTD is up 4.8% from 2015. Educational buildings spending experienced the longest downturn of any market, declining for 5 consecutive years from 2009 through 2013. It has been slow to recover with 2015 showing the first real growth of only 4.8%. 2014 marked the beginning of the turn but registered growth of less than 1%. New starts posted 15% growth in 2014 and then slowed to only 4% growth in 2015. However, a large volume of those starts occurred in late 2014 and then again in early 2015. The timing of these starts generates a lot of spending in late 2016. I expect spending in the 2nd half 2016 to grow 5% over the 1st half. Total educational construction spending for 2016 will finish 8% higher than 2015 and 2017 will grow 9%. Educational construction spending is the largest component of nonresidential buildings representing 22% of total nonresidential buildings spending. Before the 5 years of declines it represented 30% of nonresidential buildings spending.
Healthcare construction spending YTD is up only 2.3% from 2015. Healthcare new starts since 2011 increased only in 2014. Spending may see some moderate declines in late 2016 before resuming slow growth in 2017. Changes and uncertainty in the healthcare climate are having a dampening effect on spending growth. Total healthcare construction spending for 2016 will finish only 2% higher than 2015 and 2017 will grow 3% to 4%. Healthcare construction represents 10% of total nonresidential buildings spending.
Amusement/Recreation construction spending YTD is up 10.1% from 2015. New starts were very strong in 2013 and 2014 and generated strong spending increases of 10% and 18% in 2014 and 2015. However, starts in 2015 declined slightly and 2016 starts to date have been flat. Spending through 2016 will remain strong but we will experience moderate declines in the 1st half of 2017. Total Amusement/Recreation construction spending for 2016 will finish 12% higher than 2015 but 2017 will grow only 2%. Amusement/Recreation construction represents 5% of total nonresidential buildings spending.

Non-building Infrastructure
Non-building Infrastructure spending for July fell to a SAAR of $289 billion, down slightly over for the last four months. YTD spending through July is up only 1.3% over 2015. Spending began to slow in April and May and is now at the 2016 low. The current 3-month average is down 4% from the 1st quarter. However, spending on non-building infrastructure reached an all-time high in the first half of 2014 and has remained near those highs through 2015 into the 1st quarter of 2016.
How does actual spending YTD compare to my early 2016 forecast?
Non-building Infrastr predicted YTD $156.2b, actual YTD $160.5b (+$4.3bil, +2.8%).
Non-building Infrastrusture spending for 2016 predicted in Dec 2015 $293.2b. As of July data forecast spending for 2016 is $297.3b (+$4.1bil, +1.4%).
Total Non-building Infrastructure construction spending increased 8.8% in 2014 but decreased 1.5% in 2015. It will grow only 1.2% in 2016 but then 9.6% in 2017.
Non-building Infrastructure Spending History
- 7 years 1995-2001 up 56%
- 4 years 2005-2008 up 60%
- 3 years 2009-2011 down 8%
- 3 years 2012-2014 up 19%
Power construction spending YTD is up 6.0% from 2015. Power new starts are erratic. Also some power projects are very long duration from start to finish. In 2012 starts totaled over $50 bil., in 2013 only $30 bil. and in 2014 less than $25 bil. In 2015 starts reached an all-time high of $56 bil. The power construction spending pattern for 2012-2015 was +30%, -4%, +18%, -16%. Many of the starts in 2012 supported 18% spending growth in 2014, yet not much of the record year of starts in 2015 supported spending in 2015. Although new starts in 2016 are forecast to drop by 30%, that’s still over $40 bil. and more than in 2013 or 2014. Part of the reason for a drop in spending in 2016 is the tailing off of projects that started in previous years combined with the fact that 2013 and 2014 were “lean” years. Cash flow of starts determines spending and it follows the erratic flow of starts. A very high volume of starts in early 2015 will generate spending extending out through 2019. I’m forecasting total power construction spending for 2016 will finish only 1.2% higher than 2015 and 2017 will increase 7%. Power construction represents 32% of total non-building infrastructure spending.
Highway/Bridge/Street construction spending YTD is up only 2.5% from 2015. Some highway and street projects are long duration from start to finish. Although new starts in 2015 increased by 11%, that was significantly unbalanced with two very high months of new starts in the 1st quarter and below average starts for almost the entire 2nd half of 2015 and the 1st half of 2016. The very high months have starts with much longer duration so do not add significantly to monthly spending, they spread the spending over a longer period of time. Spending has declined in 8 out of the last 12 months. I’m expecting declines in 6 out of the next 12 months. Yet the plus months will still carry both 2016 and 2017 to spending growth. I’m forecasting total highway/bridge/street construction spending for 2016 will finish 4.5% higher than 2015 and 2017 will increase 8%. Highway/Bridge/Street construction represents 32% of total non-building infrastructure spending.
Transportation/Air/Rail construction spending YTD is down 2.4% from 2015. YTD spending is 9% lower than what I had predicted in my early 2016 forecast. There is a disconnect between where Dodge reports transportation starts and how U S Census reports transportation spending, so it is difficult to directly relate the two. I’m forecasting total transportation construction spending for 2016 will finish 2.5% higher than 2015 and 2017 will increase 6%. Transportation construction represents 16% of total non-building infrastructure spending.


Construction Spending 2016 – Midyear Summary
Summary 2016 Construction Spending
9-7-16
Total Construction Spending for July reached a seasonally adjusted annual rate (SAAR) of $1.15 trillion, level with June which was revised upwards by $20 billion or nearly +1.8%. Monthly spending always gets revised in subsequent months. This year every month but May, which remained nearly unchanged, has been revised upwards, by an average of +1.4% and as much as 3.4%. Monthly values are subject to revision for two months after the first release and once again in May of the following year.
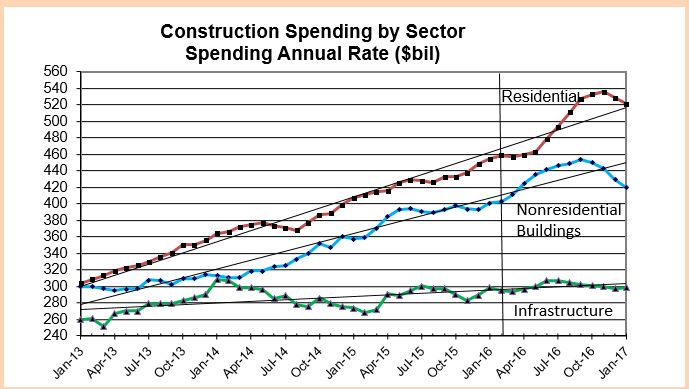
This plot, Construction Spending vs New Starts Cash Flows, shows actual spending (SAAR) by sector through July 2016 and projected trends of spending out to July 2017.

Previously I wrote that we should expect a short duration downturn in spending occurring between January and March. The expected monthly spending cash flows that would be generated from uneven new starts over the last two years indicated that a slowdown in spending would occur during the first quarter 2016. As it turns out, first quarter spending was much stronger than expected, averaging $1.17 trillion SAAR, primarily due to outstanding results in February and March for residential spending. But then April and May experienced significant declines, dropping to an average of only $1.14 trillion SAAR, down almost 3% from Q1. Now with June and July spending both up 1% from the April and May lows, it looks like we may be past that short duration downturn.
Total Construction Spending year-to-date (YTD) through July is up 5.6% over the same seven months 2015. Spending slowed in April and May from a 1st quarter average of $1.17 trillion that reached close to a 10 year high and falls just 4% short of the all-time high. However, it must be noted, that compares unadjusted current dollars, values of all dollars current in the year spent.
When comparing inflation adjusted constant dollars, all dollars adjusted to the same point in time, we can see 2016 spending is still 18% below the 2006 highs.

Total spending YTD through July is slightly ahead of what I predicted back in December, but it’s slightly below what I expected for May, June and July . I expect 2nd half spending to average above $1.2 trillion SAAR, but slightly lower than I originally forecast.
I’ve revised my 2016 spending forecast down slightly to total $1.190 trillion, up 7% from $1.112 trillion in 2015.
How does actual spending YTD compare to my prediction at the beginning of the year?
- Total predicted YTD through July $638.2b, actual YTD $647.7b (+$9.5bil, +1.5%).
- Residential predicted YTD $245.1b, actual YTD $259.2b (+$14.1bil, +5.8%).
- Nonresidential Bldgs predicted YTD $236.9b, actual YTD $228.1b (-$8.8bil, -3.7%).
- Non-building Infrastr predicted YTD $156.2b, actual YTD $160.5b (+$4.3bil, +2.8%).
Where are the revisions?
The single largest reduction in spending is in Nonresidential Buildings Manufacturing. Although there are other variances, that could account for the entire revision downward. Predicted construction starts for Manufacturing was lowered by nearly 35% after the initial start-of-year forecast was made.
Non-building Infrastructure spending increase is being supported by a 20%+ increase in power, which I didn’t expect. New starts for power projects have increased more than 20% since the initial forecast.
Residential construction had unusually large gains in February and March, almost all of that in residential renovations, offset only partially in April through July by declines mostly in new single-family housing.
Here’s my revised 2016 spending forecast based on YTD spending and new construction starts through July, compared to my prediction in December 2015.
- Total predicted Dec 2015 $1,206.2b, July 2016 $1,189.9b (-$16.3bil, -1.4%).
- Residential predicted Dec 2015 $473.8b, July 2016 $481.8b (+$8.0bil, +1.7%).
- Nonresdntl Bldgs predicted Dec 2015 $439.2b, July 2016 $410.9b (-$28.3bil, -6.4%).
- Non-bldg Infrastr predicted Dec 2015 $293.2b, July 2016 $297.3b (+$4.1bil, +1.4%).
Spending and construction starts are often confused by some analysts who refer to starts data as spending. Starts represent total project value recorded in the month the project begins. To determine spending activity, starts values must be spread out over the duration of the projects. Spending is dependent on cash flows each month generated from all previous construction starts. Cash flows expected based on Dodge Data construction starts are indicating a return to growth in spending in the 2nd half 2016. (See chart above Index Actual Construction Spending vs New Starts Cashflows).

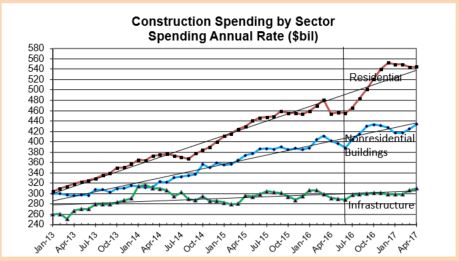
Spending Breakout by Sector
Residential construction spending for July totaled a SAAR of $452 billion, remaining near level for the last four months. Residential spending YTD through July is up 6.5% over 2015. Spending slowed in April and May from a very strong 1st quarter average that reached close to a 10 year high. The current 3-month average is just 1% below the 1st quarter and is still at its highest since the 2nd half of 2007 but is 10% below the current dollar all-time high in 2006. I’m still expecting some upward revisions to June or July residential spending.
Residential spending just experienced the strongest three-year stretch of spending growth on record, up 60% in 2013-2014-2015. After taking out inflation, volume growth was only 31%, but that is still the strongest ever for three consecutive years. Spending growth in 2016 will reach only +9%. After adjusting for inflation that represents volume growth of less than +4%, the slowest in 5 years. New starts YTD (as reported by Dodge Data) although down from the 1st quarter, are still near post-recession highs. Starts from late 2015 and early 2016 will still be generating spending into early 2017. 2017 will repeat nearly identical to 2016. What we may be seeing is that it might be difficult to register another year of very high percentage growth in 2016 or 2017 because it is being measured against the 2015 10-year high. Another factor limiting very high growth may be a limited supply of labor to expand the workforce.
Total Nonresidential SAAR spending for July is $701 billion, down slightly from June, but monthly SAAR has varied only +/- 1% for the last six months. YTD spending compared to 2015 is up 5.1%. Nonresidential spending also slowed in April and May but is now up 1.5% from those lows. The current 3-month average is up slightly from the 1st quarter and is just 3% below the pre-recession 2008 current dollar high.
Nonresidential Buildings spending for July totaled a SAAR of $403 billion, down slightly from June but up 1.3% from the May dip. Spending YTD for nonresidential buildings through July is up 8.0% over 2015. The current 3-month average of $403 billion is up slightly from the 1st quarter but is still 9% below the peak in 2008.
Non-building Infrastructure spending for July fell to a SAAR of $289 billion, down only slightly over for the last four months. YTD spending through July is up only 1.3% over 2015. Spending began to slow in April and May and is now at the 2016 low. The current 3-month average is down 4% from the 1st quarter. However, spending on nonbuilding infrastructure reached an all-time high in the first half of 2014 and has remained near those highs through 2015 into the 1st quarter of 2016.
9-7-16
Public spending average for the 1st six months of 2016 is the highest since 2010 and is up 10% from the 2014 low point. YTD public spending is up 0.2% from 2015. All of Highway plus 80% of Educational makes up 55% of all public construction spending. The next largest markets, all of Sewage/Wastewater plus 70% of Transportation accounts for only 19% of public sending. All other markets combined make up less than 20%.
The biggest mover to total public spending this year is educational spending. Public educational spending is up only 4.0% YTD, but because it represents almost 25% of all public spending, it’s has a bigger net impact of +1.0% on moving the trend up than any other single public market. Public commercial spending is up 36.6% YTD but has only a 1% market share of public work. Highway and street is up 2.6% YTD. At 30% of total public that results in a net move of +0.8%. Office, public safety, power, sewage/waste disposal and water supply are all down YTD by a combined -5.3%. At a combined market share of 21% that nets a -1.1% reduction in YTD public spending.
Private spending is dominated by a 52% market share of residential work. At 6.6% growth that nets 3.4% growth in private spending. Several of the nonresidential building markets have high YTD growth (and/or a large market share of private work); lodging +30%, office +27%, Amusement +22%, commercial +10% and power +8%. These five markets combined represent 29% of private spending and combined are up +15% YTD for a net impact of +4.4% to private work.
For a base of reference, here’s a few points in spending history.
Total Construction Spending
- 8 years 1998-2005 up 77%
- 3 years 2003-2005 up 32%
- 3 years 2008-2010 down 30%
- 4 years 2012-2015 up 41%
Residential
- 8 years 1998-2005 up 133%
- 3 years 2003-2005 up 57%
- 3 years 2007-2009 down 60%
- 3 years 2013-2015 up 60%
Nonresidential Buildings
- 5 years 2004-2008 up 64%
- 3 years 2006-2008 up 45%
- 3 years 2009-2011 down 36%
- 2 years 2014-2015 up 25%
Non-building Infrastructure
- 7 years 1995-2001 up 56%
- 4 years 2005-2008 up 60%
- 3 years 2009-2011 down 8%
- 3 years 2012-2014 up 19%
See this post for expanded details on Construction Spending – Nonresidential Markets – Buildings and Infrastructure
See this post for expanded details on Construction Inflation

June 2016 Year-To-Date Construction Spending
update 8-6-16 See this link to July Jobs Report
Construction spending for June reported by U.S. Census totaled $1.134 trillion, the lowest since $1.126 trillion in December 2015. Spending hit the lowest for 2016 after reaching a 9 1/2 year high of $1.176 trillion in March.
Spending for June is down 0.6% month/month from a revised May. May and April were both revised down. Construction spending year-to-date is now only +6.2% vs. the same six months 2015. It was above +8% year-to-date for the last three months.
Construction spending reached a 9 1/2 year high in March. The biggest declines in spending since March are Residential -5%, Healthcare -4%, Educational -6%, Highway & Street -6%, Sewage & Waste Disposal -12% and Manufacturing -8%. The only significant increases since March are Lodging +3.4%, Power +2.5% and Conservation +6%. Power is the only big $ volume sector.
The Census spending numbers for both May and June seem somewhat suspect as they fall well outside the statistical mean for expected percentage of total annual spending within those months. June reported residential spending is 6% below statistical mean for June, larger than any variance in 15 years, therefore it becomes suspect. Granted this is based on only six months of actual spending with six months still to go. However the residential variance is so significant, following that trend would reduce residential spending for the remainder of the year by $30 billion, or more than 10% of the final six months. This is an unlikely scenario, unless it were to signify the beginning of a steep downturn starting in March and continuing for the remainder of 2016. Construction starts dollar volume does not support that scenario. Therefore, I have not adjusted down my predicted spending for the remainder of the year based on the downtrend for April, May and June as-reported actual spending. Although it is an uncomfortable position to take, I expect to see some upward revisions in the coming months.
Spending is dependent on long duration cash flows from all previous construction starts. Construction Starts as reported by Dodge Data & Analytics provide a base to predict spending. Dodge reports starts in dollars. Starts gives a long term trend view of spending.
Previously I said we should expect a short duration downturn in spending occurring from January through March. The monthly unevenness in the dollar volume of new starts over the last two years indicated a slowdown in spending during the first quarter 2016. As it turns out, first quarter spending was much stronger than expected, averaging $1,175 billion which is a 9 1/2 year high. Spending has been declining since the March peak, averaging only $1,140 for Q2, down 3% from Q1, but still near a nine year high.
It will take several more months to see if spending rebounds and to see if that helps identify this April-May-June downturn as the dip I expected in Q1, but just had targeted it off by several months for when the dip would occur.
If May or June get revised up and/or the 2nd half rebounds to confirm the slight dip, spending will come right back to the long term trend.
Total first half spending is only 1% below what I predicted. If a 2nd half spending rebound materializes, we should still finish 2016 near $1.200 trillion in total spending, up 8% from 2015.
This article by Luke Kawa @LJKawa on BloombergMarkets @markets which quotes me also includes comments from Bespoke’s @GeorgePearkes on the disparity between the trend in spending and Census residential # of units under construction. The graphic comparison shows spending vs # units diverging for May-June, units advancing and spending declining. This is another clue this may get revised in future data.
Something Is Odd About the Latest U.S. Construction Data
7-6-17 The most recent release of Census Construction Spending data issued July 3, 2017, revises data back to January 2015. The May and June 2016 data discussed in the Aug. 2, 2016 article linked above were both revised up 3%. This upward revision to the data puts it right in line with growth expected back in August 2016, confirming our questioning the data as suspect at that time.

June Jobs Report Construction
June Jobs Report (May 15-Jun 18) released July 8
There have been no job gains in construction for the last 3 months. In fact we’ve lost 22,000 jobs since March and have only 46,000 new jobs year-to-date. I have to admit after the Apr and May losses, I expected a sizable jobs gain in June. However, for quite a while I’ve predicted spending would decline in Q1 and since a peak in Mar it’s been going down for 2 months. Lower spending would correlate to lower jobs.
Construction jobs are up 3.9% over the same period 2015, so a temporary slowdown should not have much effect. We have just gone through the best 3 years of construction jobs growth since 2004-2006. Perhaps we may experience a leveling out between spending and jobs. At any rate, I see construction spending increasing. There’s still a lot of spending growth in current backlog from starts, so I expect further increases in jobs.
The available unemployed pool dropped to the lowest in 16 years. That could also have some correlation with slow or no jobs growth, as it may mean the people to hire are not available.
Availability already seems to be having an effect on wages. Construction wages are up 2.6% year/year, but are up 1.2% in the last quarter, so the rate of wage growth has recently accelerated. The most recent JOLTS report shows we’ve been near 200,000 job openings for months. That with this latest jobs report could indicate labor cost will continue to rise rapidly.
As wages accelerate, also important is work scheduling capacity which is affected by the number of workers on hand to get the job done. Inability to secure sufficient workforce could impact project duration and cost and adds to risk, all inflationary. That could potentially impose a limit on spending growth. It will definitely have an upward effect on construction inflation this year.
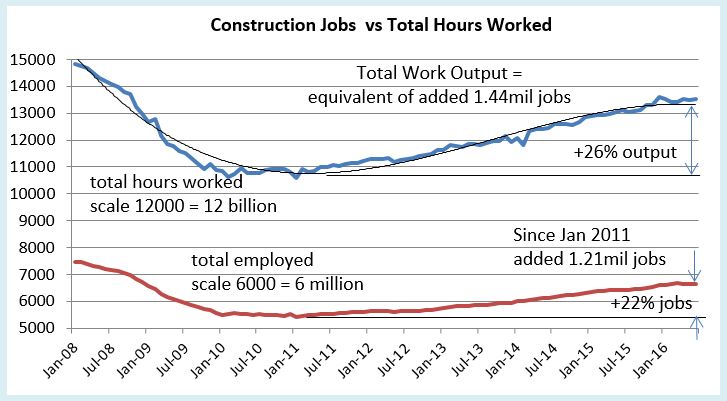
Construction worker output Q2 2016 (# workers x hours worked) is up 3.7% over the same quarter last year, but up only 0.6% from Q1 2016.
Spending minus inflation (volume) has been growing faster than workforce output for the last few years. Since Jan 2011, volume has increased 20% and workforce output increased 26%, a net productivity loss, but since Jan 2014 volume increased by 16% and workforce output increased by only 12.5%. Total hours worked compared to total spending shows productivity has been increasing for the last two years. It would be unusual to see productivity growth continue for another year. This leads me to think if spending plays out as expected then construction jobs will grow by about 200,000 in 2016. Availability could have a significant impact on this needed growth.

May 2016 Construction Spending YTD vs Predicted
7-7-16
Construction Spending year-to-date (YTD) through May versus the same 5 months 2015 is: Residential +9.8%; Nonresidential Buildings +9.3%; Non-building Infrastructure +3.9%. Total construction spending YTD is up 8.2% from the same period 2015.

How does this compare to my prediction at the beginning of the year?
At $176.6 billion YTD, residential spending is 5.1% higher than predicted (+$8.6bil). Nonresidential buildings spending at $154.9 billion YTD is 2.5% below (-$4bil) expected and non-building infrastructure at $107 billion YTD is 2.4% higher (+$2.5bil) than expected. Total construction spending is 1.8% (+$7.1bil) higher than I expected through May.
Six months ago I predicted a dip in construction spending would occur early in 2016 with different sectors hitting a low point in February or March. Prediction analytics are much better at identifying a trend rather than the exact month it may occur. In this case, both February and March had strong spending increases. It looks like we may see the dips now with declines in both April and May. That makes the June data more important.
Where are the gains and losses?
By a large margin, two thirds of the unexpected gains in Feb-Mar were in residential construction, almost all of that in residential renovations. Likewise, most of the dip in Apr-May is caused by a decline in residential work, but the declines came mostly in new single-family housing spending.
Nonresidential Buildings spending YTD combined for Lodging, Office, Commercial, Educational and Amusement is up 14%. This group just more than 2/3rds of all nonresidential buildings. Manufacturing, another 20% of total nonresidential buildings, is down YTD less than 1%.
Non-building Infrastructure spending is being supported by 7% YTD increases in power, which I didn’t expect, and highway/street. Together they represent 60% of all infrastructure work.
Market Sectors vs Predicted
Year-to-date gains and losses versus my beginning of year predicted include: Manufacturing is -7% (-$2.6bil) lower than predicted; Office +1% higher; Commercial/Retail +3.5% (+$1bil); Lodging +1%; Educational +0.7%; Healthcare -0.5%; Amusement/Recreation -2.1%; Power +18% (+$5.9bil); Highway Street -5.7% (-$1.7bil); Transportation -4.4%; Residential +5% (+$8.6bil).
My prediction still indicates that we are headed for strong growth, total spending up +9% to +10% for 2016. I expect both residential and nonresidential buildings to increase slightly from current trend and non-building infrastructure to slow.
Census Construction Spending with this May 2016 data is revised back to January 2014. Revisions are: 2014 +1.2%; 2015 +1.3%; Jan-Apr2016 +1.7%. This is the first issue of May 2016 data. May data will be revised twice in coming months.
Construction Spending April Data
6-1-2016
Total Construction Spending year-to-date is up 8.7% over Jan-Apr 2015. Spending declined in April 1.8% below March. Every major sector declined from a March value that was revised upward by +1.6% to the highest monthly spending since 2007.
Often the month to month change does not reflect the long term trend. For example, for February and March combined spending was up 3%, a trend if carried out for the full year would indicate annual growth of 18%, a level never achieved. So a decline in April is not too unusual. Including April, three of the last five months were up. The 3 month avg is up 1.8% from the previous 3 months, at its highest since mid 2007 when spending was still near the 2006 peak.
Residential spending for April is down 1.5% by Census SAAR, but that is after a strong March. Year-to-date Jan-Apr compared to 2015 is up 9.1%. The current 3 month average is at its highest since the 2nd half of 2007 and is up 3.5% over the previous 3 months.
Total Nonresidential spending for April is down 2.1% from March by Census SAAR, but that is after a March that came in just 2% below peak pre-recession spending measured in the 1st quarter of 2008. Year-to-date Jan-Apr compared to 2015 is up 8.5%. The current 3 month average is at its highest since the Q1 2009, which was still near the pre-recession peak, and is up 2.8% over the previous 3 months.
Nonresidential Buildings spending year-to-date is up 9.8% over 2015. The current 3 month average is at its highest since Mar-Apr-May 2009 and is up 3.5% over the previous 3 months. Spending on Nonres Bldgs peaked in 2008 and remained near that peak until March 2009. We are on track to regain peak spending by Q3 this year.
- Commercial and Office construction spending are both 5% ahead of year-to-date predicted. If both finish the remaining months of 2016 as predicted, then expect 2016 growth of +9% and +16%.
- Lodging construction spending 5% ahead of year-to-date predicted. If finishes as predicted, expect 2016 +25%.
- Manufacturing construction spending 5% below year-to-date predicted. If finishes as predicted, expect 2016 only +3%.
- Power construction spending 10% above year-to-date predicted. If finishes as predicted, expect 2016 down only -3%.
Nonbuilding Infrastructure spending year-to-date is up 6.5% over 2015. The current 3 month average is up only 1.4% over the previous 3 months. However, spending on nonbuilding infrastructure has been tracking near all-time highs for most of 2014 and 2015. It peaked in early 2014 and again in mid 2015. We may exceed both those peaks in the next 4 months.
Construction Starts lead spending. Starts data is from Dodge Data & Analytics. Early 2015 had elevated levels of new starts in every sector. Although the level of starts has declined since then, the long term trend is still up, so that means the rate of increase in spending may slow, but not decline. I see no indication at this time to expect a decline in long term spending. I previously predicted spending would temporarily slow or drop in early 2016 and I think we have seen that. At this time, I still expect total spending in 2016 to exceed 10% growth. Strong data needed to verify 2016 total spending prediction will be available when we get June spending (August 1 release). At that time we will have a much better indication of what to expect for all of 2016.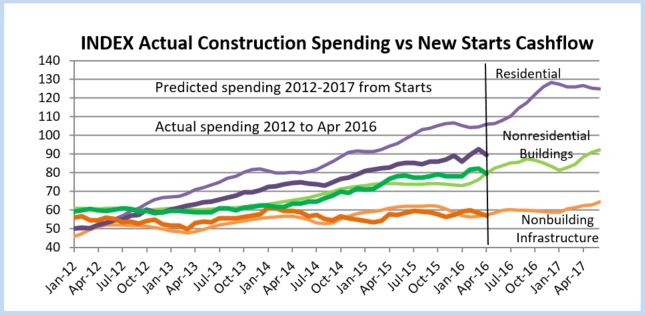
Construction Spending vs Dodge Starts vs New Housing Unit Starts
Read my last few blogs and all of this is detailed, but this is worth a look.
Dodge Data Construction Starts cash flowed shows a predicted spending pattern.
Actual spending is shown to compare to the prediction.
For another residential input we have new housing starts. Here I’ve spread activity out from start to completion like a cash flow to get monthly activity. History compares to actual spending and future compares to Dodge New Starts cash flow.
The time flow of activity generated by housing starts is much more important than the monthly starts themselves. It prompts us to look at a much longer term trend of housing starts than just whether they have moved up of down in the last month or quarter.
Modeling for nonresidential buildings and non-building infrastructure appears more accurate than residential. It looks like my prediction of cash flow from Dodge residential starts needs to move 2-4 months to the left.
5-4-16 The cash flow plot for residential has been revised to use a different duration for SF vs MF vs Reno.


Construction Expectations 2016
4-6-16
What should we expect in 2016 for construction spending, jobs and cost?
Nonresidential buildings starts (as reported by Dodge Data & Analytics) were well above average from March 2014 through May 2015 but since then have been below average. It takes about 24 to 30 months for nonresidential building starts to reach completion. The effect of below average starts will kick in at the end of this year after strong spending growth.
Non-building infrastructure starts jumped 50% above average from November 2014 to peak in February 2015, then settled back to average in July of 2015. Those very strong starts in early 2015 will be spread out over 4 to 6 years so will not cause spending to spike. They will help support a slow steady increase in spending over the next two years.
Residential starts averaged near 20%/yr growth for 3 years but dropped below average for the entire 2nd half of 2015. That late 2015 dip in starts may not slow residential spending too much until the end of 2016. Overall, the data shows another repeat year of growth similar to the last three years.
2015 Construction spending finished the year up 10.6% over 2014. After 3 years of growth averaging 9%/year, 2016 total construction spending could climb 11% above 2015, the largest percent gain in over 10 years. Any construction spending slowdown is temporary, baked in from old uneven starts causing uneven cashflow, soon to be ending. By the 2nd quarter 2017 all sectors return to positive growth for strong spending in 2017.
Nonresidential buildings construction spending went from zero growth in 2013 to 9% in 2014 and took off to hit 17% growth in 2015. Nonres bldgs spending could reach 12% growth in 2016 and 7% in 2017.
Infrastructure spending will increase a little in 2016 but we won’t see a sizable increase of 8% until 2017.
Residential spending averaged over 15%/year for the last 3 years and could go over 15% growth in 2016, combining for the best four years of spending growth since 2002-2005.
Don’t be mislead by news that construction spending is close to reaching the previous highs. That may be true of spending, but spending is not the measure of expansion in the construction industry. The measure of expansion is volume, spending minus inflation.
Construction spending is up nearly 40% off the 2011 lows and within 5% of the 2006 highs. But after adjusting for inflation, volume is up only 22% from the 2011 lows and is still 17% below 2005 peak volume. We still have a long way to go. While spending is predicted to reach over 11% growth in 2016 and may do the same in 2017, volume will increase only 5% to 6% each year. The rest is due to inflation.

March 2016 construction jobs increase 37,000 from February and although up and down, have averaged 37,000 jobs per month for the last 6 months. That is the highest 6 month average growth rate in 10 years. That certainly doesn’t make it seem like there is a labor shortage. However, it is important to note, the jobs opening rate (JOLTS) is the highest it’s been in many years and that is a signal of difficulty in filling open positions.
To support the expected 2016 volume growth we need an average 25,000 new jobs per month in 2016, 300,000 new jobs, reaching a three-year gain of nearly 1 million jobs for the period 2014-2016, the highest three-year total jobs growth since 1997-1999. The labor force hasn’t expanded this fast in over 16 years. That can have some undesirable consequences. Rapid jobs growth may result in accelerating wages and lost productivity, compounding the cost to labor.
4-6-16
If we get a construction jobs slowdown in the next few months, it’s not all due to labor shortages and not being able to find people. Construction volume has been growing faster than jobs for more than a year. It means productivity in 2015 is up after several down years. But, while we’ve recorded consecutive years of productivity declines many times, we have not had two consecutive years of productivity gains in the last 22 years. So historically we should expect a decline, not gains this year.
Material input costs to construction are down over the last year, but that accounts for only a portion of the final cost of constructed buildings. The cost of new residential construction is up 5% to 6% in the last year. Several nonresidential building cost indexes are indicating construction inflation between 4% and 5%. The Turner non-residential bldg cost index for 2015 is 4.6%. The 1st qtr 2016 is up 1.15% from the 4th quarter 2015. The Rider Levitt Bucknall nonresidential building 2015 cost index is 4.8% and the Beck Cost Report has 5.0% for 2015. I recommend an average 5.5% cost inflation in 2016 for residential and nonresidential buildings. Non-building infrastructure costs are unique to each individual infrastructure market, so average building cost indices should not be used for infrastructure.
What Drives Construction Spending?
3-23-16
New construction starts drive construction spending. For all the discussion regarding the monthly rise and fall of spending, most of the spending in any given month is already predetermined since two thirds of all construction spending in the next 12 months comes from projects that were started prior to today. This is commonly referred to as backlog.
The pattern of spending does not follow the pattern of new starts which can fluctuate dramatically. It follows the pattern developed by the cashflow from all previous starts. Data for new construction starts is sourced from Dodge Data & Analytics. Cash flow is developed independently. Here’s a much simplified example of cashflow: a new $20 million project start is to be completed in 20 months, therefore we expect this project to generate $1 million of spending every month for the next 20 months.
This plot is an Index, so the ratios of starts and actual spending show the relative volume of each of these three major sectors as compared to each other.

Nonresidential buildings new construction starts were elevated for 16 out of the last 24 months. Starts were strong from February through July of 2015. A slowdown occurred in the second half of 2015 but the last four months have been gaining slowly. It looks like the backlog of elevated starts will keep spending rising at least until the end of 2016 before we see a slight dip in spending.
75% of all nonresidential building spending in 2016 comes from projects that were started between early 2014 and the end of 2015. Each month, new starts generate only 4%-5% of monthly spending. As we start the new year, backlog accounts for 95% of January spending. We know a lot about spending within the next few months, but what we have in backlog for December at the beginning of the year from previous starts accounts for only 50% of December activity. We will add about 4-5% more to December backlog from new starts each month this year.
Five out of six times in the last 18 months that nonbuilding infrastructure new construction starts jumped 25% to 50% above the running average it was due to massive new starts in the power sector. Some of these projects are worth several billions of dollars. While this causes new starts to fluctuate wildly, these projects sometimes take four to five years from beginning to completion, so the cash flow is spread out over a very long period, therefore spending does not experience the same magnitude of monthly change as starts.
80% of all nonbuilding spending in 2016 comes from projects that started from mid-2013 through the end of 2015. New starts each month generate only about 3% of monthly spending.
The average of residential starts for the last three months is higher than any time since 2007 when residential starts were already on the decline by 24% from the previous year. The volume of residential starts predicts that spending should be higher than it is currently. This could mean that some starts have been delayed. Or, it could be because residential starts have the shortest duration, they may be the most difficult to predict spending from starts.
55% of all residential building spending in 2016 comes from projects that started between late 2014 and the end of 2015. New starts each month generate almost 10% of monthly spending.
(6-5-16) RE: a discussion related to a decline in nonresidential permits suggests nonresidential spending will decline. Yes, but at what rate? Permits are directly related to new construction starts. Since every month of new starts has an impact of only 4-5% on nonres spending in every following month for the next 20-25 months, then a 10% drop in permits in a single month would cause only a 0.4% to 0.5% reduction in spending in each of the following 20-25 months. It would take a prolonged trend of declining permits and therefore declining new starts to really see a dramatic decline in spending, and then the greatest effect would be well out into the future.
