6-1-2016
Total Construction Spending year-to-date is up 8.7% over Jan-Apr 2015. Spending declined in April 1.8% below March. Every major sector declined from a March value that was revised upward by +1.6% to the highest monthly spending since 2007.
Often the month to month change does not reflect the long term trend. For example, for February and March combined spending was up 3%, a trend if carried out for the full year would indicate annual growth of 18%, a level never achieved. So a decline in April is not too unusual. Including April, three of the last five months were up. The 3 month avg is up 1.8% from the previous 3 months, at its highest since mid 2007 when spending was still near the 2006 peak.
Residential spending for April is down 1.5% by Census SAAR, but that is after a strong March. Year-to-date Jan-Apr compared to 2015 is up 9.1%. The current 3 month average is at its highest since the 2nd half of 2007 and is up 3.5% over the previous 3 months.
Total Nonresidential spending for April is down 2.1% from March by Census SAAR, but that is after a March that came in just 2% below peak pre-recession spending measured in the 1st quarter of 2008. Year-to-date Jan-Apr compared to 2015 is up 8.5%. The current 3 month average is at its highest since the Q1 2009, which was still near the pre-recession peak, and is up 2.8% over the previous 3 months.
Nonresidential Buildings spending year-to-date is up 9.8% over 2015. The current 3 month average is at its highest since Mar-Apr-May 2009 and is up 3.5% over the previous 3 months. Spending on Nonres Bldgs peaked in 2008 and remained near that peak until March 2009. We are on track to regain peak spending by Q3 this year.
- Commercial and Office construction spending are both 5% ahead of year-to-date predicted. If both finish the remaining months of 2016 as predicted, then expect 2016 growth of +9% and +16%.
- Lodging construction spending 5% ahead of year-to-date predicted. If finishes as predicted, expect 2016 +25%.
- Manufacturing construction spending 5% below year-to-date predicted. If finishes as predicted, expect 2016 only +3%.
- Power construction spending 10% above year-to-date predicted. If finishes as predicted, expect 2016 down only -3%.
Nonbuilding Infrastructure spending year-to-date is up 6.5% over 2015. The current 3 month average is up only 1.4% over the previous 3 months. However, spending on nonbuilding infrastructure has been tracking near all-time highs for most of 2014 and 2015. It peaked in early 2014 and again in mid 2015. We may exceed both those peaks in the next 4 months.
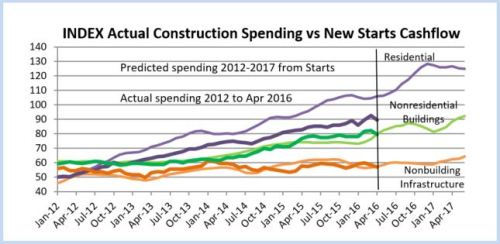
Construction Starts lead spending. Starts data is from Dodge Data & Analytics. Early 2015 had elevated levels of new starts in every sector. Although the level of starts has declined since then, the long term trend is still up, so that means the rate of increase in spending may slow, but not decline. I see no indication at this time to expect a decline in long term spending. I previously predicted spending would temporarily slow or drop in early 2016 and I think we have seen that. At this time, I still expect total spending in 2016 to exceed 10% growth. Strong data needed to verify 2016 total spending prediction will be available when we get June spending (August 1 release). At that time we will have a much better indication of what to expect for all of 2016.