Home » Forecast (Page 13)
Category Archives: Forecast
ABI – DMI – Starts – Construction Spending
2-22-17
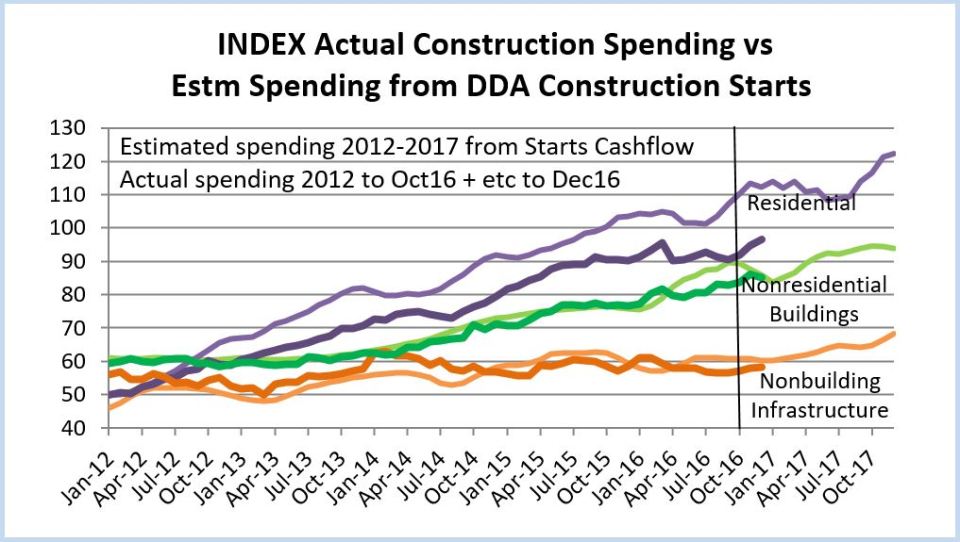
The attached plot shows actual and predicted construction spending compared to several industry leading indicators. The ABI, produced by the American Institute of Architects (AIA) shows work on the boards at architectural firms. Values above 50 indicate work increasing, values below 50 = work decreasing. The DMI is a survey from Dodge that gives an indication of new construction momentum. Starts is the total cash flow growth from all nonresidential starts currently in backlog.
Both the ABI and the DMI have long lead times. For example, the ABI value posted by AIA today is an indication of what to expect 9 months from now. I’ve plotted the values for ABI and DMI out at the lead time dates (# of months) in the future so they would correspond to future cash flows from all starts and predicted spending. The Starts, DMI and Spending values on this plot are indexed so they could be plotted with the ABI while keeping growth trends in each index true.
- ABI – Architectural Billings Index
- DMI – Dodge Momentum Index
- Starts – Aggregate Cashflows of Dodge Starts
- Spending – Actual and Predicted Construction Spending
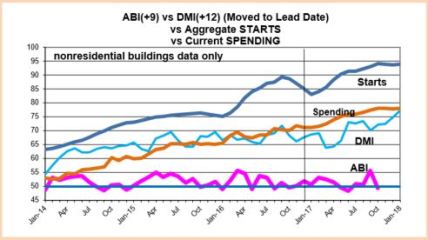
Overall Spending mostly correlates with Starts except that Starts showed a steeper growth rate in 2016 before a drop. Starts and Spending match well for all of 2014 and 2015. Both DMI and ABI are more erratic, however, the advances and declines in the ABI do correspond well with pickups and slowdowns in Spending. From mid-2015 through the end of 2016, the DMI was in a narrow range and that could possibly be said to be in synch with a slowed period of Spending.
Although they don’t match exactly by month, the ABI, DMI and Starts all show a drop sometime between 4th qtr 2016 and 2nd qtr 2017. That appears in Spending as a slight dip in 1st qtr 2017. The ABI gives an indication of a nice increase midyear. Both DMI and Starts are indicating substantial growth in spending by year end 2017.
Summary of 2017 Construction Outlook
2-21-17 This Summary is a collection of briefs pulled from all the articles that make up the 2017 Construction Outlook
Follow this for Link to Articles in 2017 Construction Outlook
NEW STARTS
Total of all Dodge Data & Analytics new construction starts for 2016 finished as the highest year since 2005. After 2016 totals get adjusted up we might see 2016 growth of 4% to 5% over 2015.
- Residential starts in 2016 posted the best year since 2005-2006. New starts show an increase of only 6% for 2016, but that follows several years of growth averaging more than 20%/year. I expect after adjustments 2016 residential starts will be revised to 8% growth.
- Nonresidential Buildings starts for the last six months averaged the highest since the 1st half of 2008. I expect after adjustment nonresidential buildings will show a 2016 increase of about 8% to 9%.
- Infrastructure starts even though posting a substantial decline for 2016 came in at the second highest year on record. 2015 was up 27% from 2014. I expect after adjustments the 2016 decline will be revised up by 3 points to -8%.
BACKLOG
The types, values and duration of projects that make up the backlog help get a clear picture of spending activity over time, particularly in the coming year.
Nonresidential buildings 2017 starting backlog is 45% higher than at the start of 2014, the beginning of the current growth cycle. Spending from starting backlog has increased every year and in 2017 it will be up a total of 35% over 2014.
SPENDING
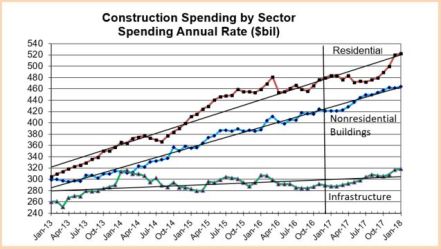
Total construction spending in 2017 will reach $1,236 billion, an increase of 6% over 2016, supported by a 4th consecutive year of strong growth in nonresidential buildings. The monthly rate of spending will range from near $1.2 trillion in January to $1.3 trillion at year-end.
- Nonresidential Buildings spending in 2017 will increase to $447 billion, 9.1% over 2016. Office spending will lead 2017 with 30%+ growth. Commercial, Lodging and Educational markets are all expected to post strong gains over 10%.
- Non-building Infrastructure, following two down years, will increase by 4.4% to $304 billion, due to growth in the highway and transportation markets.
- Residential will increase only moderately to $485 billion, adding 4.8% over 2016. That follows on three years of substantial growth averaging 17%/year.
- The entire construction industry best growth rate ever achieved (in constant 2016$) absorbed $1 trillion in new spending over 5 years. Infrastructure has not absorbed $1 trillion newly added work in 25 years.
- None of the starts or spending detailed above includes any projections of potential work from future stimulus.
PUBLIC CONSTRUCTION
The two largest components of Public Construction Spending, by far, are Highway/Bridge/Street and Educational Buildings. These two markets have more impact on the magnitude of public spending than any other markets.
Public Construction Spending average for the first six months of 2016 was the highest since 2010 and is up 10% from the Q4’13-Q1’14 low point.
Public spending finished 2016 down 0.8% from 2015, but that is down from a near six-year high, so spending is still strong. It is still 9% below its 2009 peak. Public spending in 2017 could increase more than 8%.
JOBS
For 2017, several economists (including myself) are predicting total construction spending will increase by just over 6%. However, I’m also predicting that combined construction inflation for all sectors will increase by 4.0% to 4.5%. That leaves us with a net volume growth of only 1.5% to 2.0%. Therefore, for 2017, we should not expect jobs to increase by more than 1.5% to 2.0%, or 100,000 to 140,000.
HOUSING
Housing Starts (# of units started as reported by U.S. Census) can be erratic from month to month and short term changes in growth can sometimes be misleading. Trends should be looked at over longer term periods. New monthly starts on a seasonally adjusted annual rate (SAAR) basis for the last eight months through January 2017 have now averaged over 1,200,000.
For the last four months housing starts have averaged an annual rate of 1,250,000, an increase of 8.5% over the range-bound average of 1,150,000 for the previous six quarters.
Housing starts for 2017 could surprise to the low side. Spending is predicted to grow 5%, but almost all of that is inflation. New starts could finish lower than the 65,000 in 2016.
MATERIALS
Most material prices have been muted over the last year, or even two years. Through the 3rd quarter 2016, material input prices had not registered a year over year gain for two years. In the last 4 months that has all changed. Steel, lumber and concrete are now all up in cost substantially over last year. Construction Input prices are up 4%. However, it is not material prices that have been driving inflation, which is up due to labor cost and market activity. Now material prices are also accelerating and that cold have a big impact on future inflation.
Final cost of materials averages perhaps 30% to 50% of building cost. The input cost of materials can contribute much less to overall project cost. For example a 10% cost increase in mill steel could add 0.4% to the total cost across all steel in a building. It could add 1% to the cost of a structural steel contract. A 10% increase in the cost of concrete, depending on if the building is a steel structure or a concrete structure, would add only 0.2% to 0.6% to the total cost of a building. A 10% increase in the cost of gypsum board would add less than 0.1% to the total cost of a building.
INFLATION
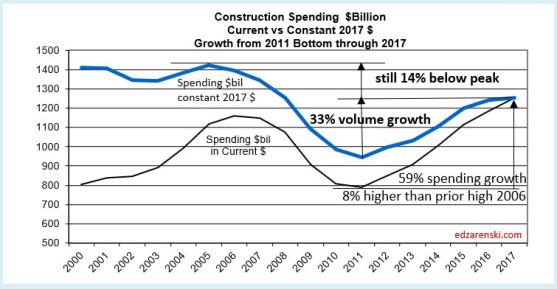
Constant $ adjusted for inflation converts all past spending into 2016$ for an equalized comparison. From the low point in 2011 we’ve increased spending by 48% but in constant 2016$ we’ve added only 29% in volume and we are still 16% below the 2005 peak. (updated plot 3-9-17)
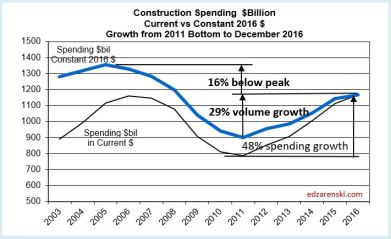
As measured in comparable constant dollars, No, we are not back to previous levels of construction spending. We will probably not return to previous highs before 2020.
- Long term construction cost inflation is normally about double consumer price inflation (CPI).
- Since 1993 but taking out 2 worst years of recession (-8% to -10% 2009-2010), the 20-year average inflation is 4.2%.
- Average long term (30 years) construction cost inflation is 3.5% even with any/all recession years included.
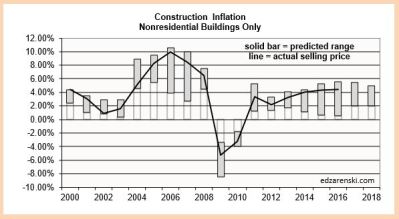
If you want to use a cost index to adjust project costs over time, you must understand what it measures. Selling Price, by definition, whole building actual final cost, tracks the final cost of construction, which includes, in addition to costs of labor and materials and sales/use taxes, general contractor and sub-contractor overhead and profit. Selling price indices should be used to adjust project costs over time.
Follow this link to 2017 Construction Outlook Compilation of Links to All Articles
2017 Construction Outlook Articles
Articles Detailing 2017 Construction Outlook
Links will open in a new tab
These links point to articles here on this blog that summarize end-of-year data for 2016 and organize in one place my projections for 2017.
Most Recently Published
Spending Summary Construction Forecast Fall 2017 12-3-17
Starts Trends Construction Forecast Fall 2017 11-8-17
Backlog Construction Forecast Fall 2017 11-10-17
Is Infrastructure Construction Spending Near All-Time Lows? 10-10-17
Construction Jobs / Workload Balance 11-2-17
Constant Dollar Construction Growth 11-2-17
Summary
Summary of 2017 Construction Outlook 2-21-17
1st Qtr Update 2017 Construction Spending Forecast 5-1-17
Construction Spending Midyear 2017 Summary 7-11-17
August Construction Spending 10-2-17
Spending Summary Construction Forecast Fall 2017 12-3-17
2016 Results
2016 Construction Spending 1-3-17
New Starts and 2017 Starting Backlog
New Construction Starts Totals for 2016 1-24-17
Starts Point to Robust 2017 Spending 10-20-16
ABI – DMI – Starts – Construction Spending 2-22-17
Construction Backlog Leading Into 2017 1-16-17
Construction Backlog 2017 3-20-17
Construction Starts and Spending Patterns 9-26-17
Starts Trends Construction Forecast Fall 2017 11-8-17
Backlog Construction Forecast Fall 2017 11-10-17
Spending Forecast
Forecast 2017 Construction Spending 1-7-17
Are We at New Peak Construction Spending? 1-4-17
Trends in Construction Spending 3-5-17
Construction Spending Almost Always Revised UP 5-1-17
Construction Spending May 2017 – Behind The Headlines 7-6-17
So, About Those Posts “construction spending declines…” 10-4-17
Ahead of the Sept Construction Spending Forecast 10-25-17
Nonresidential Buildings
Nonresidential Bldgs Construction Spending 2017 1-4-17
Office Buildings Lead 2017 Construction Spending 2-15-17
Nonresidential Bldgs 2017 Forecasts Vary 2-5-17
Nonres Bldgs Construction Spending Midyear 2017 Forecast 7-24-17
Residential
Housing Starts vs Residential Construction Spending 2-18-17
Infrastructure Outlook
Infrastructure Outlook 2017 1-12-17
Calls for Infrastructure Problematic 1-12-17
Infrastructure – Ramping Up to Add $1 trillion 1-30-17
Saturday Morning Thinking Out Loud #1 – Infrastructure 10-29-16
Is Infrastructure Construction Spending Near All-Time Lows? 10-10-17
Public Construction
Public Construction Spending 2016-2017 10-21-16
Infrastructure & Public Construction Spending 3-5-17
Jobs
Construction Spending vs Jobs 2-9-17
Behind The Headlines – Construction Jobs 2-16-17
Is There a Construction Jobs Shortage? 3-10-17
Construction Jobs Growing Faster Than Volume 5-5-17
Construction Jobs / Workload Balance 11-2-17
Inflation
How Much Does A Steel Cost Increase Affect Construction? 9-18-16
Constant Dollars – Impact of Inflation 2-4-17
Construction Inflation Index Tables UPDATED 8-6-17
Constant Dollar Construction Growth 11-2-17
Office Buildings Lead 2017 Construction Spending
New construction starts in 2016 for Office Buildings is setting up a very strong spending growth pattern for the next 2 years.

The five largest metropolitan areas comprise more than one third of total national new starts in commercial-multifamily construction. Total commercial-multifamily starts are up 7%. Commercial starts alone are up 11%. New starts for office projects increased more than 30% in 2016. The following percentages are growth in starts for new Office Buildings. Reference Dodge Data & Analytics New Commercial and Multifamily Construction Starts.
- New York City-Northern NJ-Long Island -2%, but from 2015 that was up 138%
- Los Angeles-Long Beach-Santa Ana +67%
- Chicago-Naperville-Jolliet +22%
- Washington DC-Arlington-Alexandria +87%
- Dallas-Fort Worth-Arlington +31%
Office construction starting backlog for 2017 (projects under contract as of Jan 1, 2017) is the highest in at least 8 years, more than double at the start of 2014 when the current growth cycle of office construction spending began. Also, the share of spending in 2017 from starting backlog is increasing.
Office spending since 2013 has increased every year by an average of more than 20%/year and is expected to continue or exceed that rate of growth in 2017.
Office construction spending reached a new all-time high in September 2016. Growth in office buildings will lead all 2017 commercial construction spending. Spending will be near +30% year over year growth for 2017 with total expected to come in at $91 billion.
Regardless what market fundamentals change for 2017, this work is already under contract and will be the driving force for 2017 nonresidential buildings spending.
See Also these related articles
Nonresidential Bldgs 2017 Forecasts Vary
Nonresidential Bldgs Construction Spending 2017
Behind The Headlines – Construction Backlog
Nonresidential Bldgs 2017 Forecasts Vary
2-5-7
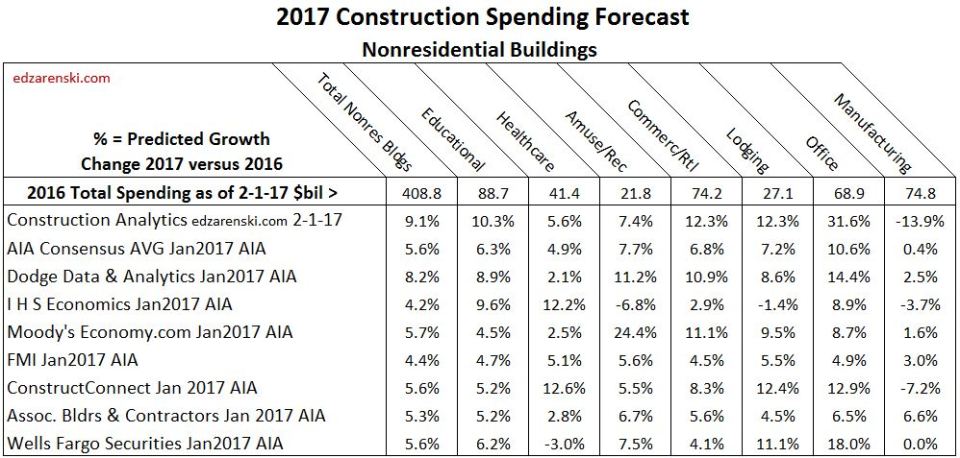
The following table includes my 2017 growth forecast for construction spending in nonresidential buildings compared to the recently published AIA Consensus Forecast which includes individual forecasts from seven economists.
The AIA Jan. 2017 Nonresidential Consensus Forecast can be found here
My 2017 Nonresidential Buildings Spending Forecast can be found here
Construction Analytics (edzarenski.com) forecast is based primarily on scheduled cash flow of construction starts in backlog. About 75% to 80% of all nonresidential buildings construction spending in 2017 will be generated by projects that are already underway. Only 20% to 25% of all spending in 2017 will come from new projects that start in 2017.
See my recent blog post on 2017 Starting Backlog here describes in part how I use backlog starts data to generate future spending forecast.
Nonresidential buildings 2017 starting backlog is 45% higher than at the start of 2014, the beginning of the current growth cycle. Spending in 2017 from that starting backlog has increased every year and it will be up 35% over 2014.
This comment I made two weeks ago in a post on Dodge Data 2016 Construction Starts helps explain in part the level of new starts in 2016 that established the pattern I see going into 2017:
“Nonresidential Building new starts in December remained consistent with October and November. Although well below the yearly highs reached in August and September, the final three months helped carry 2016 totals to an 8-year high. Nonresidential Buildings starts for the last six months averaged the highest since the 1st half of 2008.”
Nonresidential Buildings spending for 2016 totaled $409 billion, UP 8.1% from 2015.
Nonresidential Buildings spending in 2017 is forecast to increase to $447 billion, 9.1% over 2016.
The most recent 3-month average seasonally adjusted annual rate (SAAR) is already leading into 2017 starting at $420 billion only 5.5% below the peak in 2008. By midyear 2017 the SAAR will reach a new all-time high.
The widest variances between my forecast and the AIA panel forecasts are in Office, Manufacturing, Educational and Commercial. Here are explanations to support my forecast.
Office project starts at the end of the year increased more than 30% for 2016. Office construction 2017 starting backlog (projects under contract as of Jan 1, 2017) is the highest in at least 8 years, more than double at the start of 2014 when the current growth cycle of office spending began. More importantly, the share of spending from starting backlog is also increasing for 2017. This is setting up a very strong spending growth pattern for the next 2 years.
Manufacturing buildings new starts dropped 33% in 2015 and 38% in 2016. A disproportionately large portion of both 2015 & 2016 spending was generated from starts in 2014. In 2014, starts had jumped 80%+, but now almost all of that work is completed. For 2017, the amount of spending from starting backlog has dropped 25% from the level of 2016. Even an increase of 50% in new 2017 starts would not make up for that loss.
Educational buildings new starts increased 11% in 2016. But more important is that the total value of starting backlog has been increasing for several years. In 2015, the value of starting backlog increased only 5% over 2014. In 2016 it was 9% and in 2017 it is 13%. Even if new educational starts in 2017 decline by 10% to 20%, 2017 spending is being driven higher by the work already in backlog.
Commercial spending increased 11% in 2016. For 2017, spending from starting backlog will increase 10%, and starting backlog is at the highest level since pre-recession. In fact, spending from starting backlog will be 40% higher than 2014. Since starting backlog generates about 75% of spending within the year, most of the growth in 2017 is coming from very strong starting backlog.
Once again,”Simply referencing total backlog does not give a clear indication of spending within the next calendar year. The only way to know how much of total backlog that will get spent in the current year and following years is to prepare an estimated cash flow from start to finish for all the projects that have started in backlog.”
With few exceptions over the last three years, Construction Analytics, Dodge Data & Analytics and ConstructConnect have provided the most accurate forecasts. We’ll see in Feb. 1, 2018 how we all did when the total 2017 spending report gets released.
Infrastructure Outlook 2017 – Construction Spending
1-12-17
2-1-17 Upated to include Decmber data
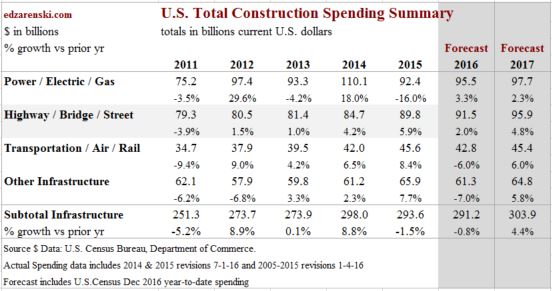
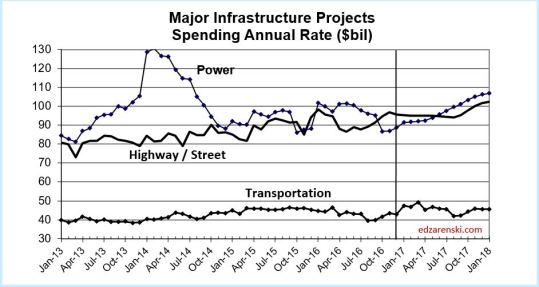
Non-building Infrastructure spending in 2016 will finish at $291 billion, down less than 1% from 2015. Spending based on projected cash flow from Dodge Data Starts predicted this drop. The negative drivers were Transportation, Sewage/Waste Disposal, Communications and Water Supply. Power, the largest infrastructure market at 34% of total sector spending, will finish up 3.3%. Highway/Street, 31% of total sector, will finish up 2%.
In 2017, Non-building Infrastructure, following two down years, will increase by 4.4% to $304 billion, due to growth in the highway and transportation markets. In the most recent quarter spending began to recover from 2016 lows posted in August and September. 2017 will be a record year for Infrastructure spending supported by spending generated from the Fixing America’s Surface Transportation Act and potentially the Water Resources Development Act.
Annual percent growth in new starts (backlog), by itself, is not necessarily a good indicator of spending in the following year. The duration of backlog must be known to forecast spending.
At the beginning of 2016, work in backlog had increased 9% over 2015, but because a large percentage was very long duration work, the amount of cash flow (work put-in-place) in 2016 from that backlog decreased from 2015.
At the beginning of 2017, work in backlog increased only 6% over 2016. What is significant though is that the amount of cash flow in 2017 from that backlog will be up 10%. That is being caused by long duration work-to-complete backlog from 2014 and 2015, which is dominated by spending in the power market. In the 1st five months of 2015, a years worth of Power work started and it’s not yet completed. It’s still contributing to infrastructure spending in 2017.
Although new starts in 2016 will finish down 6% from 2015, starts in 2015 were so strong that 2016 will still be a high volume of new starts. 2015 was up 25% from 2014. So, even though headlines will point to a 6% decline in new infrastructure starts in both 2016 and 2017, due to the distribution of spending from backlog, 2017 spending will post the largest growth in 3 years. 2017 will be a record year for spending on infrastructure, up more than 4% from 2016.
Infrastructure construction starts and spending is dominated by movements in Power and Highway markets. Power/Electric/Gas and Highway/Bridge/Street, about equally, comprise 65% of all infrastructure spending. Transportation/Air/Rail accounts for 15%. Sewage/Waste 8%, Communication 6%, Water 4% and Conservation 3%.
Power is 90% private, 10% public. Highway is 100% public. Transportation is 30% private, 70% public. Sewage, Water and Conservation are 100% public. Communication is 100% private.
Power project starts dropped 25% in 2016 but from the highest annual total of starts on record in 2015. In addition, power had very strong starts in late 2014. All of those very strong starts in late 2014 and all of 2015 are still ongoing in backlog and will contribute to strong spending in 2017. Almost half of all the spending in 2017 is generated from projects that started in 2014 and 2015. Power spending in 2017 will increase 2% over 2016 for a 6th consecutive year of near $100 billion in spending.
Highway/Street, the second largest public market, reached all-time highs in spending from the 3rd quarter 2015 through the 1st quarter 2016. After a 6 month slow down, spending in November again reached a new all-time high. Highway spending in 2017 will grow 5% over 2016.
Transportation hit all-time highs in spending all during the 2nd half of 2015. Spending declined by 6% in 2016 but is still the second highest year on record. It will again equal those 2015 highs throughout all of 2017. Transportation spending in 2017 will grow 6% over 2016.
Projected impact of proposed infrastructure stimulus:
- None of the starts or spending detailed above includes any projections of potential work from future stimulus.
- Infrastructure spending, about 25% of total construction spending, increased more than $25 billion in a single year only once. The average annual growth for the past 20 years is less than $10 billion/year. Although infrastructure growth is always erratic with no growth some years, the average growth for the last six years (post-recession) has averaged $10 billion/year. Some of those years included prior stimulus growth.
- The annual growth in PUBLIC Infrastructure has never exceeding $20 billion in a single year and averages only $7 billion.
- The average growth in infrastructure jobs (excluding all recessionary years because those years would make the result approach zero) is about 25,000 jobs per year.
- Based on infrastructure proportion of all construction, and on both all construction and infrastructure historical maximum rates of spending and jobs growth, it may be unrealistic to anticipate more than $10 billion/year growth in the infrastructure sector. ie., (from current total add $10bil yr1, $20bil yr2, $30bil yr3, etc.) See Infrastructure – Ramping Up to Add $1 trillion for more detailed explanation.
-
Also See Infrastructure & Public Construction Spending
Forecast 2017 Construction Spending
1-7-17
This is my initial forecast for 2017. Census final revisions to Oct., Nov. and Dec. 2016 spending will not be posted until February, March and April. I will then update the 2017 forecast to reflect better input. Then, with the June 1, 2017 release of spending, Census will post revisions to all 2016 spending. The 2016 record will then be updated.
2-1-17 Updated to include Dec 2016 data
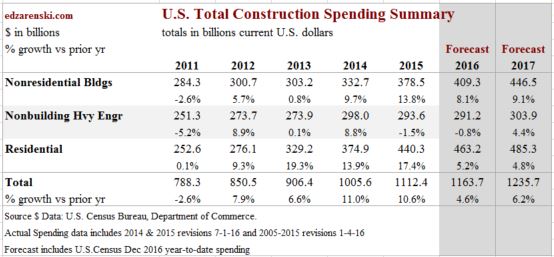
Total construction spending in 2017 will reach $1,236 billion supported by a 4th consecutive year of strong growth in nonresidential buildings. The monthly rate of spending will range from near $1.2 trillion in January to $1.3 trillion at year-end.

Nonresidential Buildings spending in 2017 will increase to $447 billion, 9.1% over 2016. The most recent 3-month average seasonally adjusted annual rate (SAAR) is $420 billion, only 5.5% below the peak of $444 billion in 2008. By midyear 2017 the SAAR will reach a new all-time high and it will finish the year near a SAAR of $460 billion. Office spending will lead 2017 with 30%+ growth. Commercial, Lodging and Educational markets are all expected to post strong gains over 10%.
For details on Nonresidential Buildings, See Behind The Headlines – Nonres Bldgs Construction Spending and Nonresidential Bldgs 2017 Forecasts Comparisons
Non-building Infrastructure, following two down years, will increase by 4.4% to $304 billion, due to growth in the highway and transportation markets. In the most recent quarter spending began to recover from 2016 lows posted in August and September. 2017 will be a record year for Infrastructure spending supported by spending generated from the Fixing America’s Surface Transportation Act and potentially the Water Resources Development Act.
For Non-building Infrastructure details see Infrastructure Outlook 2017
Residential will increase only moderately to $485 billion, adding 4.8% over 2016. That follows on three years of substantial growth averaging 17%/year. More than any other sector residential work is more dependent on new starts within the current year to generate spending, approximately two thirds of all spending within the year.

Office building new starts through August were up only 6% year-to-date but starts in September reached the highest in years. The 2016 starts finished at +37% providing the highest amount of work in backlog going back at least 8 years. Lodging starts in 2016 finished up nearly 40%, Healthcare up 20% and Amusement/Recreation up 35%.
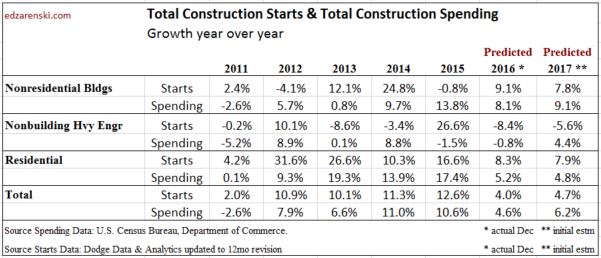
Power project starts dropped 30% in 2016 but from the highest amount of starts on record in 2015. In addition, power had very strong starts in late 2014. All of those very strong starts in late 2014 and all of 2015 are still ongoing in backlog and will contribute to positive spending in 2017. Almost half of all the spending in 2017 is generated from projects that started in 2014 and 2015.
See Also 2016 Construction Spending 1-3-17
Nonresidential Bldgs Construction Spending 2017
1-4-17
This is a first pass at 2017 spending. It will be update in February when December starts and spending become available.
2-1-17 updated to include December data
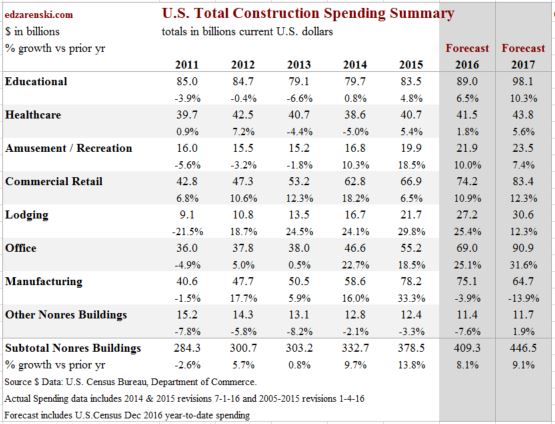
Nonresidential Buildings spending for 2016 totaled $409 billion, UP 8.1% from 2015. Spending posted increases of 9.7% in 2014 and 13.8% in 2015.
Nonresidential Buildings spending in 2017 will increase to $447 billion, 9.1% over 2016. The most recent 3-month average seasonally adjusted annual rate (SAAR) is $420 billion, only 5.5% below the peak in 2008. By midyear 2017 the SAAR will reach a new all-time high. Office, Commercial, Lodging and Educational markets are all expected to post strong results over 10% growth in 2017.

Office building new starts through August were up only 6% year-to-date but starts in September as tracked by Dodge Data & Analytics reached the highest in years. 2016 starts finished at +37% providing the highest amount of work in backlog going back at least 8 years. Lodging starts in 2016 finished up nearly 40%, Healthcare up 20% and Amusement/Recreation up 35%.
Manufacturing – spending will finish down this year, $75 billion vs $78 billion in 2015, but both years are more than 30% higher than the next closest years, 2014 and 2009. Rather than labeling 2016 a down year, 2015-2016 should be described as an extended period of extremely strong spending. 2017 spending will drop the most since pre-recession to $65 billion but will still remain well above 2014. In 2005-2006, manufacturing was less than 10% of total spending in the nonresidential buildings sector. In 2015 it reached 21%. Today it is 18%. Manufacturing in some reports is referred to as Industrial.
Office – spending dropped more than 40% from $65 billion/year in 2007-2008 to $37 billion from 2010 to 2013. Since then it has increased every year by an average of more than 20%/year and is expected to continue that level of growth in 2017. New starts for office projects increased more than 30% in 2016. Office construction 2017 starting backlog (projects under contract as of Jan 1, 2017) is the highest in at least 8 years, more than double at the start of 2014 when the current growth cycle of office construction spending began. More importantly, the ratio of spending from starting backlog is also increasing for 2017. This is setting up a very strong spending growth pattern for the next 2 years. Office construction reached a new all-time high in September 2016. Spending will be in the range of +20% to +30% year over year growth for 2017 with total coming in at $91 billion. Office was more than 16% of total sector spending in 2006 through 2008 before dropping to 13% in the recession. Now at over 17%, it has been growing steadily for the last few years. In 2017 it will be 19% of total sector spending. Offices includes data centers.
Commercial/Retail – this market dropped from $90 billion in 2007 to $40 billion in 2010. It has been growing steadily since reaching bottom in early 2011, but has only recovered to an annual total rate of $78 billion. New starts in 2016 increased moderately. For 2017 spending remains in a tight range between $82 and $84 billion, with total 2017 growth coming in at just over +12%.
Lodging – this market recorded the largest drop of any, falling 75% from $36 billion in 2008 to $9 billion in 2011. However it recorded the strongest rebound of any market climbing 19% to 30% per year for the last 5 years. New starts in 2016 increased almost 40% setting up increased spending from starting backlog in 2017. In 2017, lodging will grow by 12% with a spending total of just over $30 billion. Lodging is still 2 years away from reaching previous highs. Lodging dropped to only 3% of total sector spending in 2011 but has rebounded to 7% in 2016.
Educational – previous highs of over $100 billion in both 2007 and 2008 are perhaps two years away. However, the rate of growth has been increasing slowly since 2014 from 1% to 4.8% to 6.5% annually. New starts have increased every year since 2012. Expect 2017 educational spending to increase by more than 10% to $98 billion. At peak, educational represented 30% of all nonresidential buildings spending. Now it’s only 22%.
Healthcare – this market has been very slow to recover, experiencing declines as recently as 2013 and 2014, hitting an 8 year low in 2014, when all other nonresidential building markets had already returned to growth. 2015 was a moderate growth year, up 5%, but 2016 increased less than 2%. Starts are indicating 5.6% growth to $44 billion for Healthcare spending in 2017. Healthcare has dropped from 14% to only 10% of all nonresidential buildings spending.
Amusement/Recreation – this market hit an 8 year low in 2013 but we’ve had 3 years of excellent growth of 10%/yr or more. 2017 is expected to increase 7.4% over 2016 to a total of $23 billion. This market is only 5%of nonresidential buildings spending.
Religious and Public Safety represent less than 3% of total nonresidential building spending. The religious bldg market has been declining since 2002 and is down 55%. Public Safety peaked in 2009 and has declined every year since, now down 40%.
2016 Construction Spending 1-3-17
1-3-17
U. S. Census posted November construction spending 0.9% higher than October and 4.1% higher than November 2015. Year-to-date spending through November is 4.4% higher than 2015.
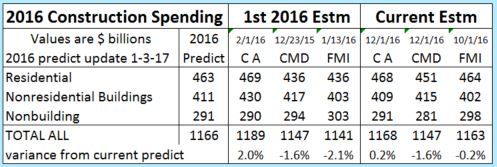
With only one month to go, 2016 is predicted to finish at $1,166 billion, up 4.8% from 2015. December spending is projected to come in at an annual rate near $1,200 billion. At this point, in order for total 2016 spending to drop below $1,160 billion, December would need to fall 6% below November, a magnitude of change that simply does not occur from month to month.
Current monthly spending is at a 10 year high and on a current dollar basis (before adjusting for inflation) is exceeded in all historical spending by only 5 months at the peak spending in early 2006. By the 2nd quarter of 2017 spending will reach all-time highs on a current dollar basis. On a constant dollar basis adjusted for inflation we are still several years below peak spending.
For inflation adjusted spending see “Are We at New Peak Construction Spending”
Revised spending for September is 1.25% higher than original posted on 11-1-16 and for October is -0.1% lower than original posted 12-1-16. However, October data is still pending revision again on 2-1-17 and is expected to increase. In the last 3 years every month has been revised up from the original amount posted. 2016 monthly revisions year-to-date average +1.3%.
The table included here shows the predicted total 2016 spending compared to 1st 2016 estimates and current 2016 estimates provided from my data = CA (Construction Analytics) and from CMD (ConstructConnect) and FMI.
Construction Spending Sept 2016
11-1-16
September data for construction put-in-place was released today. Year-to-date (YTD) spending is up 4.4% over last year. With September first data release at $1,150 bil SAAR, this seems to establish that we’ve clearly passed a forecast dip in spending that bottomed in April and May. We’ve now had 4 months of spending up from the previous quarter and all up from the same respective months in 2015.

One thing that stands out in the data; so far every month in 2016 construction spending has been revised upwards after the first data release, by an average of +1.2%. Checking back to Jan 2014, all but once spending was revised up after the first number released.
For the 1st eight months of 2016, six of eight times the first comparison of spending showed a decline this month vs previous month. After revisions, the final values show only one month/month comparison was down.
June data which appeared quite low at first has now been revised up by +1.8% (+$21bil saar), with most of the June revision in nonresidential buildings. Most of the July revision was to residential spending. The last three months of construction spending on average have been revised up by +1.5% each.
So, even though the first print shows September down -0.4% from August, historical data would indicate we could expect September to get revised up, perhaps by 1%+ which would result in September finishing higher than June, July or August. Of course, there is always the chance it might get very little increase, and August could still get revised.
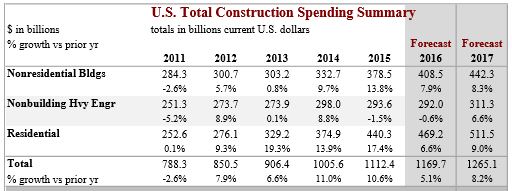
Residential spending is up 5.7% ytd and is on track to finish 2016 at $470bil, +6.6% over 2015. Last year, peak spending was in September, then residential spending dropped slightly in Q4 2015. This year I expect 2016 spending to peak in Q4, so we should see ytd performance get better as we approach year end. Cash flow from new starts indicate growth of 9% in 2017 spending.
Total Nonresidential spending is up 3.6% ytd, on track to finish 2016 at $700 bil, up 4.2% over 2015. Almost all the 2016 growth is in nonresidential buildings, not infrastructure.
For the 3rd quarter 2016, compared to the same quarter in 2015, nonresidential spending is up only 1%, but the spending patterns are not apparent unless we separate nonresidential buildings from non-building infrastructure.
For the 3rd quarter 2016, compared to a year ago, nonresidential buildings spending is up 7% and non-building infrastructure is down 6%.
Nonresidential Buildings spending is up 8% ytd through September, led by Office, Lodging and Commercial Retail markets. We should finish 2016 up 8% with a total at $410 billion vs. $379 billion in 2015. Total sector growth for the last three years is 35%. I’m predicting 2017 spending for Nonresidential Buildings will increase 8%, led by Educational and Office spending.
The market share percent of total nonresidential buildings for each market is:
educ=22%, mnfg=19%, comm=18%, offc=17%, hlthcr=10%, lodg=7% and amus/rec=5%.
Office construction spending 2016 growth will be 20%+, now greater than 20%/yr for three consecutive years. At 17% market share, by far it is the largest contributor to nonresidential buildings spending growth in 2016, contributing +3.7% growth.
Lodging is expected to finish 2016 up 26% and has averaged greater than 25%/yr growth for four years. But lodging has only 7% market share, so contributes only +1.8% growth to nonresidential buildings.
Commercial Retail is up 9% with 18% market share and so contributes +1.6% to overall nonresidential buildings growth. For the three-year period 2012 to 2014, commercial averaged 14% growth.
Educational spending, up 5% at 22% of the market, contributes +1.1% to overall nonresidential buildings growth in 2016. Educational spending should finish 2016 up 6%.
Manufacturing buildings present a unique situation in 2016. Manufacturing is down -2.4% ytd. At 19% market share, that reduces total nonresidential buildings growth by -0.5%. On the surface, manufacturing is lowering total nonresidential buildings growth. Although manufacturing spending is down, it’s still very high, so it’s impact should not be viewed as negative to the overall sector. Spending increased 50%+ in 2014 & 2015. Spending in 2016 will still be the 2nd highest year on record, down only slightly from 2015 but still more than 30% higher than 2014 and more than 50% higher than 2013.
Educational spending is 80% public and 20% private. In public markets educational is only up 4% ytd, but in private markets it’s up 10%. Private spending is driving total educational to $89 billion for 2016, up 6% from 2015. 2016 will be the best year since 2008. 2017 may reach 7% to 8% growth.
60% of all public work is infrastructure. Education accounts for 25% of public work. Educational is by far the largest building type in public work. All the remaining building types contribute only 2% to 4% each.
We are currently at what I expect could be the 2016 nonres bldgs spending peak, with very little gains across Jul-Aug-Sep-Oct. Nonres bldgs spending may flatten or drop for several months before resuming the climb. This drop may be in large part due to uneven starts from the end of 2014 and beginning of 2015, a period when starts were abnormally high, that are now finishing and dropping out of the monthly spending values. Usual normal growth patterns do not fill the void left when abnormally high volume of projects finish.
Nonbuilding Infrastructure spending is down 1% ytd. Cash flows from starts predicted this drop. The biggest negative drivers are Transportation, Sewage/Waste Disposal and Water Supply, each contributing more than 0.5% to the total decline. Power, the largest infrastructure market at 33% of total, is up 4% ytd so adds +1.33% to growth, tempering some of the declines. Spending in 2016 will reach $292 billion, down less than 1% from 2015. Growth resumes in Q1 2017.Although new starts in 2016 will finish down 10%, starts in 2015 were so high that 2016 will still be a good volume of new starts. Cash flows from all existing starts are predicting 2017 will be a record year for spending on infrastructure, up more than 6% from 2016.
My forecast for total spending in 2016 is $1,170 billion, up 5% from 2015. I expect 8% growth in 2017.
U S Census September Construction Spending Released 11-1-16
See also this post from October Starts Point to Robust 2017 Spending

