update 8-6-16 See this link to July Jobs Report
Construction spending for June reported by U.S. Census totaled $1.134 trillion, the lowest since $1.126 trillion in December 2015. Spending hit the lowest for 2016 after reaching a 9 1/2 year high of $1.176 trillion in March.

Spending for June is down 0.6% month/month from a revised May. May and April were both revised down. Construction spending year-to-date is now only +6.2% vs. the same six months 2015. It was above +8% year-to-date for the last three months.
Construction spending reached a 9 1/2 year high in March. The biggest declines in spending since March are Residential -5%, Healthcare -4%, Educational -6%, Highway & Street -6%, Sewage & Waste Disposal -12% and Manufacturing -8%. The only significant increases since March are Lodging +3.4%, Power +2.5% and Conservation +6%. Power is the only big $ volume sector.
The Census spending numbers for both May and June seem somewhat suspect as they fall well outside the statistical mean for expected percentage of total annual spending within those months. June reported residential spending is 6% below statistical mean for June, larger than any variance in 15 years, therefore it becomes suspect. Granted this is based on only six months of actual spending with six months still to go. However the residential variance is so significant, following that trend would reduce residential spending for the remainder of the year by $30 billion, or more than 10% of the final six months. This is an unlikely scenario, unless it were to signify the beginning of a steep downturn starting in March and continuing for the remainder of 2016. Construction starts dollar volume does not support that scenario. Therefore, I have not adjusted down my predicted spending for the remainder of the year based on the downtrend for April, May and June as-reported actual spending. Although it is an uncomfortable position to take, I expect to see some upward revisions in the coming months.
Spending is dependent on long duration cash flows from all previous construction starts. Construction Starts as reported by Dodge Data & Analytics provide a base to predict spending. Dodge reports starts in dollars. Starts gives a long term trend view of spending.
Previously I said we should expect a short duration downturn in spending occurring from January through March. The monthly unevenness in the dollar volume of new starts over the last two years indicated a slowdown in spending during the first quarter 2016. As it turns out, first quarter spending was much stronger than expected, averaging $1,175 billion which is a 9 1/2 year high. Spending has been declining since the March peak, averaging only $1,140 for Q2, down 3% from Q1, but still near a nine year high.
It will take several more months to see if spending rebounds and to see if that helps identify this April-May-June downturn as the dip I expected in Q1, but just had targeted it off by several months for when the dip would occur.
If May or June get revised up and/or the 2nd half rebounds to confirm the slight dip, spending will come right back to the long term trend.
Total first half spending is only 1% below what I predicted. If a 2nd half spending rebound materializes, we should still finish 2016 near $1.200 trillion in total spending, up 8% from 2015.
This article by Luke Kawa @LJKawa on BloombergMarkets @markets which quotes me also includes comments from Bespoke’s @GeorgePearkes on the disparity between the trend in spending and Census residential # of units under construction. The graphic comparison shows spending vs # units diverging for May-June, units advancing and spending declining. This is another clue this may get revised in future data.
Something Is Odd About the Latest U.S. Construction Data
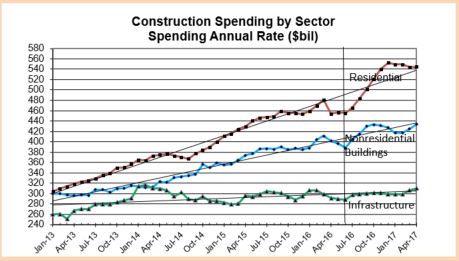
7-6-17 The most recent release of Census Construction Spending data issued July 3, 2017, revises data back to January 2015. The May and June 2016 data discussed in the Aug. 2, 2016 article linked above were both revised up 3%. This upward revision to the data puts it right in line with growth expected back in August 2016, confirming our questioning the data as suspect at that time.