7-7-16
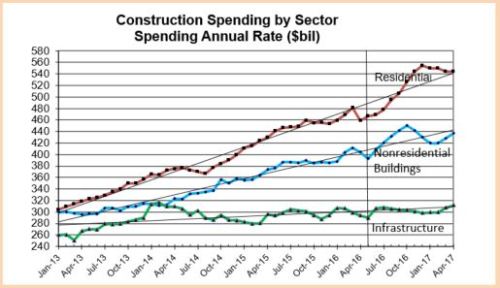
Construction Spending year-to-date (YTD) through May versus the same 5 months 2015 is: Residential +9.8%; Nonresidential Buildings +9.3%; Non-building Infrastructure +3.9%. Total construction spending YTD is up 8.2% from the same period 2015.
How does this compare to my prediction at the beginning of the year?
At $176.6 billion YTD, residential spending is 5.1% higher than predicted (+$8.6bil). Nonresidential buildings spending at $154.9 billion YTD is 2.5% below (-$4bil) expected and non-building infrastructure at $107 billion YTD is 2.4% higher (+$2.5bil) than expected. Total construction spending is 1.8% (+$7.1bil) higher than I expected through May.
Six months ago I predicted a dip in construction spending would occur early in 2016 with different sectors hitting a low point in February or March. Prediction analytics are much better at identifying a trend rather than the exact month it may occur. In this case, both February and March had strong spending increases. It looks like we may see the dips now with declines in both April and May. That makes the June data more important.
Where are the gains and losses?
By a large margin, two thirds of the unexpected gains in Feb-Mar were in residential construction, almost all of that in residential renovations. Likewise, most of the dip in Apr-May is caused by a decline in residential work, but the declines came mostly in new single-family housing spending.
Nonresidential Buildings spending YTD combined for Lodging, Office, Commercial, Educational and Amusement is up 14%. This group just more than 2/3rds of all nonresidential buildings. Manufacturing, another 20% of total nonresidential buildings, is down YTD less than 1%.
Non-building Infrastructure spending is being supported by 7% YTD increases in power, which I didn’t expect, and highway/street. Together they represent 60% of all infrastructure work.
Market Sectors vs Predicted
Year-to-date gains and losses versus my beginning of year predicted include: Manufacturing is -7% (-$2.6bil) lower than predicted; Office +1% higher; Commercial/Retail +3.5% (+$1bil); Lodging +1%; Educational +0.7%; Healthcare -0.5%; Amusement/Recreation -2.1%; Power +18% (+$5.9bil); Highway Street -5.7% (-$1.7bil); Transportation -4.4%; Residential +5% (+$8.6bil).
My prediction still indicates that we are headed for strong growth, total spending up +9% to +10% for 2016. I expect both residential and nonresidential buildings to increase slightly from current trend and non-building infrastructure to slow.
Census Construction Spending with this May 2016 data is revised back to January 2014. Revisions are: 2014 +1.2%; 2015 +1.3%; Jan-Apr2016 +1.7%. This is the first issue of May 2016 data. May data will be revised twice in coming months.
