Home » Forecast (Page 5)
Category Archives: Forecast

Construction Spending 2021 Update 8-2-21
Construction Spending Actual through June 2021
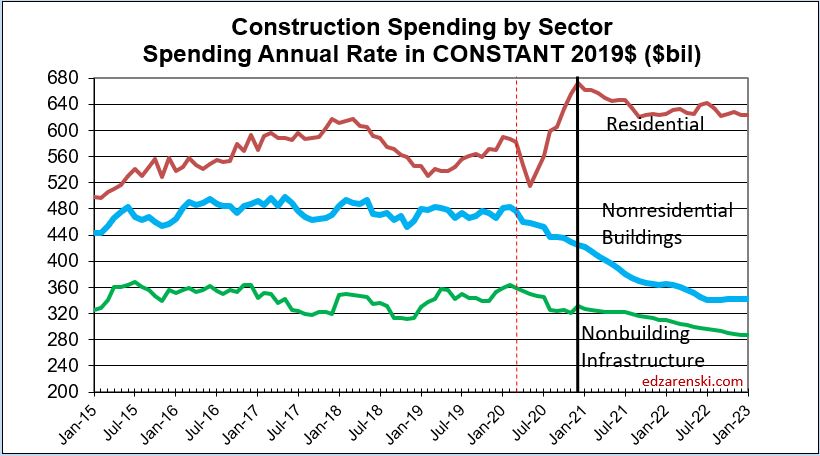
Total Construction Spending is up 5.4% year-to-date (ytd) from the same six month period 2020. Residential is up 24.5%, Nonresidential Buildings is down -10.1% and Nonbuilding Infrastructure is down -5.4%.
The single largest impact to the change in this forecast from last month is Highway and Street. Highway spending in June fell 5%, while my forecast was predicting a gain of +3%. I then lowered my forecast for the rest of this year.
Year-to-date through June, while residential is up 24.5%+, all but one single nonresidential market is down. 15 of 16 nonresidential markets, 98% of combined total nonresidential market value, are down a total of -8%. Only Sewage/Waste Water is up 2.5% ytd. That’s half of the $ in the table item Sewer / Water / Conservation. For the remainder of the year, the rate of nonresidential decline will slow to -4%.
Construction starts are leading the way to recovery, but construction spending, which is dependent mostly on starts from previous years (nonres bldgs 2020 down -20%), will remain depressed for nonresidential construction well into 2022. New nonresidential starts could double from the current rate of growth and it still wouldn’t be enough to turn 2021 nonresidential spending positive.
It is remarkable that both total new construction starts and total construction spending are UP for 2021, but that needs further explanation.
Residential starts increased +9% in 2020 and forecast up +19% in 2021. Residential spending increased +15% in 2020 and is forecast up +18% in 2021 and up +7% in 2022. Both residential starts and spending are at all-time highs. That is what is driving the totals to new highs.
Nonresidential Bldgs starts fell -4% in 2019, -21% in 2020 and are forecast up only +2.5% in 2021. 2021 starts are still -22% below the peak in 2018. Nonresidential Bldgs spending fell only -2% in 2020 but is expected to fall -8% in 2021 and -5% in 2022.
Nonbuilding starts were flat in 2019, fell -15% in 2020 and forecast indicates +4% growth in 2021. Nonbuilding starts are 11% lower than 2019. Nonbuilding spending gained only +1% in 2020, but forecast fell -3% in 2021 and is expected to drop -5% in 2022.
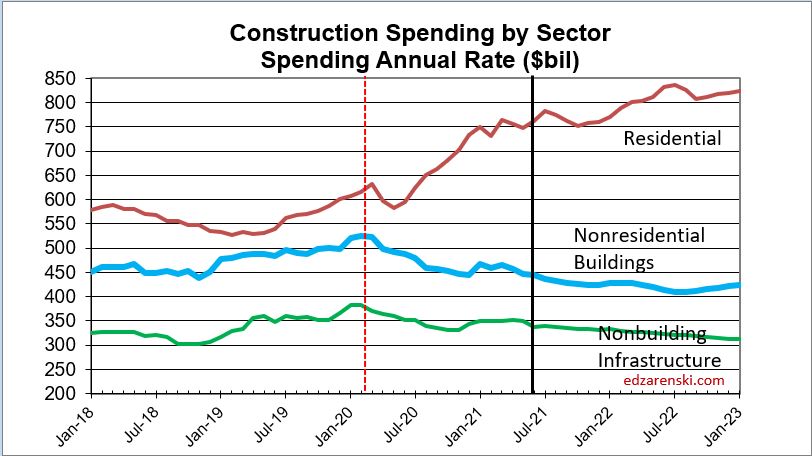
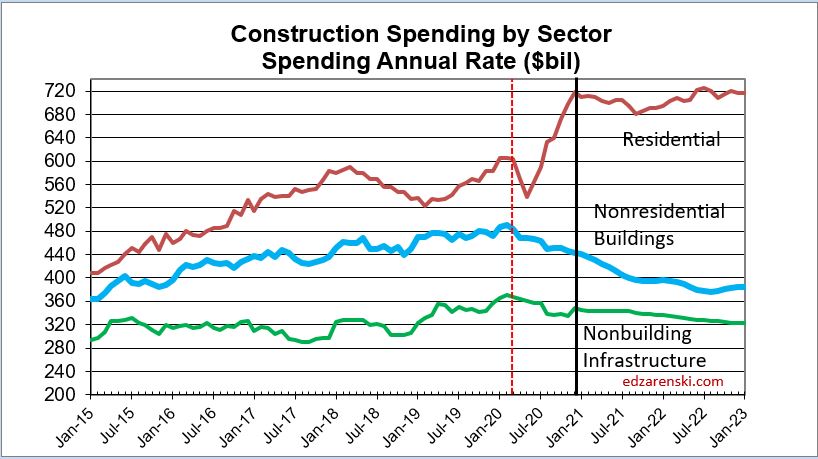
The Total Construction Spending plot doesn’t show enough detail. As described above, more detail is needed to understand what is going on. The sector plot below shows residential up and nonresidential down..

Recovery in both nonresidential buildings and nonbuilding backlog begins to build in a few markets in 2021. But overall, spending in nonresidential buildings and nonbuilding is exceeding new starts, therefore both will begin 2022 with lower backlog than 2021. Total all nonresidential 2021 starting backlog dropped -13% from 2020. Starting backlog at beginning of 2022 will be down another -8%. Backlog increases for 2023.
Aside from residential, recovery to the levels of revenue (spending) recorded in Q1 2020 or earlier won’t show up before 2024.
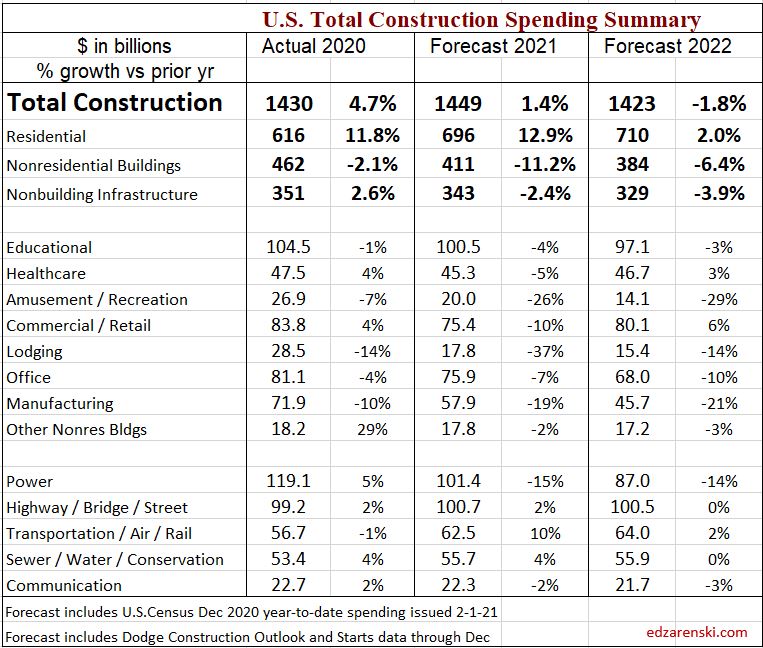
The following table shows ytd through June $ and forecast for 2021/2022. Almost every nonresidential market is down ytd and down compared to the average in Q1 2020 before Pandemic Recession.

Impact of Pandemic Slowdown
The impact of reduced starts in 2020 is showing up in the 2021 year-to-date results. Total Nonresidential Buildings starts were down -20% in 2020. Nonres Bldgs starts for the 1st 6 months of 2021 are level with 2020, still down -8% from the pre-pandemic high in Q1 2020. There is some good news! Nonres Bldgs starts in Q2 2021 are now back above the pre-pandemic high, indicating recovery underway. Nonbuilding Infrastructure starts were down -10% in 2020, but returned to pre-pandemic high several months ago.
Due to the large drop in new starts from Apr 2020, that continued at a level down -20% to March 2021, some nonresidential markets will be affected by a downward trend in spending for two to three years.
The greatest downward impact from a -20%, year-long loss of starts on nonresidential spending will be felt throughout 2021 and into 2022.
Over the next 9 months, every sector will post more down months (in spending) than up months, although the declines will be most noticeable in nonresidential buildings.
Overall performance by sector has changed very little since May.
While most markets recover to positive new starts growth in 2021, spending growth lags, showing the downward trend in 2021 as a result of lost starts in 2020.
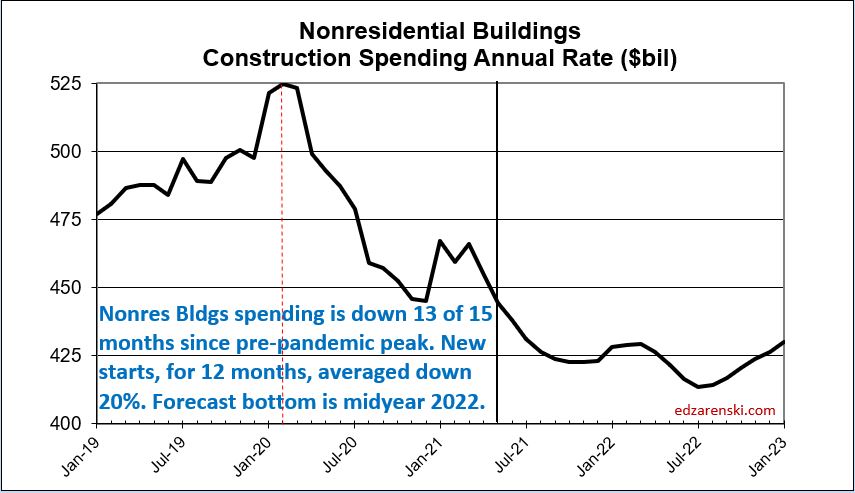
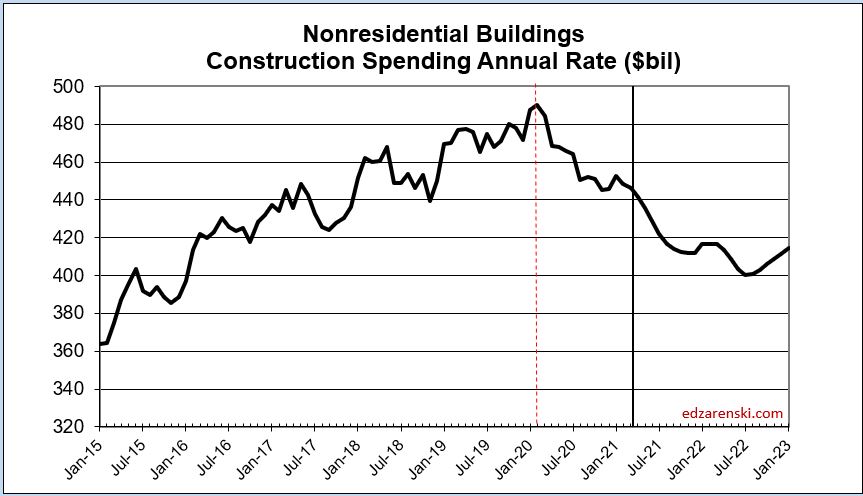
This next plot changes the scale of the spending plot so the nonresidential buildings data can be visualized much easier. This is the exact same data as in the Construction Spending by Sector plot above. The scale change helps immensely to visualize the decline in nonresidential buildings spending. By midyear 2022, the annual rate of spending will be -20% lower than the pre-pandemic peak. It could take two to three years after that to recover to the pre-pandemic level of spending.

A typical batch of new construction starts within a year gets spent over a cash flow schedule similar to 20/50/30, that is, 20% of all starts in the year gets spent in the year started (or over the 1st 12 months), 50% in the next year ( next 12 mo) and 30% in years following. Total nonresidential buildings starts in 2020 were down -20% ($90 bil in spending) and nonbuilding was down -10% ($35bil). Under normal conditions, we know how much of that $125 bil would have occurred in 2020, 2021 and 2022. That’s a loss of spending this year, and that loss remains a steeply downward slope as long as starts remain depressed. Nonresidential buildings starts, depressed for 13 months, posted strong starts indicating recovery beginning in April this year.
If INFRASTRUCTURE BILL starts don’t begin until the 2nd half of 2021, only 30% (of the 1st year cash flow 20/50/30 that is based on 12mo) gets spent in the 1st year. Therefore, even if $100 billion in new infrastructure starts begin in the 2nd half 2021, only 30% x 20% or only about 6% would get spent in 2021. That’s $6 billion, or less than 1% of annual construction spending. So, there will be very little, if any, impact on 2021 construction spending as a result.
Total Public Infrastructure and Public Institutional, the total public work pool for which infrastructure investment is a potential, represents a total LESS THAN $350 BILLION, only 25% of all construction.

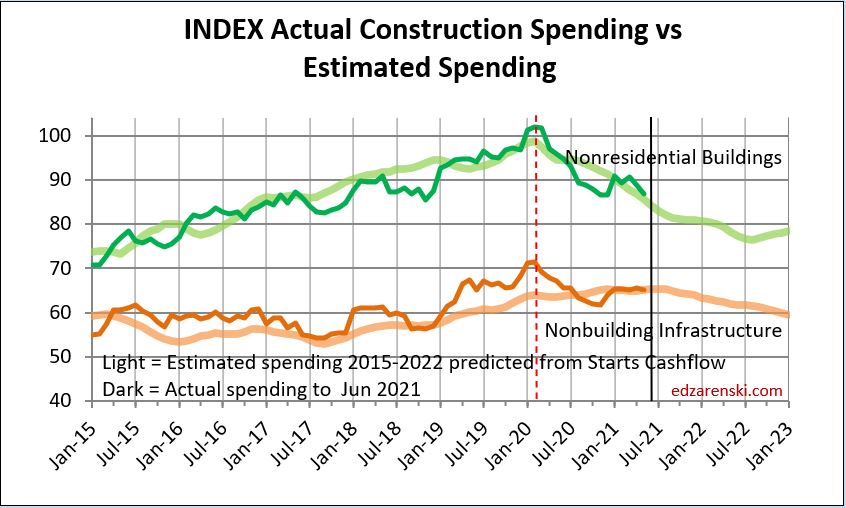
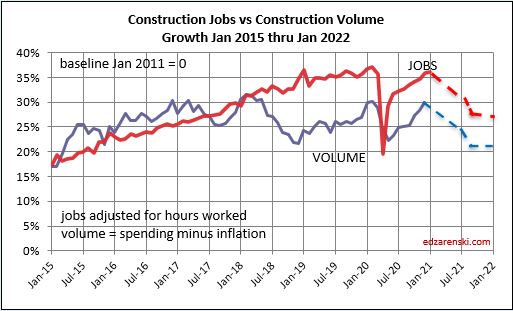
All the forecast spending in the data above is developed from monthly cash flow of new starts. This plot shows what the history looks like when comparing the cash flow forecast to the actual spending growth. Although actual spending is somewhat more uneven, the forecast accurately predicts the direction spending is headed.
JOBS DATA updated 8-6-21
Construction Jobs for July are expected to increase. Jobs are now down 3 consecutive months. Comparing jobs year-over-year in residential is strongly skewed by the rapid declines then rapid growth in 2020. That did not occur in nonresidential. July posted an increase of 11,000 jobs. Year-to-date thru July construction is up by 21,000 jobs. Jobs are down -227K (-3.0%) from Feb 2020 peak. Hours worked are down less than -1%, equivalent to about 50,000 jobs. Expect this downward trend to accelerate into year end.
Construction spending minus inflation (Volume) supports jobs. Most of the increase in residential construction spending this year is INFLATION. Nonresidential spending and volume are both down. There is no meaningful increase in total construction volume to support jobs growth.
Don’t ignore inflation. While residential spending is forecast UP 19% in 2021, 11% of that is inflation. Real volume is up only +8%. Nonres Bldgs volume after inflation is forecast down -12%, Nonbuilding volume down -7%.
If you are still measuring your business growth by change in revenue, you’re including inflation as part of your growth. Inflation is simply more paper dollars exchanging hands, not growth.
Total construction jobs through July measured from peak pre-pandemic (Feb 2020) are down 3%. Volume growth (spending minus inflation) from Feb 2020 to July 2021 is down 6%. Since the onset of the pandemic, we now have 3% more jobs than we have volume of work to support those jobs. The result is a 3% loss in productivity.
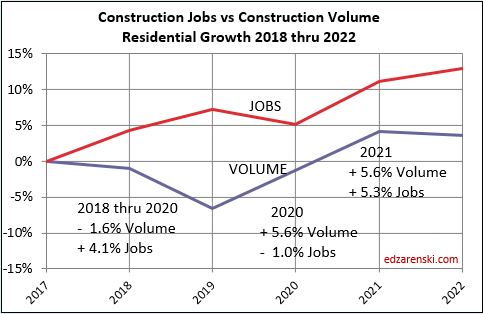
Residential change in revenue from Feb 2020 to July 2021 is up +28%. But the real change in volume after inflation is up only +13%. Residential jobs are up only 3%. This is where the greatest need is currently.
Nonresidential Buildings change in revenue from Feb 2020 to July 2021 is down -15%. After inflation, the real change in volume is down -19%. Nonres Bldgs jobs are down only -7%. This is considerable excess jobs to support the current work.
Nonbuilding Infrastructure change in revenue from Feb 2020 to July 2021 is down -10%. After inflation, the real change in volume is down -17%. Nonres Bldgs jobs are down only -6%. This is considerable excess jobs to support the current work.
The need identified in residential, and likewise the excess identified in nonresidential are not as extreme as both seem. There are a large number of jobs classified as nonresidential that actually perform residential work. Any large firm, and all it’s employees, regardless of the job they perform, if they primarily work on nonresidential buildings, is classified nonresidential for the purpose of the jobs count. However, the buildings they work on are always classified as to building type. This often occurs in several large primarily nonresidential trades such as concrete, structural steel and HVAC, when working on multifamily high-rise buildings. These crossover jobs are not separable from the major classification.
In constant $ (spending adjusted for inflation), even though residential constant $ volume is up 13% from Q1 2020, current total $ volume of all types of work, residential and nonresidential, is 6% lower than the peak average in Q1 2020. Total all $ volume will fall another 5% by year end 2021.
Construction spending is on track to increase 4.7% in 2021 over 2020. But after taking out inflation, spending minus inflation in 2021 will be DOWN 2%. Residential spending increases $115 billion (+18%), but after 11% inflation residential volume increases only $50 billion. All nonresidential spending decreases $49 billion but after adjusting for 4%+ inflation real nonresidential volume is down $86 billion. Total construction volume (spending minus inflation) is expected to decline 5% from May to Dec. Construction Jobs are expected to follow suit.
Construction volume growth is falling due to huge volume of nonresidential starts (-22%) that disappeared in 2020. The affect of those lost starts, which would have had peak spending in mid-2021, is such that the volume of work is declining throughout 2021.
Of concern is that since Feb 2020, total construction volume has recovered to a point that is down 7%, but jobs have increased back to a level that is down only 3%. Jobs are increasing at a rate that is closer to the growth in construction spending, which is substantially greater than the rate of growth of construction volume.
Jobs are increasing faster than the volume of work (which supports jobs). What are the implications of this to the construction industry? The industry as a whole now expends 4% more labor (jobs) to put-in-place every $1 billion worth of work than it did in Feb 2020. That impacts job total labor cost. That is lost productivity and impacts inflation.
Although residential jobs are currently increasing, nonresidential jobs will continue to fall, dropping another 4% over the next 12 months. If jobs growth follows more closely to volume growth, which it should, this time next year construction could be down another 200,000 jobs.

2021 Midyear Forecasts
Here’s how the current year-to-date spending performance, as of June data, compares to various firms’ Midyear Forecasts. The ytd provides insight into expected final 2021 performance. For example, the year-to-date Educational spending is -10.8% with 6 months of spending recorded. One firm has forecast educational will finish up 3.5% for the year. With only 6 months remaining (estimate to complete or etc), here’s how the remaining 6 months would need to perform for that to happen.
[(forecast% x 12) – (YTD% x 6)] /6mo etc = [(+3.5% x 12) – (-10.5% x 6)] /6 = [(+42) – (-64)] /6 = 106/6 = +17.6%.
For the next six months Educational spending would need to average +17.6% growth over last year to swing from currently down -10.8% to end the year up +3.5%. Well, Educational spending is down 16% from the 2020 high, has fallen 9 of the last 13 months and is down an average of -1.5%/mo for the last 5 months. With this performance over the past year, the probability is exceedingly low that Educational construction spending is going to flip from a negative monthly rate of spending to an avg of +17%/mo for the next six months to finish the year up +3.5%. There are numerous examples like this in the forecasts.


AIA Midyear Consensus 2021
7-16-21
The AIA Midyear Consensus solicits the nonresidential buildings construction spending forecast from a number of firms and publishes those results and the Consensus average. The table posted here includes all the AIA forecasts and Construction Analytics 7-2-21 forecast.
https://www.aia.org/articles/6416440-outlook-has-improved-for-construction-spen

Also included in this table is the year-to-date (ytd) actual spending through May. With 5 months of actual data, that ytd result should sway any forecast for any market estimate of year end result. A review of several years of history over all markets shows there are very few instances in the historical data where year end performance swings by more than 10% from ytd at month 4 or 5. Normal variances for about 80% of instances are in the range of 3% to 5%. So with few exceptions, at 5 months into the year, we could estimate year end will be within +/-5% of year-to-date. And yet, there are many instances in these forecasts that are outside that expected range.
The question is, can we determine, how accurate are these forecasts? Some rudimentary checks and balances, and some simple proportional math, provide the answer.
If you forecast a construction spending mrkt to finish 2021 at -30%, but the ytd after 5 months is -5%, the next 7 months would need to average near -50% to get to -30%. With the change in the yoy rate less than -3%/mo, it can’t happen.
If you forecast a construction spending market to finish 2021 at +3.5%, but the ytd after 5 months is -11%, the next 7 months would need to average +14% above Jun-Dec 2020 to get there. That’s a 25%/mo swing from the current rate that would need to hold steady for 7 months.
Likewise, If you forecast a construction spending market to finish 2021 at +11%, but the cum ytd after 5 months is -3%, the next 7 months would need to average +21% above Jun-Dec 2020 to get there. That’s a 24%/mo swing from the current rate for 7 months. Swings like that just don’t happen.
Another market with a glaring example, this time in almost every forecast. Lodging forecasts in the AIA Consensus range from -14% to -20%, with one wild estimate at -43%. Construction Analytics forecast for Lodging is -26%. The year-to-date is -27%. Well, from April to December 2020, spending fell at a rate of 4%/month. In the 1st 5 months of 2021, spending has been down slightly, still hovering near the December low. There are no indications that spending is poised for a rebound. In fact the forecast calls for spending to continue falling through 2021. The current monthly rate of spending averages -25%/mo from 2020. In order to hit any of the forecasts between -14% and -17%, the current rate of spending would need to flip by 15 to 20 percentage points for all of the remaining 7 months of 2021. Spending would need to increase at a rate of 2.5% per month for the next 7 months. This is a good time to remind everyone that Lodging construction starts last year dropped 45%, so the trend is down, not up. Current indications are that spending will decline 9 out of the next 12 months.
The forecasts in this Consensus report have numerous examples like those above. Nonresidential Bldgs actual ytd for the 1st 5 months is -10.5%. Consensus forecast for 2021 is -3.9%. The next 7 months each would need to avg +1% over 2020 to get there. The monthly rate of spending is currently -6% to -10% below 2020 and has fallen 13 of the last 15 months. That’s not going to flip to +1% immediately and stay at that level for 7 months.
The argument cannot be used that monthly data should not be compared to 2020 because of the rapid decline due to shutdowns skewing all the data. That did not occur in nonresidential buildings. Nonres bldgs spending declined 5% in April, but then it averaged a steady -1.5%/mo decline for the remainder of 2020. As of May 2021, spending is right where it was in December, still 16% lower than March 2020. There are no huge down months in 2020 to which 2021 spending would be compared resulting in a large increase to year-to-date percent.
At midyear, the ytd values give some indication of how the year will end. There are a few examples in historical data in which a market did swing by 10% or more from midyear to year-end, but there is less than 10% chance of a market varying by more than 10% and more than an 80% chance markets vary by only 3% to 5%. Rarely does -2% become +8% or +7% become -3%.
11-1-21 updated table added Here’s the same Midyear forecasts with year-to-date updated to September spending. Only the year-to-date has been updated in this table. All forecasts are as posted in July.
6 out of 8 construction spending forecasts for nonresidential buildings reported in the AIA Midyear Outlook Jul’21 could now only be realized IF construction spending YOY for the next 3 months turns positive, in some cases it would need to grow to +10% to +12% YOY for the next 3mo. Currently, YOY is -7%. Construction spending YOY has been near -8% to -7% for last 4 months. The next 5 months is forecast to improve, but improves only to -4%, does not turn positive. There are no indications in the forecast that total nonres bldgs YOY spending will turn positive this year.

And here’s the 2021 Midyear Forecasts compared to the Final 2021 spending.

Compare Current Construction Forecasts
Compare Construction Analytics current construction spending forecast to the most recent forecasts by FMI and ConstructConnect.
Construction Analytics (CA) and ConstructConnect (CCon) forecasts include year-to-date spending. FMI report is titled 2021 2nd quarter edition, but also states based on 4th quarter 2020 actuals.
Both FMI and CCon forecasts have not yet been updated to include 2019 and 2020 revisions released on 7-1-21.
Construction Analytics forecast includes 2019 and 2020 revisions and includes May ytd spending.
Spending Total Put-in-place Forecasts for 2021 range from $1,422 billion (FMI) to $1,574 billion (CCon). Construction Analytics (CA) forecast is $1,526 billion. This is quite a wide spread. Here’s a few of the major differences:
Residential CA = $741 bil, FMI = $627 bil, CCon = $728 bil
Educational CA = $99 bil, FMI = $103 bil, CCon = $108 bil
Healthcare CA = $48 bil, FMI = $49 bil, CCon = $53 bil
Power CA = $110 bil, FMI = $120 bil, CCon = $137 bil
Transportation CA = $56 bil, FMI = $54 bil, CCon = $65 bil
https://edzarenski.com/2021/07/01/construction-spending-2021-thru-may/
https://www.constructconnect.com/blog/quarterly-u.s.-put-in-place-forecast-report-summer-2021
The FMI forecast for residential appears to not yet have been updated to reflect record spending from October through May. I’d expect that will soon be updated. Residential spending year-to-date (ytd) is up 23% and has averaged a seasonally adjusted $740bil for the past 7 months. For the remainder of the year it’s expected to decline about 0.5%/month, but residential spending will still finish 2021 well over $700 billion.
For Power to end up at CCon = $137bil in 2021, considering the ytd through May is already -7%, the remaining 7 months of the year would need to average up 30%. Markets don’t jump that much higher and maintain that level for the next 7 months.
The spread of Spending Put-in-place Forecasts for 2022 ranges over an even wider difference, from $1,355 billion (FMI) to $1,703 billion (CCon). Construction Analytics (CA) forecast for 2022 is $1,533 billion. This is an exceptionally wide spread with some obvious areas of attention.
2022 Residential CA = $779 bil, FMI = $567 bil, CCon = $781 bil
2022 Nonresidential Buildings CA = $421 bil, FMI = $432 bil, CCon = $474 bil
2022 Nonbuilding CA = $333 bil, FMI = $356 bil, CCon = $448 bil
note: Transportation and Communication carried in nonbuilding for like comparison.
At this time of year some firms will present midyear forecasts. My latest report is May ytd data released July 1. With the August 2nd and 6th spending and jobs releases for June we have half a year of data, I’ll base a midyear report on that. I don’t expect any big change since the May data. Not all midyear forecasts will have the same ytd data, so could vary in that respect. So, watch for the midyear forecasts!
Here’ is a link to the results of 8 firms forecasts at Midyear 2020 compared to actual revised final 2020 spending. Also here is the same firms 1st forecast for 2021 compared to actual year-to-date 2021

Construction Spending 2021 updated 7-2-21
Construction Spending Actual through May 2021
Total Construction Spending is up 4.6% year-to-date (ytd) from the same five month period 2020. Residential is up 23.4%, Nonresidential Buildings is down -10.5% and Nonbuilding Infrastructure is down -5.8%.
This analysis includes spending revisions to 2019 (up $26bil, +1.9%) and 2020 (up up $37bil, +2,6%).
In the 1st 3 months of 2020, spending had reached an all-time high averaging a SAAR of $1,521 billion.
In the 1st 3 months of 2021, spending again hit a new all-time high averaging a SAAR of $1,544 billion. In May, spending is $1,545 billion.
Year-to-date through May, while residential is up 23%+, 15 of 16 nonresidential markets, 98% of total nonresidential market value, are down a total of -8.6%. For the remainder of the year, the rate of nonresidential decline will slow to -4%.
Construction starts are leading the way to recovery, but construction spending, which is dependent mostly on starts from previous years (2020 down -22%), will remain depressed for nonresidential construction well into 2022. Recovery in backlog begins to build in a few markets in 2021. However, new nonresidential starts could double from the current rate of growth and it still wouldn’t be enough to turn 2021 nonresidential spending positive.
Aside from residential, recovery to the levels of revenue (spending) recorded in Q1 2020 won’t show up before 2024.
The following table shows ytd through May $ and forecast for 2021/2022. Almost every nonresidential market is down ytd and down compared to the average in Q1 2020 before Pandemic Recession.

The impact of reduced starts in 2020 is showing up in the 2021 year-to-date results. Total Nonres Bldgs starts were down 22% in 2020. Nonbldg Infrastructure starts were down 13%. Some of these markets will be affected by a downward trend in spending for two to three years.
2020 starts for select markets:
- Amusement -38%
- Commercial/Retail -14%
- Office -20%
- Lodging -50%
- Manufacturing -57%
- Power -38%
The greatest downward impact on spending will be felt in mid-2021. Over the next 9 months, every sector will post more down months than up months, although the declines will be most noticeable in nonresidential buildings.

For the next few months the residential year-to-date comparison will be skewed. It is going to increase due to the steep fall-off in spending back in April and May 2020. Then, months of strong growth, a total +38% in 7 months in residential from May 2020 onward, with no equivalent growth increase this year, will cause ytd comparisons to decrease. So, even though residential spending is not forecast to increase any more in 2021, residential spending will peak at +25% year-to-date in the May-June data (due to the steep decline in spending in 2020) before falling back to end at +16% ytd for year end.
While most markets recover to positive new starts growth in 2021, spending growth lags, showing the downward trend in 2021 as a result of lost starts in 2020.
This next plot changes the scale of the spending plot so the nonresidential buildings data can be visualized much easier. This is the exact same data as in the Construction Spending by Sector plot above. The scale change helps immensely to visualize the decline in nonresidential buildings spending. By midyear 2022, the annual rate of spending will be 20% lower than the pre-pandemic peak. It could take two to three years after that to recovery to the pre-pandemic level of spending.
A typical batch of new construction starts within a year gets spent over a cash flow schedule similar to 20/50/30, that is, 20% of all starts in the year gets spent in the year started, 50% in the next year and 30% in years following. Total nonresidential buildings starts in 2020 were down -22% ($100bil in spending) and nonbuilding was down -13% ($50bil). Under normal conditions, we know how much of that $150 bil would have occurred in 2020, 2021 and 2022. That’s a loss of spending this year, and that loss remains a steeply downward slope as long as starts remain depressed. Nonresidential buildings starts, down now for 12 months, posted some hint of recovery in April.
If new infrastructure bill starts don’t begin until the 2nd half of the year, only 25% to 30% (of the 1st year 20/50/30 that is based on 12mo) gets spent in the 1st year. Therefore, even if $100 billion in new infrastructure starts begin in the 2nd half 2021, only 30% x 20% or only about 6% would get spent in 2021. That’s $6 billion, or less than 1% of annual construction spending. So, there will be very little if any impact on 2021 construction spending as a result.
In constant $, spending adjusted for inflation, even though residential constant $ volume is up 13% from Q1 2020, current total $ volume of work is 5% lower than the peak average in Q1 2020. This will fall another 5% by year end 2021.
JOBS DATA updated 7-2-21
Construction Jobs for June (May16 thru June12) are down slightly (-7,000) from May. May was revised down slightly (-6k) and April (-4k) revised down slightly. Jobs are now down 3 consecutive months. Comparing jobs year-over-year is strongly skewed by the rapid declines then rapid growth in 2020. Year-to-date thru June construction is up only 10,000 jobs. Jobs are down 238K (-3.1%) from Feb 2020 peak. But also, hours worked dropped -1.3%, equivalent to another 100,000 jobs. Expect this downward trend to accelerate into year end.
Construction spending minus inflation (Volume) supports jobs. All of the increase in construction spending this year is INFLATION. There is no meaningful increase in construction volume to support jobs growth.
Construction spending is on track to increase 3.8% in 2021 over 2020. But after taking out average 6% inflation, spending minus inflation in 2021 will be DOWN 2%. Residential spending increases $103 billion (+16%), but after 8% inflation residential volume increases only $47 billion. All nonresidential spending decreases $47 billion but after adjusting for 4% inflation real nonresidential volume is down $77 billion. Total construction volume (spending minus inflation) is expected to decline 5% from May to Dec. Construction Jobs are expected to follow suit.
Although residential jobs are currently increasing, nonresidential jobs will continue to fall, dropping another 4% over the next 12 months. This time next year construction could be down another 200,000 jobs.

Speaking Engagement – Advancing Preconstruction 2021
Join us August 30 – September 1 in Dallas TX
I will be presenting to the plenary session on Main Conference Day 1, Tuesday August 31 on the following:
The State of Construction Post-Pandemic: Revealing Trends in Demand, Supply & Cost Escalation
• Revealing the economic reality and outlook in terms of construction volume and its impact on jobs and prices
• Identifying key metrics and data sources that will give you a reliable indication of inflation for your market
• Determining the likely impact of an Infrastructure Bill and other major construction investments on market forces
The 6th annual Advancing Preconstruction 2021 conference is North America’s largest gathering of contractors, design firms and clients looking to improve coordination of the design phase. You’ll hear how to align cost, schedule and project specifications to set projects up for success.
From conceptual estimating and winning work to constructability reviews and model-based quantity take-off, you’ll discover the latest technologies and workflows across five educational tracks.
New additions for 2021 include:
- Post-pandemic outlooks with a focus on cost escalation for major markets and bidding strategies
- Deep dives into estimating for specific CSI divisions including earthwork, steel, mechanical and electrical
- Benchmarking ways to conduct design reviews and maintain quality of coordination, including with remote working
- How direct material procurement, prefabrication, IPD and other trends could radically alter preconstruction and reduce costs
- https://advancing-preconstruction.com/

Nonres Bldgs Recovery to Pre-Pandemic? When?
5-10-21
Economists should be talking about this. While residential starts and spending are at all-time highs, nonresidential buildings starts have been down for months and spending is still declining.
Since Apr 2020 and now through March 2021, Nonresidential Bldgs construction starts, for 12 months, have averaged down 25%+ compared to Q1 2020. Recent Q1 2021 is still down 22% from Q1 2020.
A full year of nonres bldgs starts generates over $400 billion in spending. With starts down 25% for the past 12 months, that’s a loss of over $100 billion in spending that would have occurred over the next 1 to 3 years.
Spending follows as starts move, only later, so spending will fall.
Actual nonresidential buildings construction spending has been down 10 of the last 12 months. Now in Mar 2021 it is at its low point, 9% lower than Q1 2020. The forecast for the remainder of 2021 is down near 1%/month.
A simple model built to show when starts have maximum impact on spending indicates by Dec 2020 Nonres Bldgs construction spending put-in-place would be 10% lower than Q1 2020. Spending was actually 9% below Q1 2020. So the model seems to be on track.
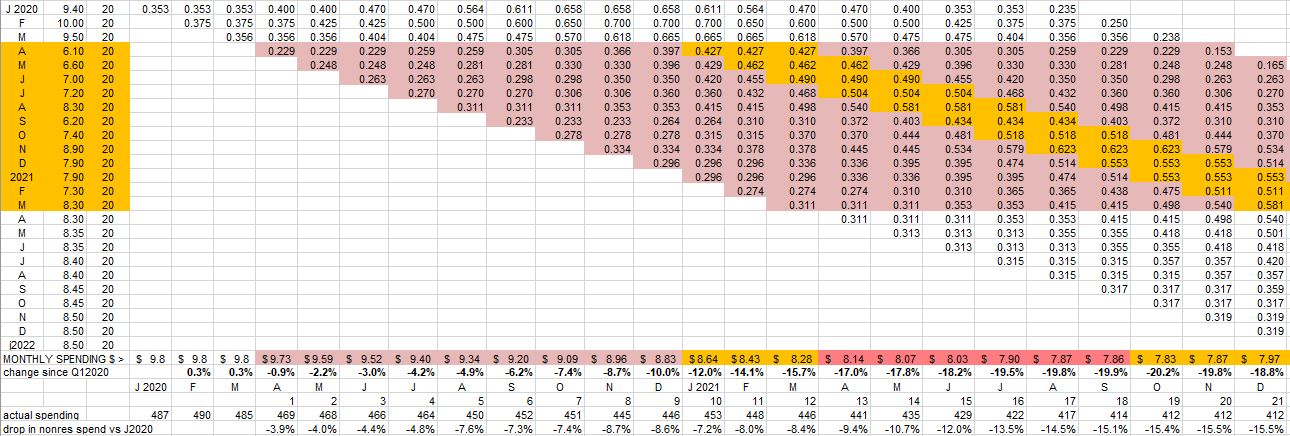
This table sets Feb 2020 starts to a baseline of 10.0. All other starts afterwards are entered at the percentage of actual $ starts that month compared to Feb 2020, so 8.30 in March of 2021 represents starts for Mar 2021 were 83% of Feb 2020. A lost start is negative spending. So, instead of thinking of the peak month of spending, that becomes the month of greatest loss. Those months near the middle of the schedule, are highlighted here.
Dodge is forecasting new construction starts for nonres bldgs will increase ~4% in 2021 and ~10% in 2022. That means starts in 2021 will still be 20% lower than Q1 2020 and starts in 2022 will still be 12% lower. This has major implications.
Even at 10%/yr growth in new starts in 2022, 2023 and 2024, Nonres Bldgs Starts would not return to pre-pandemic level until mid 2024. If starts remain lower than Feb 2020 through 2023, then spending will remain lower than Feb 2020 through 2024.
That model, that’s on track so far, shows maximum impact from reduced 2020 starts will occur in Q2-Q3 2021. But what about 2021 starts? Negative impact continues longer than the # of months starts remain lower than Q1 2020. We now have 12 months of starts still averaging 22% below Q1 2020, so even when we begin to improve, we are measuring from a new base 22% down. For each lower month the greatest negative impact in spending is 10-12 months later. That loss of spending is shown in the following chart for Nonres Bldgs Spending.
By the end of 2021, Nonres Bldgs construction spending put-in-place is forecast to be almost 20% lower than Q1 2020. If the Dodge forecast of 4% growth in starts for 2021 is correct, then, even though 2021 had growth, it’s off the bottom, and 21 months of starts will have averaged down 22% from Q1 2020.
Nonresidential Bldgs construction spending follows as starts go. If starts are down, future spending will be down.
Nonresidential Buildings spending $ put-in-place will not return to pre-pandemic levels before 2024 or 2025.
2021 Construction Economic Forecast – Summary
Initial Construction Outlook 2021, 2-5-21, based on data from:
- Actual Jobs data includes BLS Jobs to Jan 16th, issued 2-5-21
- Forecast includes US Census Dec 2020 year-to-date spending as of 2-1-21
- Forecast includes Dodge Outlook 2021 and Dec construction starts 1-19-21
SUMMARY – CONCLUSIONS
Construction Spending drives the headlines. Construction Volume drives jobs demand. Volume is spending minus inflation. Current outlook shows the most recent peak volume was 2017-2018. Total Volume is forecast to decline every year out to 2023, but Residential is rising, Nonresidential is falling.
When spending increases less than the rate of inflation, the real work volume is declining. Nonresidential buildings spending for 2020 is down -2%, but with 3% to 5% inflation, volume is down 5% to 7%. The extent of volume declines would impact the jobs situation.
STARTS – BACKLOG – SPENDING
By far the greatest impact of the pandemic on construction is the massive reduction in new nonresidential construction starts in 2020 that will reduce spending and jobs in that sector for at least the next two years. Residential continues to increase.
- 2020 new starts declined -8%. Res +7%, Nonres Bldgs -24%, Nonbuilding -14%.
- New starts for residential reached an all-time high in 2020. Expect up +5% in 2021.
Nonresidential construction starts in backlog at the beginning of the year provide for 75% to 80% of all spending in 2021. New starts in 2020 were down 24% for buildings and 14% for non-buildings, so backlog is down. It would be difficult to show any scenario that has these sectors up in 2021.
Construction has yet to experience the greatest downward pressure from the pandemic. After hitting a post-pandemic spending high in December, spending and jobs losses won’t hit bottom until 2022. Nonresidential declines outweigh Residential gains.
- Spending forecast for 2021 is up +1.4%, but nonresidential buildings is down -11%.
- Almost all gains in spending are due to large 12%/yr gain in residential.
The largest declines in 2021 spending are Lodging -37%, Amusement/Recreation -26%, Manufacturing -19% and Power -15%.
PROJECT COST ESCALATION – INFLATION
- Inflation for nonresidential buildings near 4% the next few years. Residential 5% to 6%.
VOLUME – JOBS
Construction Jobs annual average for 2020 is down 220,000 jobs. The current spending forecast is indicating that December 2020 was the highpoint for jobs. Residential jobs will be up in 2021, but Nonresidential Buildings jobs are down steep. Net jobs will be down 15 of next 18 months. Forecast 2021 net annual average jobs losses of -200,000. Nonresidential Buildings 2021 jobs losses will outweigh residential gains.
Selected slides from Feb 2021 Construction Outlook Presentation
EdZ Econ Feb 2021 SAMPLE SLIDES PDF
Read More 2021 Construction Economic Forecast

2021 Construction Economic Forecast
Initial Construction Outlook 2021, 2-5-21, based on data from:
- Actual Jobs data includes BLS Jobs to Jan 16th, issued 2-5-21
- Forecast includes US Census Dec 2020 year-to-date total spending as of 2-1-21
- Forecast includes Dodge Outlook 2021 and Dec construction starts 1-19-21
This analysis utilizes Dodge Data & Analytics construction starts data to generate spending cash flow to then determine how spending may affect future construction activity.
When spending increases less than the rate of inflation, real work volume is declining. In 2020, nonresidential buildings spending is down -2%, but with 3% inflation, volume declined 5%. The extent of volume declines negatively impacts the jobs situation. A 5% decline in Nonresidential Buildings volume impacts $22 billion worth of work and more than 100,000 jobs. In 2021, spending is forecast down 11%, volume down 14%.
2021 Residential spending will climb about 13%, up $80 billion to $695 billion. Nonresidential Buildings spending is forecast to drop -11% to $410 billion, a decline of $50 billion. Non-building spending drops -2% to $343 billion, a decline of only $8 billion.
By far the greatest impact of the pandemic on construction is the massive reduction in new nonresidential construction starts in 2020 that will reduce construction spending and jobs for at least the next two years. Although nonresidential buildings spending is down only -2% for 2020, the 15% to 25% drop in 2020 new construction starts will mostly be noticed in lower 2021 spending.
New Construction Starts
Total construction starts for 2020 ended down -8%, but Nonresidential Buildings starts finished down -24% and Non-building Infrastructure starts are down -14%.
Residential starts finished the year up +7% from 2019.
Most nonresidential buildings markets and residential new starts are forecast to increase 5% in 2021. Nonbuilding starts will increase 10% in 2021.
In the Great Recession, beginning in Q4 2008, nonresidential buildings new construction starts fell 5%, then fell 31% in 2009 and 4% in 2010. Spending began to drop by Dec 2008, then dropped steadily for the next 24 months. Spending dropped 40% over that next two years. During that period, residential starts and spending fell 70%.
In 2020, nonresidential buildings starts fell 24%, but the six months from Apr-Sep, starts fell 33%. Starts are forecast to fall 4% in 2021. Nonres Bldgs spending began to decline in Aug, is now down 10% from Feb high and is forecast to drop steadily the next 20 months, for a total decline of 25%. This time around residential starts and spending are increasing.
Over the final 5 months of 2020, new Residential construction starts posted 4 of the 5 highest monthly totals since 2004-2006. Residential new starts finished 2020 at a 15-year high, with almost 50% of new activity for the year posting in the final 5 months, which will put a lot of that spending into 2021. Total 2020 residential starts are up 7%, but the average for the last 5 months is up 10% from the same period 2019. There is a large portion of 2021 spending from that last 5 months of starts, that will be up 10%.
Nonresidential Buildings new construction starts in 2020 averaged down 24%: Manufacturing -57%, Lodging -46%, Amusement/Recreation -45%, Education -12%, Healthcare -7%. Most of the spending from those lost starts would have taken place in 2021, now showing up as a major decline in spending and work volume.
Manufacturing starts in 2020 fell 57%. Manufacturing projects can have a moderately long average duration, because some projects are 4-5 years. So, projects that fell out of the business plan starting gate in 2020 caused a drop in starting backlog of -32% for 2021 and -33% for 2022. It should not be hard to see how that leads to a huge decline in construction spending the next two years. The same thing happened with Amusement/Recreation and Lodging, although lodging tends to have shorter duration, so affects mostly 2021.
Commercial/Retail starts in 2020 dropped 16%. But this group includes warehouses which finished the year up +1% and warehouses is 60% of the total market. All other Commercial/Retail ended 2020 down 35%.
Non-building Infrastructure new construction starts in 2020 averaged down -13%. Power -37%, Transportation -22%. Highway (along with residential) was the only market to gain new starts in 2020, +8%.
Power new starts fell 37% in 2020, but Power backlog has not increased since 2018. Even though Power new starts in 2021 are forecast to increase 13%, that’s not enough to push spending to positive.
Transportation starts declined -22% in 2020. But Transportation backlog increased 50% over the last three years. There is a large volume of Transportation projects currently in backlog, and although backlog does drop slightly for 2021, spending is supported by the large volume of starting backlog and a forecast for increased new starts in 2021.
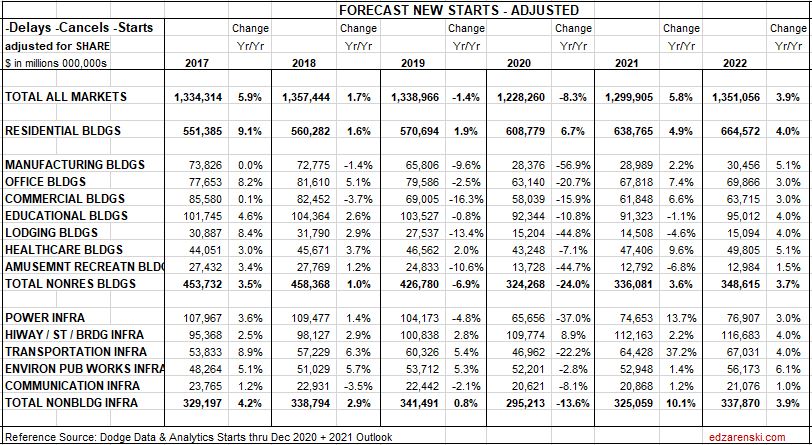
The following NEW STARTS table shows, for each market, the current forecast for new construction starts. With exception of residential, spending in all other markets, due to longer schedules, is most affected by a decline in new starts, not in the year of the start, but in years following. As we begin 2021, some effects of reduced starts have not even begun to show up in the data. A 24% decline in new nonresidential starts in 2020 results in a huge decline in spending and jobs in 2021-2022.
Almost every nonresidential construction market has a weaker spending outlook in 2021 than in 2020, because approximately 50% of spending in 2021 is generated from 2020 starts, and 2020 nonresidential starts are down 24%, with several markets down 40%. Starts lead to spending, but that spending is spread out over time. An average spending curve for nonresidential buildings is 20:50:30 over three years. Only about 20% of new starts gets spent in the year they started. 50% gets spent in the next year. The effect of new starts does not show up immediately. If new nonresidential buildings starts in 2020 are down 24%, the affect that has in 2020 is to reduce spending by -24% x 20% = – 4.8%. The affect it has in 2021 is -24% x 50% = -12%. In 2022-2023 the affect is -24% x 30% = -7.2%.

Starting Backlog
Starting backlog is the estimate to complete (in this analysis taken at Jan 1) for all projects currently under contract. The last time starting backlog decreased was 2011.
Backlog leading into 2020 was at all-time high, up 30% in the last 4 years. Prior to the pandemic, 2020 starting backlog was forecast UP +5.5%. Due to delays and cancelations, that has been reduced to +1.8%, still an all-time high. Starting Backlog, from 2011-2019, increased at an avg. rate of 7%/year.
If new construction starts are greater than construction spending in the year, then for the following year starting backlog increases. It’s when new starts don’t replenish the amount of spending in the year that backlog declines. And that is the case this year.
Total starting backlog is down -10% for 2021 and -5% for 2022. 2021 Starting Backlog is back to the level in 2018. In 2022, backlog drops to the level of 2017.
Nonresidential Buildings new starts declined by -24% in 2020 resulting in starting backlog drops -19% for 2021 and drops -9% for 2022.
For Non-building Infrastructure, a drop of -14% in 2020 starts results in a drop of 9% in 2021 starting backlog and -5% for 2022.
Residential starting backlog for 2021 is up +12%. New starts are up 6%.
2021 backlog declines in every nonresidential market, except Highway.
80% of all nonresidential spending in any given year is from backlog and could be supported by projects that started last year or 3 to 4 years ago. Residential spending is far more dependent on new starts than backlog. Only about 30% of residential spending comes from backlog and 70% from new starts.
Projects in starting backlog could have started last month or last year or several years ago. Many projects in backlog extend out several years in the schedule to support future spending. Current backlog could still contribute some spending for the next 6 years until all the projects in backlog are completed.
Reductions in starts and starting backlog lead to lower spending. Residential construction is going counter to the trend and will post positive results for new starts, backlog and spending for the next two years. Nonresidential buildings will experience the greatest reductions in new starts, backlog and spending through 2022.
Spending Forecast 2021
2021 Residential spending will climb about 13%, up $80 billion to $695 billion. Nonresidential Buildings spending is forecast to drop -11% to $410 billion, a decline of $50 billion. Non-building spending drops -2% to $343 billion, a decline of only $8 billion.
Most all the change in this forecast from previous is an increase to residential spending. Both recent starts and spending increased substantially since previous forecasts. When looking at Total Construction Spending for 2021, residential growth obscures the huge declines in nonresidential.
The monthly rate of spending for residential increased 33% in the 7 months from May to December. The last time we had growth like that was 1983. The last time we had rapid growth in residential work, 2013-2014 and 2004-2005, it took 2 years to increase 33%. Residential spending in Dec 2020 is 21% higher than Dec 2019.
Nonresidential Buildings spending drops -2% to -3% each quarter in 2021. Nonresidential Buildings spending as of Dec. 2020 is down 10% From Feb. 2020 and 8% from Q4 2019. By 3rd quarter 2021, nonresidential buildings spending is forecast down another 12% lower than Dec. 2020, or 20% below the Feb. 2020 peak. This tracks closely with the 24% decline in new construction starts in 2020.

Nonresidential Buildings construction will take several years to return to pre-pandemic levels. Although nonresidential buildings spending is down only -2% for 2020, the 15%-25% drop in 2020 construction starts will mostly be noticed in lower 2021 spending. Project starts that were canceled, dropping out of new backlog between April and September 2020, would have had midpoints, or peak spending, March to October 2021. Nonbuilding project midpoints could be even later. The impact of reduced new starts in 2020 is reduced spending and jobs in 2021 and 2022.
Almost every market has a weaker spending outlook in 2021 than in 2020, because of lower starts in 2020. Starts lead to spending, but on a curve. A good average for nonresidential buildings is 20:50:30 over three years. 20% of the total of all starts in 2020 gets spent in 2020 (yr1) and that represents also about 20% of all spending. 50% of the total value of 2020 starts gets spent in the following year, 2021. So, 50% of spending in 2021 is generated from 2020 starts. If starts are down 20% and 50% of spending comes from those starts, spending will be down 20% x 50% of the work.
For 2020, the biggest declines are Lodging (-14%), Manufacturing (-10%) and Amuse/Recreation (-7%). Commercial/Retail finishes up +4.2%, but this is entirely due to Warehouse, 60% of the total Commercial/Retail market. Office and Educational are down -4% and -1%. Nonresidential buildings takes the brunt of declines in both 2020 and 2021.
In 2021, every nonresidential building market is down from 2020, some markets down -10% to -20%. Educational, Healthcare and Office are all down -3% to -6%. Non-building infrastructure Power market is down -15%, but Transportation spending is up +10% due to strength in backlog from several multi-billion$ starts over the past few years.
Manufacturing projects have a moderately long duration. So, projects that fell out of the business plan caused a drop in starting backlog of -32% for 2021 and -33% for 2021. It should not be hard to see how that leads to a huge decline in construction spending the next two years. The same thing happened with Amusement/Recreation and Lodging, although lodging tends to have shorter duration, so affects mostly 2021.
A recent AGC survey of construction firms asked, how long do you think it will be before you recover back to pre-COVID-19 (levels of work)? The survey offered “longer than 6 months” as an answer choice. Less than 6 months was the right answer for residential, but my current forecast for full recovery of nonresidential buildings work is longer than 6 years.
Construction Spending drives the headlines. Construction Volume drives jobs demand. Volume is spending minus inflation. Inflation $ do not support jobs. Current outlook shows (recent) peak volume was 2017-2018. Volume is forecast to decline every year out to 2023.
Before we can look at the effect on jobs, we need to adjust spending for inflation. The plot above “Spending by Sector” is current dollars. Below that plot is adjusted for inflation and is presented in constant $. Constant $ show volume. Notice future residential remains in a narrow range after adjusting for inflation. No sector shows improvement in volume through Jan. 2023.
When we see spending increasing at less than the rate of inflation, the real work volume is declining. For example, with construction inflation at 3% annually, a nonresidential buildings spending decline of -2.1% in 2020 would reflect a work volume decline of 5.1%. The extent of volume declines would impact the jobs situation.
While 2021 Residential spending will climb about 13%, Nonresidential building spending is forecast to drop -11% and Non-building spending drops -2%.
But with 4% inflation, after inflation Residential Volume is up only 9%, Nonresidential Building is down 15% and Non-building is down 6%.
By far the greatest decline in volume is in the nonresidential buildings sector. The greatest losses in 2020 are Lodging, Manufacturing, Amusement/Recreation and Commercial/Retail (without warehouse). In 2021, every major nonresidential building market drops in volume, with staggering 30% declines in Lodging and Amusement/Recreation. Commercial/Retail and Manufacturing will drop -13% to -15%.
Here’s the same graphic as above, but in Constant $, so it’s inflation adjusted. That provides the change in volume of work.
Volume of Work
Residential construction volume dropped 12% from the January 2020 peak to the May bottom, but has since recovered 22% and now stands at a post Great Recession high, 10% above one year ago. Although residential spending remains near this high level for the next year, volume after inflation begins to drop by midyear.
Nonresidential volume has been slowly declining and is now down 10% from one year ago. By 3rd quarter 2021, nonresidential buildings volume is forecast down another 15% lower than December, or 25% below the Feb 2020 peak. This tracks right in line with the 24% decline in new construction starts in 2020. Most of the spending from those lost starts would have taken place in 2021, now showing up as a major decline in spending and work volume.

While construction spending in 2021 is forecast up 1.3%, after inflation construction volume is expected to decline 2.5%. Residential construction spending is forecast up 13%, volume up almost 9%, but 2021 nonresidential buildings spending is forecast down -11% leading to a decline in volume after inflation of -14%. Nonbuilding Infrastructure spending in 2021 declines -2.5%, volume drops -6%.
Nonresidential buildings volume declines of 14% project to a loss of over 400,000 jobs next year and non-building infrastructure is projected to drop 60,000 jobs, but Residential could experience growth next year of 250,000 jobs. That could net annual average jobs losses to -200,000. Job losses continue into 2022 with net volume declines of 4%.
Jobs are supported by growth in construction volume, spending minus inflation. We will not see construction volume return to Feb 2020 level at any time in the next three years. This time next year, volume will be 5% lower than today, 10% below the Feb 2020 level.
Download the complete 2021 Initial Forecast here
Along with this forecast document, See these related articles
2021 Construction Economic Forecast – Summary
Measuring Forecasting Methodology & Accuracy
Public/Private Construction Spending Forecast 2020-2021

Construction Jobs in 2020 down 220,000
edited 3-5-21 to include 2020 revised jobs and 2021 revised outlook.
Construction closes 2020 down 157,000 jobs comparing Dec 2020 to Dec 2019. Average jobs lost over the year is down 220,000, down 2.9%. Also, average hours worked in 2020 is down. The equivalent jobs lost over the year (jobs x hours worked) is down 3.8% or a loss of 281,000 jobs equivalent.
While construction spending in 2021 is forecast up 1.3%, after inflation construction volume is expected to decline 2.5%. Residential construction spending is forecast up 13%, volume up almost 9%, but 2021 nonresidential buildings spending is forecast down -11% leading to a decline in volume after inflation of -14%. Nonbuilding Infrastructure spending in 2021 declines -2.5%, volume drops -6%.
Nonresidential buildings volume declines of 14% project to a loss of over 400,000 jobs next year and non-building infrastructure is projected to drop 60,000 jobs, but Residential could experience growth next year of 250,000 jobs. That could net annual average jobs losses to -200,000. Job losses continue into 2022 with net volume declines of 4%.
It is notable though, even with residential spending and volume increasing, due to large losses in nonresidential buildings, total construction volume declines every month for the next 9 months. Nonresidential buildings volume declines for the next 18 consecutive months.
There is an unusual occurrence in the data for 2021. Annual average jobs in 2021 may decline in total by only 100,000, but from Dec. 2020 to Dec. 2021, jobs decline may be nearer to 400,000. The annual average change is much less due to the massive decline in jobs in April 2020, which by itself caused the 2020 average to drop by almost 100,000. Most months in 2021 will show jobs about 3% to 4% or more below the same month in 2020, except for April, which will show 2021 jobs 10% higher than 2020.
Some who read this post will question how I forecast such a drop in nonresidential work, when some other analysts predict far less declines and even some who predict nonresidential work increases in 2021. It will be very difficult for anyone to support a forecast for increased spending in 2021 given a 22% drop in new construction starts in 2020 for nonresidential buildings work, most of which would have occurred in 2021.
https://www.bls.gov/web/empsit/ceseeb1a.htm


Public/Private Construction Spending Forecast 2020-2021
12-18-20
Public Starts and Backlog
Leading into 2020, the Public markets with the highest growth in new starts the previous two years were Transportation and Public Works. Transportation terminals and rail starts were up 15% over two years, 25% in the last three years. Backlog nearly doubled in three years because a large portion of those starts is very long duration projects. Public works starts were up 13%, 20% in three years, and backlog is up 40%. Infrastructure projects typically have the longest duration. Projects contribute spending sometimes up to 5 or 6 years.
Public work backlog leading into 2020 was up an average 8%/year for the last three years. Some of this is very long-term work that started construction in 2017 and it will still contribute spending for the next several years. 40% of all public spending in 2020 comes from projects that started prior to Jan 2019.
2020 losses in new construction starts impact the forecast for the next few years. Total new starts in 2020 for Public work dropped 9%. Transportation starts fell 20%, Educational starts fell 11% and Public works fell 6%. Amusement/Recreation starts fell 40%. Highway/Bridge starts increased 4%.
2021 Starting Backlog for all Public work is down 5%. Backlog for Transportation projects drops only 4%, and that leaves 2021 still 2nd only to the all-time high in 2020. Both Educational and Public Works backlogs drop 7%. Amusement/Recreation backlog falls 40%. Highway backlog increases 3%. Of all public work in backlog at the start of 2021, 43% comes from projects that started prior to Jan 2020.
Public Spending
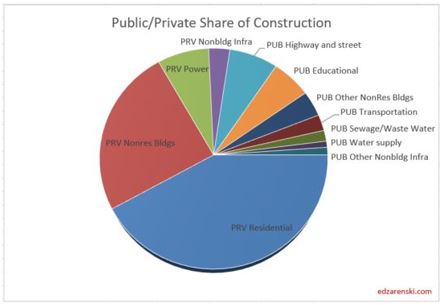
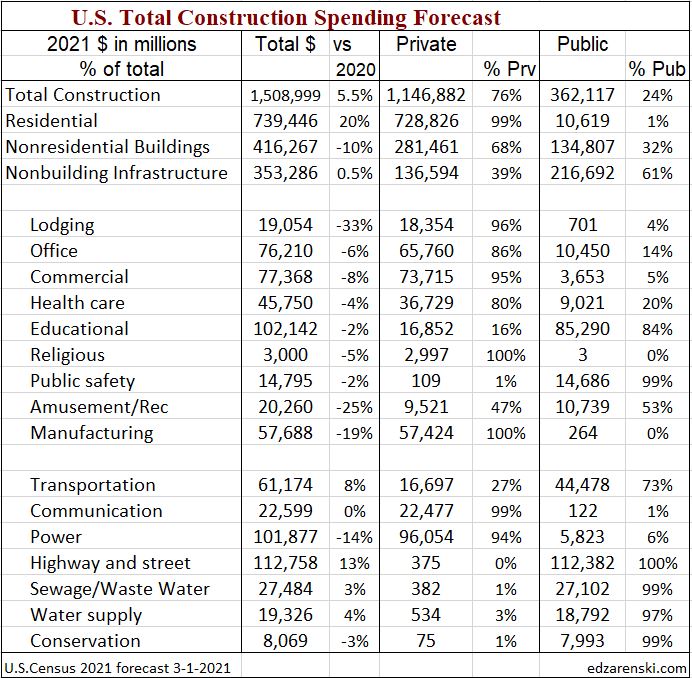
The two largest markets contributing to public spending are Highway/Bridge (30% of total public spending) and Educational (25%), together accounting for 55% of all public construction spending. At #3, Transportation is only 12% of public spending. Environmental Public Works combined makes up 15% of public spending, but that consists of three markets, Sewage/Wastewater, Water Supply and Conservation. Office, Healthcare, Public Safety and Amusement/Recreation account for about 3% to 4% each.
Highway is 100% public and Public Works 98%. Educational is 80% public, Transportation 70%, Amusement/Rec 50% and Healthcare 20%.
Total public spending for 2020 is projected to finished up 5% at $350 billion. Spending for every major public market is projected to finish up in 2020. By far, the largest Public spending increases measured in dollars for 2020 are Educational, Transportation and Public Safety.
Total public spending in 2021 is projected to finished up 5% at $370 billion. Transportation provides most of the gains in 2021 and Public Works adds some, but this forecast may come down without support from Highway or Educational.

Public Infrastructure and Public Institutional
A bit less than 60% of all Non-building Infrastructure spending, $198 billion in 2020, is publicly funded. That public subset of work has averaged growth of $5 billion/year from 2013 through 2019, with maximum growth of $16 billion in 2019. 2020 increased only $4 billion. In 2020, Non-Building Infrastructure spending makes up about 60% of Public spending.
About 30% of all Nonresidential Buildings spending, $141 billion in 2020, is publicly funded. It’s mostly Educational. That public subset of work has averaged growth of $6 billion/year from 2013 through 2019, with maximum growth of $10 billion in 2017. 2020 increased $14 billion. In 2020, Nonresidential Buildings spending makes up about 40% of Public spending.
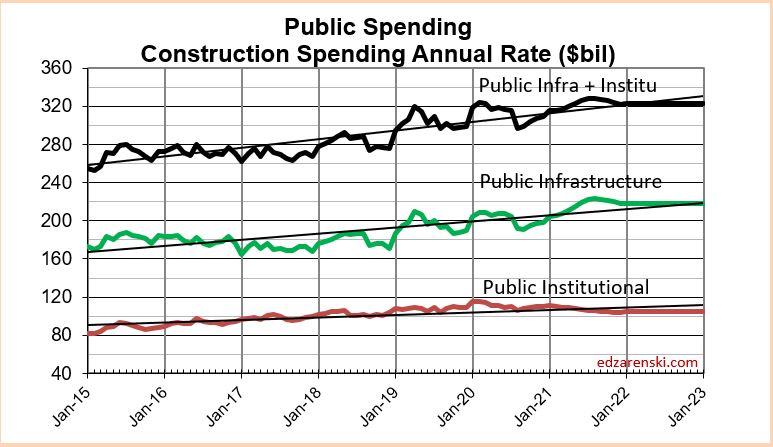
- Infrastructure = $349 billion, ~25% of all construction spending.
- Infrastructure is about 57% public, 43% private. In 2005 it was 70% public.
- Public Infrastructure = $198 billion. Private Infrastructure = $150 billion.
- Power and Communications are mostly privately funded infrastructure.
- Nonresidential Buildings is 30% public (mostly institutional), 70% private.
- Educational, Healthcare and Public Safety are Public Nonres Institutional Bldgs
- Public Commercial construction and Amusement/Rec. are not included.
- Public Institutional = $110 billion, mostly Education ($86b).
Public Infrastructure + Public Institutional = $308 billion, 22% of total spending.
Public Infrastructure + Institutional average growth is $12 billion/year. This subset has never exceeded $30 billion in growth in a single year. In 2019 spending increased $20 billion. With 10 months data posted, 2020 is forecast to increase $17 billion.
Although total all public spending may increase for 2021, the select group of Infrastructure + Institutional likely to be funded by an Infrastructure stimulus bill shows 2021 growth is uncertain and may remain flat.
See Also
Down the Infrastructure Rabbit Hole
