Construction Spending Actual through May 2021
Total Construction Spending is up 4.6% year-to-date (ytd) from the same five month period 2020. Residential is up 23.4%, Nonresidential Buildings is down -10.5% and Nonbuilding Infrastructure is down -5.8%.
This analysis includes spending revisions to 2019 (up $26bil, +1.9%) and 2020 (up up $37bil, +2,6%).
In the 1st 3 months of 2020, spending had reached an all-time high averaging a SAAR of $1,521 billion.
In the 1st 3 months of 2021, spending again hit a new all-time high averaging a SAAR of $1,544 billion. In May, spending is $1,545 billion.
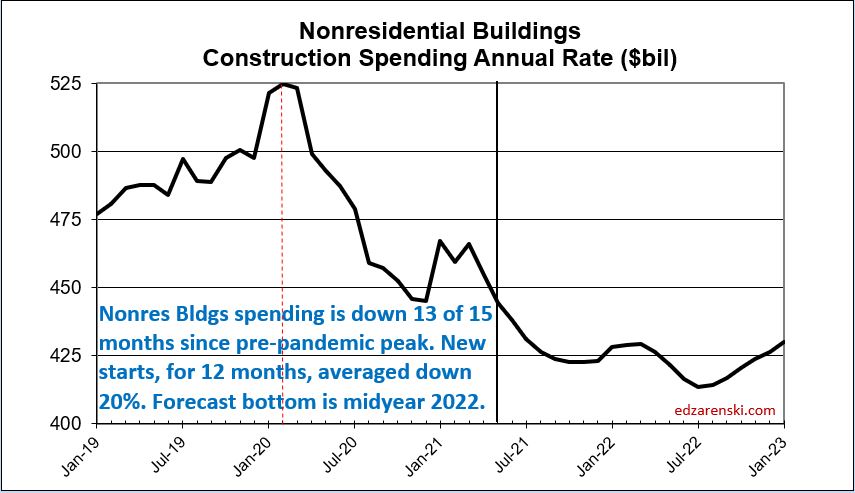
Year-to-date through May, while residential is up 23%+, 15 of 16 nonresidential markets, 98% of total nonresidential market value, are down a total of -8.6%. For the remainder of the year, the rate of nonresidential decline will slow to -4%.
Construction starts are leading the way to recovery, but construction spending, which is dependent mostly on starts from previous years (2020 down -22%), will remain depressed for nonresidential construction well into 2022. Recovery in backlog begins to build in a few markets in 2021. However, new nonresidential starts could double from the current rate of growth and it still wouldn’t be enough to turn 2021 nonresidential spending positive.
Aside from residential, recovery to the levels of revenue (spending) recorded in Q1 2020 won’t show up before 2024.
The following table shows ytd through May $ and forecast for 2021/2022. Almost every nonresidential market is down ytd and down compared to the average in Q1 2020 before Pandemic Recession.

The impact of reduced starts in 2020 is showing up in the 2021 year-to-date results. Total Nonres Bldgs starts were down 22% in 2020. Nonbldg Infrastructure starts were down 13%. Some of these markets will be affected by a downward trend in spending for two to three years.
2020 starts for select markets:
- Amusement -38%
- Commercial/Retail -14%
- Office -20%
- Lodging -50%
- Manufacturing -57%
- Power -38%
The greatest downward impact on spending will be felt in mid-2021. Over the next 9 months, every sector will post more down months than up months, although the declines will be most noticeable in nonresidential buildings.

For the next few months the residential year-to-date comparison will be skewed. It is going to increase due to the steep fall-off in spending back in April and May 2020. Then, months of strong growth, a total +38% in 7 months in residential from May 2020 onward, with no equivalent growth increase this year, will cause ytd comparisons to decrease. So, even though residential spending is not forecast to increase any more in 2021, residential spending will peak at +25% year-to-date in the May-June data (due to the steep decline in spending in 2020) before falling back to end at +16% ytd for year end.
While most markets recover to positive new starts growth in 2021, spending growth lags, showing the downward trend in 2021 as a result of lost starts in 2020.
This next plot changes the scale of the spending plot so the nonresidential buildings data can be visualized much easier. This is the exact same data as in the Construction Spending by Sector plot above. The scale change helps immensely to visualize the decline in nonresidential buildings spending. By midyear 2022, the annual rate of spending will be 20% lower than the pre-pandemic peak. It could take two to three years after that to recovery to the pre-pandemic level of spending.
A typical batch of new construction starts within a year gets spent over a cash flow schedule similar to 20/50/30, that is, 20% of all starts in the year gets spent in the year started, 50% in the next year and 30% in years following. Total nonresidential buildings starts in 2020 were down -22% ($100bil in spending) and nonbuilding was down -13% ($50bil). Under normal conditions, we know how much of that $150 bil would have occurred in 2020, 2021 and 2022. That’s a loss of spending this year, and that loss remains a steeply downward slope as long as starts remain depressed. Nonresidential buildings starts, down now for 12 months, posted some hint of recovery in April.
If new infrastructure bill starts don’t begin until the 2nd half of the year, only 25% to 30% (of the 1st year 20/50/30 that is based on 12mo) gets spent in the 1st year. Therefore, even if $100 billion in new infrastructure starts begin in the 2nd half 2021, only 30% x 20% or only about 6% would get spent in 2021. That’s $6 billion, or less than 1% of annual construction spending. So, there will be very little if any impact on 2021 construction spending as a result.
In constant $, spending adjusted for inflation, even though residential constant $ volume is up 13% from Q1 2020, current total $ volume of work is 5% lower than the peak average in Q1 2020. This will fall another 5% by year end 2021.
JOBS DATA updated 7-2-21
Construction Jobs for June (May16 thru June12) are down slightly (-7,000) from May. May was revised down slightly (-6k) and April (-4k) revised down slightly. Jobs are now down 3 consecutive months. Comparing jobs year-over-year is strongly skewed by the rapid declines then rapid growth in 2020. Year-to-date thru June construction is up only 10,000 jobs. Jobs are down 238K (-3.1%) from Feb 2020 peak. But also, hours worked dropped -1.3%, equivalent to another 100,000 jobs. Expect this downward trend to accelerate into year end.
Construction spending minus inflation (Volume) supports jobs. All of the increase in construction spending this year is INFLATION. There is no meaningful increase in construction volume to support jobs growth.
Construction spending is on track to increase 3.8% in 2021 over 2020. But after taking out average 6% inflation, spending minus inflation in 2021 will be DOWN 2%. Residential spending increases $103 billion (+16%), but after 8% inflation residential volume increases only $47 billion. All nonresidential spending decreases $47 billion but after adjusting for 4% inflation real nonresidential volume is down $77 billion. Total construction volume (spending minus inflation) is expected to decline 5% from May to Dec. Construction Jobs are expected to follow suit.
Although residential jobs are currently increasing, nonresidential jobs will continue to fall, dropping another 4% over the next 12 months. This time next year construction could be down another 200,000 jobs.

