Home » Nonresidential Buildings (Page 2)
Category Archives: Nonresidential Buildings

Construction Spending June 2018
8-1-18
U. S. Census posted Construction Spending for June at a seasonally adjusted annual rate (SAAR) of $1,317 billion, down 1.1% from an upwardly revised May. Year-to-date, June spending is up 5.1% from 2017.
May was revised UP 1.7% from the 1st release posted 7-2-18. April was revised UP 0.8%.
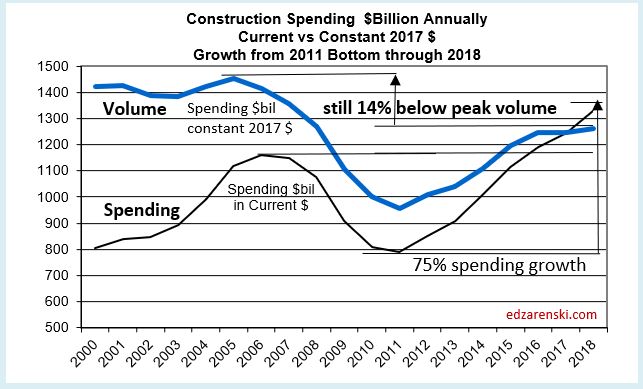
Construction Spending for the 1st half 2018, in Current $, averages $1,307 billion. This is an all-time high, well above the pre-recession high spending of $1,205 billion posted in the 1st quarter of 2006. Spending has been above the 2006 high since the 4th quarter 2016. Spending total is expected to average $1,330 billion for 2018.
Constant $ shows volume reached peak during the 2nd half 2005 and 1st half 2006, with 2005 posting the peak year. 2018 constant $ inflation adjusted spending is still 14% below the 2005-2006 peak.
Total spending year to date through June is $620 billion. Historically, only 47% of annual spending occurs in the 1st 6 months. Jan, Feb and Mar are the weakest months of the year, while Jul, Aug and Sep are the strongest spending months. Therefore, this indicates a 2018 total annual spending of $1,328 billion. This agrees very close to my total 2018 spending forecast.
The headline from the St Louis Fed > Total construction spending fell 1.1% in June, the largest monthly drop in more than a year. Just remember, spending subsequently gets revised 3x and final vs 1st release has been revised UP 79 times in the last 84 months.
Top performing construction spending markets 2018 year-to-date through June are Transportation +14.3%, Public Safety +12.1%, Lodging +10.7%, Water Supply +9.7%, Sewage and Waste Disposal +9.2%, Residential +8.1% and Office 6.8%.
The only markets down year-to-date are Religious -9.1%, Manufacturing -8.7% and Power -0.4%. Religious building as a percent of total is so small (1/4 of 1%) it has negligible effect on total annual performance. However, Manufacturing and Power make up about 15% of total construction.
Residential, Office, Commercial/Retail, Lodging, Highway and Environmental Public Works (Sewage, Water, Conservation) are all ahead of expectations for the 1st half of 2018.
June construction spending data shows an unusual $9 billion (SAAR) monthly decline (-9.3%) in Educational spending. This is several billion greater than the largest decline reported during the recession, so this looks like an anomaly in the data. There has never been a monthly decline like this in the Educational market since I’ve been tracking data, back to 2001. It is double the largest non-recession decline. I expect it will be revised up substantially at some point in the future.
Transportation is another market that appears to be unusually low for June. Because the monthly variance is not wildly out of balance it passes in obscurity. But here’s what we should see. Transportation (terminals and rail) new starts in 2016 increased 34% and then in 2017 increased 120%. Most of those projects will be completed in 3 years or less, but a number of the huge projects (no less than 15 projects ranging from $1 billion to $4 billion each) have a duration of 4 to 8 years. Even with long duration cash flow spreading out the spending for all those big projects, my analysis still predicts Transportation spending up 30% in 2018. Year-to-date through June, Transportation spending is up only 14%. I’ve forecast it should be up 18%. That’s a total shortfall of about $1 billion (SAAR ~$12 billion), or about 7%/month, for 3 months. April, May and June spending are all below expectations. I expect future revisions will increase current values. Also, we will see a big jump in year-to-date over the next three months since we are currently at an SAAR above $50 billion (and increasing) and Jul-Aug-Sep were the three lowest months in 2017, below $43 billion. Also, 2017 values were revised up 4%/month after the close of the year.
Manufacturing spending as of June is reported down 8.7% year-to-date from 2017. That decline will slowly turn positive in the second half of the year to finish up 2%. Spending is currently at an SAAR above $65 billion and expected to increase through December. In 2017, spending started the year above $70 billion but decreased to $60 billion by year end. Increasing values in the 2nd half 2018 compared to decreasing values in 2017 will continually increase the year-to-date performance in the 2nd half of 2018.
Power, similar to manufacturing, posted the highest spending for 2017 early in the year, then declined. In 2018, the 1st half posted the lowest spending, so the year-to-date is currently low. Increased spending in the 2nd half 2018, compared to the lowest values of the year in 2017, will boost year-to-date spending every month through year end. Although year-to-date spending through June is down 0.4%, the total for the year could finish up 9%.
Manufacturing and Power highlight one of the biggest shortfalls of judging expected performance based on year-to-date change. It is important to look at the trend line expected in the current year versus the trend line in the previous year. If they diverge, then year-to-date change will not give a clear indication of expected performance in the current year.
Total spending has increased from an average of $1,254 billion in Q4’17 to $1,292 billion in Q1’18 to $1,321 billion in Q2’18, growth of 3.0% and 2.25% the last two quarters. I’m expecting the rate of monthly spending will be above $1,360 billion by year end. The total spending forecast for 2018 is $1,330 billion.
Residential single family spending is up 9% YTD. Multifamily is down ~1%. Total residential spending is forecast to reach $566 billion in 2018, growth of 6.4% over 2017.
Nonresidential Buildings spending YTD totals $207 billion, up only 1.9% from 2017. It is being held down by Manufacturing which is currently down 8.7% from 2017. Also, the anomaly in Educational spending, explained above, contributes to the current low performance. 2018 forecast is $445 billion, 6.2% growth over 2017, with best growth in Lodging 13%, Office 11% and Amusement/Recreation 9%.
Non-building Infrastructure will post the best year of growth since 2014 to reach a new all-time high at $319 billion. Transportation, by far, will show the best growth, nearly 30% above 2017.

June Construction Starts Reach New Highs 7-25-18

2018 Construction Spending Forecast – Nonresidential Bldgs
3-28-18 Detail of Nonresidential Buildings construction starts, backlog and spending 2017-2018
2018 Construction Spending Forecast – Nonresidential Buildings
1st, we’ll start with a quick summary of 2017 results.
2017 Wrap Up – Spending, Starts and Backlog
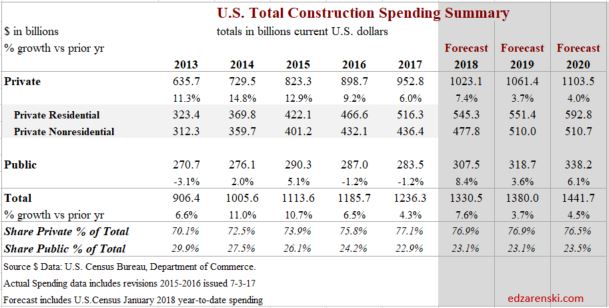
TOTAL construction spending in 2017 reached $1.236 trillion, an increase of 4.3% over 2016.
Total spending is up 57% from the 2011 low point and is now 6% above the previous 2006 high.

Nonresidential Buildings spending in 2017 finished at $419 billion, up only 2.7% from 2016.
Nonresidential spending is up 47% from the 2011 low point but is still 4.5% below the 2008 high. By December 2017, the seasonally adjusted annual rate (SAAR) had reached $433 billion, near the all-time high, only 2% below the peak in 2008.
2017 spending finished below my forecast due to lower than expected performance in Educational and Office. Educational starts increased 6%+/year for the last three years, but spending increased only 4%/year the last two years. Office starts increased nearly 30% in 2016, but dropped 2% in 2017. Spending increased only 3% in 2017.
History shows total spending has been revised up 53 times in the last 60 months. I expect future revisions will smooth out spending in unusually low periods and increase total 2017 spending above this forecast. I suspect either big upward revisions to 2017 spending or large increases in backlog will boost 2018 spending in these two markets.
2017 New Starts
Dodge Data 2017 TOTAL construction starts increased only 2.6% from 2016. However, starts are always revised upward in the following year. I expect revisions will show 2017 starts increased by 6% to 7% over 2016. Revisions to date (to Jan & Feb 2017) have already increased the 2017 Total to 4.2% over 2016. Even if the Total reaches 6% growth over 2016, 2017 starts will still have posted the lowest growth since 2011.
Nonresidential Buildings starts, currently are up 9% for 2017, could finish up 14% after all revisions. Nonresidential Buildings new starts are up 55% in four years.
Although there was a 1% decline in 2015, starts averaged 12%/year growth for the last four years. The six months from Aug 2016 to Jan 2017 totaled the highest average starts since Jan-Jun 2008, also the year nonresidential buildings spending peaked. The six months Jul-Dec 2017 just surpassed both those previous peak highs. All of those new high starts will generate spending in 2018, so 2018 spending benefits from the two strongest six-month periods of starts on record.

- Previous year starts always later get revised upwards. Therefore, current year starts ytd growth is always understated. This analysis compensates for that.
- Nonres Buildings Starts increased at an average of 12%/year for the last 5 years.
- Nonres Buildings Starts are at all-time highs.
- New starts will generate record high 2018 starting backlog for every sector.
The pattern of nonresidential buildings construction starts for the last 30 months indicated spending increases in the 2nd half of 2017 and set up 2018 for the highest ever starting backlog and record spending. Spending started to show increases in November and is up 4% the last 3 months vs the previous 3 months.
2018 Starting Backlog
TOTAL All Construction starting backlog for 2018, currently at an all-time high, increased 30% in the last three years.
Starting Backlog is the Estimate-to-Complete (ETC) value of all projects under contract at the beginning of a period. Projects in starting backlog could have started last month or last year or several years ago.
- Nonresidential buildings 2018 starting backlog is up 12%.
- Starting Backlog is at an all-time high for nonresidential buildings.
- 80% of all Nonresidential spending within the year will be generated from projects in starting backlog.
Nonresidential Buildings 2018 starting backlog is the highest ever, up 12% from 2017, 8% over the previous high in 2009. This will increase as more revisions to 2017 are posted.
Nonresidential buildings 2018 starting backlog is 55% higher than at the start of 2014, the beginning of the current growth cycle. Spending is UP 38% through 2017. Starting backlog has increased for 5 years at an average 10%/year. Spending from starting backlog, up 10% in 2018, increased for 5 years at an average 9%/year. Nonres Buildings will reach a new high for spending in 2018.
Cash flow models of construction projects in backlog are indicating substantial acceleration in nonresidential spending over the next year. The share of spending within the current year from backlog is at an all-time high for nonresidential buildings.
2018 New Starts
Starts for 2018 are conservatively estimated at 3% growth. After revisions I expect that to increase to 6%. But 2018 starts generate only 20% of 2018 spending, so a difference of 3% in new starts would change 2018 spending by less than 1%.
Cash Flow
The following table shows predicted cash flow from backlog on record as of March 20, 2018 and predicted starts that will generate future backlog in 2018.

Duration for projects in backlog helps to better predict spending activity over time. Apply the expected duration to Starts data to produce a Forecast Cash Flow and that shows the expected pattern of spending. Since Starts data is a sampling of about 60% of all construction projects, and since starts get spent over an extended period of time, starts dollar values can’t be used to directly predict spending.
The rate of change in Starts Cash Flow gives an indication of the rate of change in future construction spending.
Cash flow indicates how much and when spending will occur. That allows a forecast of how spending from each month of previous starts will occur from all projects in backlog. Backlog could include projects that started two to three years ago, sometimes longer. Cash flow totals of all jobs can vary considerably from month to month, are not only driven by new jobs starting but also by old jobs ending, and are heavily dependent on the type, size and duration of jobs.
This plot shows actual spending history compared to that predicted by starts cash flow. Sometimes they diverge but overall it’s a pretty good indicator of the slope of growth.

2018 Spending
TOTAL construction spending in 2018 will reach $1.330 trillion, an increase of 7.6% over 2017. Nonresidential Buildings make up most of the growth.
Nonresidential Buildings spending in 2018 is forecast to reach a new high, $459 billion, an increase of 9.6% over 2017, surpassing the previous 2008 high. Educational and Manufacturing make up 55% of the growth.
For 2018, Educational spending is projected to increase 14%, the best increase since 2007. Educational starting backlog increased 10%/year for the last three years.
Manufacturing spending is projected to increase 12% in 2018. Manufacturing posted several very large project starts in 2017. Two thirds of all 2018 spending comes from projects started in 2016 and 2017.
Nonresidential construction is comprised of two very different sectors, nonresidential buildings and non-building infrastructure. Infrastructure spending is quite erratic, while nonresidential buildings spending, with only slight variation, has been climbing at a strong steady pace for more than 4 years. Some analysts track nonresidential total spending, but these two sectors perform so differently it helps to break them apart to track trends.
Nonresidential Buildings spending for 2018 is forecast to increase 9%. Institutional accounts for 52% of 2018 Nonres Bldgs spending growth, Commercial 27% and Industrial 21%.

You can find infrastructure Spending here 2018 Construction Spending Forecast – Mar 2018 and here Down the Infrastructure Rabbit Hole
Inflation
Outside of recession years, nonresidential buildings construction spending year over year growth dropped below 4% only SIX times in 50 years. The long term average inflation is close to 4%. Every time spending dropped below 4%, nonresidential buildings real volume declined that year.
Nonresidential buildings inflation forecast for 2018 is 4.5% to 5%. Spending needs to grow at a minimum of 4.5% just to stay ahead of construction inflation. Inflation in this sector has been at 4% or higher the last four years. A forecast of 2018 spending growth below 4.5% would suggest that nonresidential buildings construction volume is contracting. Economic activity does not indicate a non-recession low spending for nonresidential building construction. I expect volume growth in 2018.
Constant $
Nonresidential buildings construction spending in constant $ (inflation adjusted $) reached $419 billion in 2017. For 2018 (adjusted to the baseline 2017$) it will be $439 billion.
Constant $ spending shows all years from 1995 through 2010 had higher volume than the 2018 forecast. Volume reached a peak $536 billion in 2000 and went over $500 billion again in 2008. In constant $, 2018 is still 18% below the 2000 peak.
Spending in current $ is almost back to the peak of $438 billion in 2008, but volume is lower than almost all years from 1985 to 2010 and is still 22% lower than the 2000 high.
Volume in 2011 dropped to the lowest since 1983.

Nonresidential spending increased 43% since 2010, but there was 30% inflation. Real nonresidential volume since 2010 has increased by only 12%. Nonresidential jobs increased by 27% during that period, 15% in excess of volume growth.
Nonresidential Buildings
Nonresidential Buildings spending in 2018 is forecast to reach a new high, $459 billion, an increase of 9.6% over 2017, surpassing the previous 2008 high. Educational and Manufacturing make up 55% of the growth.

Nonresidential Buildings new starts are up 55% in four years. 2018 starting backlog is the highest ever, up 12% from 2017, up 24% in the last two years. Nonresidential Buildings 2018 starting backlog is 55% higher than at the start of 2014, the beginning of the current growth cycle. Spending is up 38% with 9% growth forecast for 2018.
80% of all nonresidential buildings construction spending in 2018 is already in backlog projects at the start of the year. Two thirds of all 2018 spending comes from projects that started in 2016 and 2017.
For 2018, Educational spending is projected to increase 14%, the best increase since 2007. Educational starting backlog increased 10%/year for the last three years. Manufacturing spending is projected to increase 12% in 2018. Manufacturing posted several very large project starts in 2017.

Educational new starts total from the last five months of 2017 posted the highest 5mo total in at least seven years, 13% higher than the next best 5mo. The highest and 2nd highest quarters were within the last 15 months, so both still contribute fully to 2018 spending. 2018 signifies a turn-round in Public spending which has not posted significant growth since the recession.
Educational starts are up 6% in 2017. Starts averaged YOY growth of 6%/year for the last three years and have had steady growth since 2012. The growth in starts will support growth in spending over the next three years. Starts for 2018 are predicted to go up 10% and this will push 2019 starting backlog even higher.
Educational backlog has been increasing for 5 years or longer. In 2016 and 2017 starting backlog increased 10%/year. 2018 starting backlog is up 8% from 2017. Backlog growth has been exceeding spending growth for the last four years. This should produce higher spending growth for the next few years.
Educational spending in the second half 2017, up 10% from the 2017 low point, is now at a post recession high. We can expect to see another six to eight months of growth before spending levels off in mid-2018 at a sizable gain over 2017.
Educational spending previous highs of $103-$104 billion in 2007 and 2008 may be passed in 2018. Both new starts and backlog have increased every year since 2012. A build-up of backlog is indicating that 2018 spending could increase dramatically. At peak, educational represented 30% of all nonresidential buildings spending. Now it’s only 22%. That’s expected to increase slightly for the next three years.
Educational construction spending in 2018 is forecast to reach a new high, $105 billion, an increase of 14% over 2017.
________________________________
Healthcare starts have quietly increased to a record high over the last two years, up 30% for the 12 months through August 2017 vs the previous 12 months. So while 2017 starts gained only 1%, most of 2017 is part of the fastest period of post-recession growth in years. All those starts contribute to 2018 spending. Starts have been increasing since 2012.
Healthcare starting backlog increased 10% for 2017 and 5% for 2018. Backlog has been increasing unevenly and grew 30% in 4 years. Spending followed a fairly similar pattern. Backlog is increasing in 2019. Backlog is indicating spending growth for 2018 and 2019.
Healthcare spending has been very slow to recover, experiencing declines as recently as 2013, 2014 and 2016, hitting an 8 year low in 2014, when all other nonresidential building markets had already returned to growth. From 2012 through 2016, Healthcare spending dropped 9%. 2017 posted a gain of 3.9%. Backlog will support spending gains for the next few years but gains could be uneven.
Healthcare construction spending for 2018 is forecast to reach $42 billion, an increase of 4.3% over 2017.
________________________________
Amusement/Recreation starts have been increasing at an average rate of 15%/yr for five years, up 30% in 2016 and 5% in 2017. Within the last six months, Aug 2017 to Jan 2018, there have been four very large billion dollar project starts. There has been a year’s worth of new starts in six months.
Amusement/Recreation starting backlog increased 20%/yr for the last four years at the same time that spending was increasing at a rate of 10%/year. This means backlog will continue to support increased spending at least for the next few years.
Amusement/Recreation spending hit an 8 year low in 2013 but we’ve had 3 years of excellent growth of 10%/yr or more since then. 2017 spending increased only 5%. But backlog is indicating 15%-20% increases for 2018 and 2019. This market is only 5% of nonresidential buildings spending.
Amusement/Recreation construction spending for 2018 is forecast to reach $29 billion, an increase of 23% over 2017.

Commercial/Retail starts finished 2017 essentially flat, but that is compared to peak starts in 2016. Starts for the 12 months Aug 2016 – June 2017 posted 10% growth over the previous 12 months. Starts had been remarkably strong from the 4th quarter 2015 though the 1st quarter 2017. Commercial/Retail starts have been increasing every year since 2010.
In 2010, Warehouse starts were only 1/3 of Store new starts. In 2018, Warehouse starts will be 50% greater than Store starts. Warehouse starts have increased between 20%-40%/year for seven years and are now five times greater than in 2010. See this Bloomberg article Warehouses Are Now Worth More Than Offices, Thanks to Amazon
Commercial/Retail starting backlog for 2018 will drop slightly from 2017. In addition, some of the big projects from the period of strong new starts growth are ending. This will slow spending after 7 years of strong growth. 2018 backlog still produces a spending increase but current projections show spending slows even more in 2019.
Commercial/Retail spending dropped from the high of $90 billion in 2007 to $40 billion in 2010. It has been growing steadily since reaching bottom in early 2011, and has recovered to an annual total rate of $88 billion in 2017. Spending increased an average of 13%/year for six years from 2012 through 2017. Growth will be positive in both 2018 and 2019 but will slow dramatically since we are currently near the all-time high.
Commercial/Retail construction spending for 2018 is forecast to reach a new high, $91 billion, an increase of 4% over 2017.
________________________________
Office construction starts finished 2017 down 2%, but only because 2016 had reached a recent high, similar too the highs in 1998 and 2006-2007. Starts have been increasing since 2010 with the strongest growth period of new starts in the 12 months July 2016 – June 2017, the highest 12 months on record, 60% higher than the previous 12 months. That high-volume period of starts will elevate spending in both 2018 and 2019. Data centers are included in Office.
Office starting backlog for 2017 was the highest in at least 8 years, more than double at the start of 2014 when the current growth cycle of office construction spending began. For 2018, backlog reached a new high, up 13% over 2017. Office starting backlog increased an average of 30%/year for the last 3 years. Backlog growth should support very strong spending increases into 2019.
Office spending dropped more than 40% from $68 billion/year in 2007-2008 to $37 billion from 2010 through 2013. From 2014 to 2016, spending increased by more than 20%/year, but in 2017 it slowed to only 3%. That was unusual and unexpected since starts and backlog had both reached 10 year highs. Possible explanations might be that a very large number of projects were canceled, 2016 starts were overstated or potential revisions to 2017 Office spending could be released in July.
Office construction spending in 2018 is forecast to reach a new high, $75 billion, an increase of 8% over 2017.
________________________________
Lodging starts in 2017 finished down 5%. From 2010 to 2016 starts averaged over 30%/year growth for six years. In 2018, Lodging starts could decline. But, even though new starts are down in 2017 and expected down in 2018, those will still be two of the three highest years. Peak starts were in 2016.
Lodging starting backlog is up 13% for 2018, having already averaged increases of 30%/yr since 2015. Lodging starting backlog jumped from $7 billion/yr in 2014 to $17 billion/yr in 2018. It has supported similar spending growth. Although 2016 was peak starts, it looks like 2018 will be peak backlog.
Lodging spending recorded the largest drop of any market, falling 75% from $36 billion in 2008 to $9 billion in 2011. However it also recorded the strongest rebound of any market, climbing 20% to 30% per year for the 5-years 2012-2016. In 2011, Lodging dropped to only 3% of total sector spending. It has rebounded to 7% in 2017.
Lodging spending will increase by 5% in 2018. It’s still not back to the previous high of $36 billion in 2008. Beyond 2018, spending will decline, but this is after 6 years of growth totaling 300%.
Lodging construction spending for 2018 is forecast to reach $30 billion, an increase of 5% over 2017.

Manufacturing is the only nonresidential building market that did not finish 2017 with new starts totals at or near post-recession highs. Manufacturing reached record high starts in 2014 and record spending in 2015. Manufacturing posted a 100% increase in new starts in 2014 that drove starting backlog and spending to new highs in 2015 and 2016. New starts declined 25%-30%/year for the next two years after the high in 2014. 2017 starts increased 20%, but that is still 35% lower than 2014.
Manufacturing backlog remained equally high in 2015 and 2016, but then dropped 20% in 2017. 2018 backlog will see an increase of 8%. Starting backlog dropped 20% in 2017 and spending dropped 12%. That was expected. What was unexpected is that 2017 posted another very strong year of new starts and that pushed 2018 starting backlog back up, but not quite as high as 2015-2016. This will support a spending rebound in 2018-2019 after a drop of 18% in the last two years.
Manufacturing spending was forecast to fall 11% in 2017 after peaking in 2015 from massive growth in new starts in 2014. Based on cash flows from starts, from April 2016 through the end of 2017 spending was expected to decline in 17 of 21 months. It did decline in 14 of those months. The forecast is now for very little declines in the next two years.
Manufacturing spending for 2017 is $66 billion versus $75 billion in 2016 and $80 billion in 2015. Although 2017 dropped to $66 billion, that was still higher than any but those two highest years. The 2017 spending drop of 11% is the largest drop since pre-recession, but it is measured compared to the peak years. Manufacturing in some reports is referred to as Industrial. 2019 spending could surpass the 2015 peak.
Manufacturing construction spending for 2018 is forecast to reach $75 billion, an increase of 13% over 2017.

Religious and Public Safety spending of $11-$12 billion/year represents only 2.5% of total nonresidential building spending. In 2008-2009 it was 5% of the total. The religious building market has been declining since 2002 and is down 55% since then. Public Safety peaked in 2009 and has declined every year since, now down 40% from the peak. I don’t track starts or backlog for these markets. I do track monthly spending and carry a forecast in the Table of Construction Spending.
Religious and Public Safety currently amounts to $11 billion/year. A 10% change in spending of $1 billion in a year would amount to only 0.2% change in all nonresidential buildings spending. This category doesn’t often change by 10% yr/yr, so it’s affect is small.
Public Spending
Public construction is a subset of Nonresidential Buildings and Non-building Infrastructure and includes about 1% of Residential.
Only about 25% of all Nonresidential Buildings spending, about $100-$110 billion, is publicly funded, mostly Educational. In total, this makes up about one third of Public spending.
- Nonresidential Buildings is 25% public (mostly institutional), 75% private.
- Educational, Healthcare and Public Safety are Public Nonres Institutional Bldgs
- Public Institutional = $100 billion, mostly Educational ($70b).

The largest market contributing to public spending is Highway/Bridge, 32% of total public spending. Major Nonresidential Buildings markets that contribute to public spending are Educational, 26% of total public spending, and Office, Healthcare, Public Safety and Amusement/Recreation which each account for about 3%.
Educational is 80% public, Transportation 70%, Amusement/Rec 50%, Healthcare 20%, and Power is 10% public, along with few other smaller shares.
Public spending hit a low in June 2017. It has been increasing since then. Public Educational, in the second half 2017, up 10% from the 2017 low point, is now at a post recession high. We can expect to see another six months of growth before spending levels off in mid-2018 at a sizable gain over 2017.
Educational alone accounts for about 30% of the Public spending growth in 2018. Educational new starts total for the last three months posted the highest quarter in at least seven years. The 2nd highest quarter was also within the last 12 months, so both will contribute fully to 2018 spending. 2018 signifies a turn-round in Public spending which has not posted significant growth since the recession.

Click here for a formatted printable PDF 2018 Forecast – Nonresidential Buildings
For the 2018 Forecast Summary see 2018 Construction Spending Forecast – Mar 2018
The 2018 Outlook link Economic Outlook
Here’s how to use the Starts data and how it affects spending Construction Starts and Spending Patterns 9-26-17
Construction starts data in this report references Dodge Data & Analytics starts data
See these posts for additional info
Starts Trends Construction 2018 Forecast – Fall 2017 11-8-17
Backlog Construction 2018 Forecast – Fall 2017 11-10-17
See also Publicly Funded Construction 2-28-18
For more on Public work see Down the Infrastructure Rabbit Hole 2-16-18
For effects of inflation see Constant Dollar Construction Growth 11-2-17

2018 Construction Spending Forecast – Mar 2018
3/15/18
Preliminary data is in for total year 2017 construction spending, 2017 construction starts and 2018 starting backlog. The following forecast is developed using the current data.
2018 Construction Spending Forecast – Mar 2018
A brief note on 2017.
2017 Spending Wrap Up
Total construction spending in 2017 now stands at $1.233 trillion, an increase of 4.0% over 2016.
Residential spending, up 10.5% for the fifth consecutive year above 10% growth, leads all construction spending in 2017 for the seventh consecutive year. Nonresidential Buildings finished the year up 2.3%. Only Non-building Infrastructure did not improve over 2016, down 3.8% for the year. However, Non-building Infrastructure had been at an all-time high for the previous two years.
2017 spending finished below my forecast due to performance in Educational, Office, Power and Highway, four of the five largest markets which together make up half of all nonresidential spending. All came in lower than forecast. However, some of these markets are prone to very large post-annual upward revisions and that has the potential to add to 2017 spending when those revisions are released in July 2018. For instance, in the July 2017 revisions, Power spending for the previous year, 2016, was revised up by 10%.
History shows spending has been revised up 53 times in the last 60 months. I expect to see future revisions smooth out spending in unusually low periods and increase total 2017 spending above this forecast. Both April and July preliminary spending appear statistically too low. The average post-annual total spending revision for the last five years is +2.8%. The post-annual revision to 2016 was only 2.2%. Revisions due for release on July 1, 2018, if even only a +1% revision to 2017, would adjust total 2017 spending up to $1,245 billion. This would slightly alter the 2018 forecast.

2018 Spending Total All Construction
Total All 2018 construction spending is forecast to increase 7.6% to $1.330 trillion.
Nonresidential Buildings spending forecast for 2018, up 9%, will be supported by Manufacturing and Educational. Non-building Infrastructure returns to strong growth of 8%, with potential to hit a new all-time high due to very large projects in Power and Transportation. Residential spending in 2018 slows to growth under 6% after six years all over 10%/year.
Dodge Data 2017 construction starts increased 3% from 2016. However, starts are always revised upward in the following year. I expect revisions will show 2017 starts increased by more than 6% over 2016. Even with that revision, 2017 starts posted the lowest growth since 2011, weighted heavily by the slowdown in residential starts.
Total starting backlog for 2018, currently at an all-time high, has increased on average 10%/year the last three years. 80% of all Nonresidential spending within the year will be generated from projects in starting backlog. Public share of new construction starts are up only 10% in 3 years. But due to long duration job types, 2018 starting backlog is up 30% in the last 3 years.
None of this spending forecast includes any projections for potential work from future infrastructure stimulus.

Current$ vs Constant$
Construction spending reached a new current $ high in 2017 at $1,236 billion. The previous high in current $ was $1,161 in 2006. Spending first surpassed that in 2014 and has been increasing since. But that is in current $, which includes inflation.
Comparing current $ spending to previous year spending does not give any indication if business is increasing. The inflation factor is missing. If spending is increasing at 4%/year in a time when inflation is 6%/year, real volume is declining by 2%.
Although 2018 current $ spending will reach $1,330 billion, after adjusting for 4.5% to 5% inflation, 2018 constant $ volume will increase to only $1,270 billion. When comparing inflation adjusted constant dollars, 2018 spending will still be lower than all years from 1998 through 2007. In 2005 constant $ volume reached a peak at $1,450 billion. At current rates of growth, we would not eclipse the previous high before 2022.
While spending in current $ is 7% higher than the previous high spending, volume is still 14% lower than the previous high volume.
For more on Inflation Adjusted spending see Construction Spending is Back

Jobs and Volume
The period 2011-2017 shows both spending and jobs growth at or near record highs.
A spending forecast of 7%+ in 2018, or nearly $100 billion in construction spending, demands a few words on jobs growth. Construction requires about 5000 workers for every added $1 billion in construction volume. Construction jobs have never increased by 500,000 in one year. However, $100 billion in added spending is not the same as $100 billion in volume, and jobs growth is based on volume.
Although spending will increase 7%-8%, construction inflation has been hovering near 4.5% to 5% for the last five years. Real volume growth in 2018 after inflation is expected to be near 3% or $40 billion. That would mean the need, if there are no changes in productivity, is to add only about 200,000 additional workers in 2018, a rate of jobs growth that is well within reach. That is less than the average jobs growth for the last seven years.
Construction added 1,339,000 jobs in the last 5 years, an average of 268,000/year. The only time in history that exceeded jobs growth like that was the period 1993-99 with the highest 5-year growth ever of 1,483,000 jobs. That same 1993-99 period had the previous highest 5-year spending and volume growth going back to 1984-88.
Construction added 185,000 jobs in the last 4 months, Nov17-Feb18. That’s happened, for any 4-month period, only 5 times since 1984. The last time was 2005-06, during the fastest rate of spending increases since 1984.

Total all spending increased 55% since 2010, but there was 30% inflation. Real total volume since 2010 has increased by only 25%. Jobs increased by 30%, 5% in excess of volume growth. But the results are much different for Residential than Nonresidential.
Nonresidential spending increased 43% since 2010, but there was 30% inflation. Real nonresidential volume since 2010 has increased by only 12%. Jobs increased by 27%, 15% in excess of volume growth.
Residential spending increased by 110% since 2010, but after inflation, real residential volume increased by only 57%. Jobs increased by only 37%, 20% short of volume growth.
For more on Jobs see Construction Jobs and Residential Construction Jobs Shortages
Residential Buildings Spending
Total Residential spending in 2017 finished at $523 billion, up 10.6% from 2016. This is the 5th consecutive year that residential spending exceeded 10% annual growth. Average spending growth the last six years is 13%/year.
Residential spending in 2017 was 50% single family, 13% multi-family and 37% improvements. In 2011, improvements was 48% of residential spending.
Census does not include flood damage repairs (house shell remains intact but gut renovate) in improvements but does include full flood damaged structure replacements (structure rebuild permit classified as new) in improvements.
Residential spending is more dependent on new starts within the most recent 12 months than on backlog from previous starts. Total starts for the last 6 months are the highest since 2006, but % growth has slowed considerably. New starts in 2017 posted only 2% growth, but I expect that to be revised up to at least 4%. Similar growth of 6%-7% is expected for 2018. Slower growth is now expected after 5 years (2012-2016) of new starts increasing at an average 20%/year.

Residential 2018 spending growth is forecast to increase only 6% after five years over 10%. Total residential spending in 2018 is forecast at $552 billion.
Residential spending will reach a 12-year high in 2018. Residential spending reached its current $ peak of $630 billion in 2005. Current 2018 pending is still 13% below that peak. In constant $, adjusted for inflation, all years from 1998 through 2007 were higher than 2018. In constant $, 2018 spending is still 27% below the 2005 peak.
Residential buildings construction spending in constant $ reached $523 billion in 2017. Previous spending adjusted to equivalent 2017$ shows that all years from 1996 through 2007 had higher volume than 2017. Volume reached a peak $748 billion in 2005. Only the years 2004-2006 had higher spending in current $. The 2005 current $ peak of $630 billion is still 17% higher than 2017, but 2017 volume is still 30% lower than peak volume.

Nonresidential Buildings Spending
Nonresidential Buildings spending in 2017 finished at $419 billion, up only 2.7% from 2016.
2017 spending finished below my forecast due to performance in Educational and Office. Educational starts increased 6%+/year for the last three years, but spending increased only 4%/year the last two years. Office starts increased nearly 30% in 2016, but spending increased only 3% in 2017. I suspect either big upward revisions to 2017 spending or large increases in backlog will boost 2018 spending in these two markets.

Nonresidential Buildings new starts are up 60% in four years. 2018 starting backlog is the highest ever, up 15% from 2017. Nonresidential Buildings 2018 starting backlog is 50% higher than at the start of 2014, the beginning of the current growth cycle.
Starting backlog has increased for five years at an average 10%/year. Spending from starting backlog, up 10% in 2018, increased for five years at an average 9%/year.
For 2018, Educational spending is projected to increase 14%, the best increase since 2007. Starting backlog increased 10%/year for the last three years. Manufacturing posted several very large project starts in 2017. Spending is projected to increase 12% in 2018.
Nonresidential Buildings spending in 2018 is forecast to reach a new high, $459 billion, an increase of 9.5% over 2017, surpassing the previous 2008 high. Educational and Manufacturing make up 55% of the growth.
For the Full Expanded 2018 Construction Spending Forecast – Nonresidential Bldgs
Nonresidential buildings construction spending in constant $ (inflation adjusted $) reached $419 billion in 2017. In 2018 it will reach $439 billion. Constant $ spending shows all years from 1996 through 2010 had higher volume than the 2018 forecast. Volume reached a peak $536 billion in 2000 and went over $500 billion again in 2008. In constant $ 2018 is still 18% below that 2000 peak.

Non-building Infrastructure Spending
Total non-building infrastructure spending in 2017 dropped to $293 billion, down 3.7% from 2016.
Non-building Infrastructure spending, always the most volatile sector, dropped to yearly lows from June through September, the lowest since November 2014. However, this short dip was predicted. Cash flow models of Infrastructure starts from the last several years predicted that dips in monthly spending would be caused by uneven project closeouts from projects that started several years ago, particularly in Power and Highway markets.

Current backlog is at an all-time high and spending is expected to follow the increased cash flows from the elevated backlog. Environmental Public Works (Sewage/Waste disposal down 14%, Water Supply down 9% and Conservation/Dams & Rivers down 7% in 2017) posted the largest declines in 2017 and accentuated the declines in the infrastructure sector. The sector was expected to increase in the last quarter 2017. All three markets posted increases in the 4th quarter, up 8% over the 1st nine months of 2017.
Non-building Infrastructure 2018 starting backlog is the highest ever, up 10%+ each of the last 3 years. Transportation terminals new starts in 2017 jumped 120%. Rail project starts increased more than 100%. Starting backlog for all transportation work is the highest ever, up 100% in the last two years. Transportation spending is projected to increase 20-25%/year for the next two years.
No future growth is included from infrastructure stimulus and yet 2018 spending is projected to increase by 8%.

Non-building Infrastructure will reach a new high for spending in 2018. Spending reached an all-time high in 2015 and stayed within 0.3% of that high for 2016. A 3.5% decline in 2017 was more of a decline than expected, but there may still be upward revisions to the preliminary total.
Non-building Infrastructure spending in 2018 is forecast to reach $319 billion, an increase of 8.6% over 2017.
My forecast for 2018 is predicting every infrastructure market will post gains, but it is the Power and Transportation markets that account for most of the growth in 2018. Transportation new starts in 2017 grew 120% due to massive new air terminal and rail projects. Spending growth in the Power market is not quite so apparent. Combined Power new starts are down for both 2016 and 2017, but the spending gains are coming from projects that started in 2015, a year in which starts were up over 120%.
Adjusted for inflation, spending in 2018 will be nearly equal to the all-time highs reached in 2015 and 2016.
Non-building Infrastructure construction spending in constant $ reached $294 billion in 2017. Recent highs were posted in 2015 and 2016 at $305 billion and $304 billion and 2018 is expected to reach $319 billion. Previous spending adjusted to equivalent 2017$ shows that 2008 and 2009 were both just slightly higher than $300 billion. Constant $ volume reached a peak $313 billion in 2016. Spending in current $ hit new highs in 2015 and 2016. This is the only sector that has current $ and constant $ at or near all-time highs.

Public Infrastructure and Public Institutional
Only 60% of all Non-building Infrastructure spending, about $170 billion, is publicly funded. That public subset of work averages growth of less than $10 billion/year.
Only about 25% of all Nonresidential Buildings spending, about $100 billion, is publicly funded, mostly Educational.
- Infrastructure = $300 billion, 25% of all construction spending.
- Infrastructure is about 60% public, 40% private. In 2005 it was 70% public.
- Public Infrastructure = $170 billion. Private Infrastructure = $130 billion.
- Power and Communications are privately funded infrastructure.
- Nonresidential Buildings is 25% public (mostly institutional), 75% private.
- Educational, Healthcare and Public Safety are Public Nonres Institutional Bldgs
- Public Commercial construction is not included.
- Public Institutional = $100 billion, mostly Education ($70b).

Public Infrastructure + Public Institutional = $270 billion, 23% of total construction spending.
Public Infrastructure + Institutional average growth is $12 billion/year. It has never exceeded $30 billion in growth in a single year.
See also Publicly Funded Construction
See also Down the Infrastructure Rabbit Hole
Public Spending
Public construction is a subset of Nonresidential Buildings and Non-building Infrastructure and about 1% of Residential.
The two largest markets contributing to public spending are Highway/Bridge (32% of total public spending) and Educational (26%), together accounting for nearly 60% of all public construction spending. At #3, Transportation is only about 10% of public spending. Environmental Public Works combined makes up almost 15% of public spending, but that consists of three markets, Sewage/Waste Water, Water Supply and Conservation. Office, Healthcare, Public Safety and Amusement/Recreation each account for about 3%.
2017 spending was down 1%, but has been at or near the all time high for three years.
Total public spending for 2017 finished flat at $284 billion with most major public markets down for the year. By far, the largest Public spending declines in 2017 are Sewer and Waste Disposal which is 7% of public markets, it was down 16% and Highway/Bridge, down only 3.5%, but Highway is 32% of all public spending.
Public spending hit a low in June 2017. It has been increasing since then, Public Educational, in the second half 2017 up 10% from the low point, now at a post recession high. We can expect to see another six months of growth before spending levels off in mid-2018.
Due to long duration job types, 2018 starting backlog is up 30% in the last 3 years. In 2018, 40% of all spending comes from jobs that started before 2017. Leading 2018 growth are Educational (+15%) and Transportation (+35%), with a combined total forecast 20% growth in public spending.
Current levels of backlog and predicted new starts gives a projection that Public Non-building Infrastructure spending will reach an all-time high in 2018 and again in 2019.
Total Public spending in 2018 is forecast to reach $307 billion, an increase of 8% over 2017, the best growth in 10 years.
Educational and Transportation will contribute equally and together account for almost 60% of the Public spending growth in 2018. Transportation new starts in 2017 grew 120% due to massive new air terminal and rail projects. Educational new starts total for the last three months posted the highest quarter in at least seven years. The 2nd highest quarter was also within the last 12 months, so still contributes fully to 2018 spending. 2018 signifies a turn-round in Public spending which has not posted significant growth since the recession.
Public spending is 10%, $30 billion, below 2009 all-time highs, most of the deficit coming from declines in Educational, Sewage/Waste Water and Water Supply. In 2018, Highway and Transportation are at all-time highs.
Click here for a formatted printable PDF Construction Spending Forecast – Summary Mar 2018
See these posts for additional info
2018 Construction Spending Forecast – Nonresidential Bldgs
Starts Trends Construction 2018 Forecast – Fall 2017 11-8-17
Backlog Construction 2018 Forecast – Fall 2017 11-10-17
For more on Jobs see Construction Jobs / Workload Balance 11-7-17
For effects of inflation see Constant Dollar Construction Growth 11-2-17
Construction Activity Notes 4-25-18
Notes on March 2018 Construction Spending

2018 Construction Outlook Articles Index
Articles Detailing 2018 Construction Outlook
Links will open in a new tab
These links point to articles here on this blog that summarize end-of-year data for 2017 and present projections for 2018.

Most Recently Published
July Construction Starts Fall but 3moAvg at New High
Construction Spending June 2018 8-1-18
June Construction Starts Reach New Highs 7-25-18
Construction JOLTS – What’s wrong with this picture? 7-10-18
Construction Spending 2016-2017 Revisions 7-1-18
New Construction Starts May 2018 Near All-Time High 6-24-18
Construction Spending April 2018 – 6-1-18
Notes on March 2018 Construction Spending 5-2-18
Construction Activity Notes 4-25-18
2018 Construction Spending Forecast – Nonresidential Bldgs 3-28-18
2018 Construction Spending Forecast – Mar 2018
Construction Economics Brief Notes 3-10-18
Construction Spending is Back 3-9-18
Publicly Funded Construction 2-28-18
PPI Materials Input Index 2-20-18
Down the Infrastructure Rabbit Hole 2-16-18
Inflation in Construction 2018 – What Should You Carry? 2-15-18
Residential Construction Jobs Shortages 2-3-18
2018 Construction Spending – Briefs 1-26-18
Cautions When Using PPI Inputs to Construction! 1-15-18
Indicators To Watch For 2018 Construction Spending? 1-10-18
Spending Summary 2018 Construction Forecast Fall 2017 12-3-17
Backlog 2018 Construction Forecast Fall 2017 11-10-17
Starts Trends 2018 Construction Forecast Fall 2017 11-8-17
In What Category is That Construction Cost? 11-15-17
Construction Jobs / Workload Balance 11-7-17
Constant Dollar Construction Growth 11-2-17
Is Infrastructure Construction Spending Near All-Time Lows? 10-10-17
Summary
2018 Construction Spending Forecast – Mar 2018
2018 Construction Spending – Briefs 1-26-18
Spending Summary 2018 Construction Forecast Fall 2017 12-3-17
Construction Spending is Back 3-9-18
2017 Results
2018 Construction Spending Forecast – Mar 2018
Spending Summary 2018 Construction Forecast Fall 2017 12-3-17
2018 Starting Backlog & New Starts
2018 Construction Spending – Briefs 1-24-18
Backlog 2018 Construction Forecast Fall 2017 11-10-17
Starts Trends 2018 Construction Forecast Fall 2017 11-8-17
Construction Starts and Spending Patterns 9-26-17
2018 Spending Forecast
2018 Construction Spending Forecast – Mar 2018
2018 Construction Spending – Briefs 1-26-18
So, About Those Posts “construction spending declines…” 10-4-17
Construction Spending Almost Always Revised UP 5-1-17
Nonresidential Buildings
2018 Construction Spending Forecast – Nonresidential Bldgs 3-28-18
2018 Construction Spending Forecast – Mar 2018
2018 Construction Spending – Briefs 1-24-18
Nonres Bldgs Construction Spending Midyear 2017 Forecast 7-24-17
Residential
2018 Construction Spending Forecast – Mar 2018
Residential Construction Jobs Shortages 2-3-18
Infrastructure Outlook
2018 Construction Spending Forecast – Mar 2018
Down the Infrastructure Rabbit Hole 2-16-18
2018 Construction Spending – Briefs 1-24-18
Is Infrastructure Construction Spending Near All-Time Lows? 10-10-17
Infrastructure – Ramping Up to Add $1 trillion 1-30-17
Calls for Infrastructure Problematic 1-12-17
Public Construction
2018 Construction Spending Forecast – Mar 2018
Publicly Funded Construction 2-28-18
Spending Summary 2018 Construction Forecast Fall 2017 12-3-17
Infrastructure & Public Construction Spending 3-5-17
Materials
PPI Materials Input Index 2-20-18
Jobs
Residential Construction Jobs Shortages 2-3-18
Construction Jobs / Workload Balance 11-2-17
Construction Jobs Growing Faster Than Volume 5-5-17
Inflation
Inflation in Construction 2018 – What Should You Carry? 2-15-18
Constant Dollar Construction Growth 11-2-17
Construction Inflation Index Tables UPDATED 2-12-18
Construction Cost Inflation – Commentary updated 2-13-18
US Historical Construction Cost Indices 1800s to 1957

Spending Summary Construction Forecast Fall 2017
3-15-18 see also 2018 Construction Spending Forecast – Mar 2018
12-2-17
Summary
Total construction spending in 2017 will reach $1,236 billion, an increase of 4.2% over 2016. Residential spending is above 10% growth for the 5th consecutive year.
Year-to-date construction spending growth through October is 4.1%.
Residential leads construction spending growth in 2017 for the seventh consecutive year, up 10.6%. My Nonresidential Buildings forecast has been lowered since July but finishes the year up 2.8%. Only Non-building Infrastructure will not improve over 2016, down 3.7% for the year. However, Non-building Infrastructure has been at an all-time high for the previous two years.

This forecast is down slightly since July due to reductions in both nonresidential buildings and non-building infrastructure. Educational, Office, Power and Highway, four of the five largest markets which together make up half of all nonresidential spending, were all lowered. Some of these markets are prone to very large post-annual upward revisions and that has the potential to add to 2017 spending when those revisions are released in July 2018. In the July 2017 revisions, Power spending for 2016 was revised up by 10%.
History shows spending has been revised up 51 times in the last 55 months. I wouldn’t be surprised to see future revisions smooth out spending in unusually low periods (April and July) and increase total 2017 spending above this forecast. I suspect revisions in July 2018 may show 2017 spending as high as $1,250 billion. The average post-annual total spending revision for the last five years is +2.3%. The total revision to 2016 was only 2.2%.
None of the spending detailed in this analysis includes any projections of potential work from future infrastructure stimulus.
Total construction spending in 2018 is currently forecast to reach $1,334 billion, an increase of 8.0% over 2017. For the first time since pre-recession, Non-building Infrastructure will lead all spending with potential to increase by 10% growth over 2017.
Non-building Infrastructure is forecast to lead 2018 spending with an increase of 10.2% due to very large projects in Power and Transportation. Nonresidential Buildings growth is strong for 2018, forecast up 9.3%. Residential spending in 2018 slows to only 5.7% growth after six years averaging 13%/year.
Total spending will reach a new high in 2018 for the third consecutive year. However, in constant $ adjusted for inflation, spending is just back to the level of 2008. The all-time constant $ high was reached in 2005. Adjusted for inflation, 2018 will still be 12% below that level. At current rates of growth, we would not eclipse the previous high before 2022.

Growth of 8% in 2018 or $100 billion in construction spending demands a few words on jobs growth. Construction requires about 5000 workers for every added $1 billion in construction volume. Construction jobs have never increased by 500,000 in one year. However, $100 billion in added spending is not the same as $100 billion in volume, and jobs grow based on volume. Although spending will increase 8%, construction inflation has been hovering near 4.5% to 5% for the last five years. Real volume growth in 2018 after inflation is expected to be just over 3% or $40 billion. That would mean the need, if there are no changes in productivity, is to add about 200,000 additional workers in 2018, a rate of jobs growth that is well within reach since that is below the average jobs growth for the last seven years.
Residential Buildings Spending
Total Residential spending in 2017 will finish at $523 billion, up 10.6% from 2016. Residential spending is above 10% growth for the 5th consecutive year.
Residential spending was expected to dip between May and October due to a low volume of work contributed from starts cash flows. The actual data shows, after reaching a seasonally adjusted annual rate (saar) of $536 billion in March, the high for the year, spending dropped 3% to 4% to as low as $515 billion saar three times and has averaged only $520 billion saar from April through October. New starts in Q1’17 reached an 11-year high, so I expect the rate of spending to increase at year end. Residential work will close out the year with 10.6% growth, the 5th consecutive year over 10%. Average growth the last six years is 13%/year.
Residential spending is 50% single family, 13% multi-family and 37% improvements.
Residential Improvements has posted 18% growth year-to-date. Single Family spending is up 9% while multi-family is up only 4%. That is compared to 2016 when improvements for the year finished up 10%, SF up 4% and MF up 5%. Census does not include flood damage repairs in improvements but does include full flood damaged structure replacements in improvements.
Total residential spending in 2018 slows to a forecast of $553 billion, only 5.7% growth over 2017.
Due to the shorter duration of projects, nearly 70% of residential spending within the year is generated from new starts. Unlike Nonresidential, backlog does not contribute nearly as much to Residential spending within the year. New Residential starts in Q1’17 reached an 11-year high. Residential starts are at a post-recession high.
Residential spending will reach a 12-year high in 2018. Adjusted for inflation, all years from 1996 through 2007 were higher. Inflation adjusted spending is still 30% below the all-time high reached in 2005.

Nonresidential Buildings Spending
Total Nonresidential Buildings spending in 2017 will come in at $420 billion, up only 2.8% from 2016.
Commercial/Retail is expected to finish the year with +13% growth and Lodging +9%. An unexplained surprise was Office, which by early indicators was predicted to show large gains in spending. Two independent sources reported new office starts in 2016 up 25% to 30%. Starting backlog coming into 2017 was near or at an all-time high. Spending was forecast to jumped at least 20% in 2017. Instead, spending posted declines from May to September and is now forecast to finish with only a 4% gain. This market accounts for the single largest miss in my forecast posted in Feb 2017.
The only major nonresidential building in decline this year is Manufacturing. Manufacturing spending was expected to fall in 2017 after peaking in 2015 from massive growth in new starts in 2014. Spending stayed close to that level in 2016. Based on cash flows from starts, spending was expected to decline in 14 of the last 18 months. It declined in 11 of those months. We are at the point of turn-around with only one monthly decline predicted in the next three months and no spending declines expected next year. For 2017, Manufacturing new starts are up 35%.

Nonresidential Buildings starts in the six months from Aug 2016 to Jan 2017 posted the (then) highest amount of new starts since Jan-Jun 2008, also the year Nonresidential Buildings spending peaked. Then new starts in the six months Apr-Sep 2017 just surpassed both those previous peak highs.
Nonresidential Buildings 2018 starting backlog is 50% higher than at the start of 2014, the beginning of the current growth cycle. Starting backlog has increased for five years at an average 10%/year. Spending from starting backlog, up 10% in 2018, increased for five years at an average 9%/year.
Total nonresidential buildings spending in 2018 is forecast to reach $458 billion, an increase of 9.3% over 2017. Office, educational and manufacturing make up 70% of the growth.
Nonresidential Buildings will reach a new high for spending in 2018, surpassing the previous 2008 high. However, adjusted for inflation, spending is 18% below the all-time high reached in 2000.
Non-building Infrastructure Spending
Total non-building infrastructure spending in 2017 drops to $293 billion, down 3.7% from 2016.
Non-building Infrastructure spending, always the most volatile sector, dropped to yearly lows from June through September. Infrastructure construction spending in August dropped to the lowest since November 2014. However, this was predicted. Cash flow models of Infrastructure starts from the last several years show current dips in monthly spending are being caused by uneven project closeouts from projects that started several years ago.
Current backlog is at an all-time high and spending will follow the expected increased cash flows from the elevated backlog. Environmental Public Works (Sewage/Waste disposal down 16%, Water Supply down 9% and Conservation/Dams & Rivers down 7%) posted the largest declines in 2017 and accentuated the declines in the infrastructure sector. The sector is expected to increase slightly in the last quarter 2017. In recent months there are already substantial gains being posted in Conservation and Transportation.
No future growth is included from infrastructure stimulus and yet 2018 is projected to increase by 10%.

Total non-building infrastructure spending in 2018 is forecast to reach $324 billion, an increase of 10.5% over 2017. My forecast for 2018 is predicting every infrastructure market will post gains, but it is the Power and Transportation markets that account for almost all the growth in 2018. Transportation new starts in 2017 grew 120% due to massive new air terminal and rail projects. Spending growth in the Power market is not quite so apparent. Combined Power new starts are down for both 2016 and 2017, but the spending gains are coming from projects that started in 2015, a year in which starts were up over 120%.
Non-building Infrastructure will reach a new high for spending in 2018. This sector had posted a new high in 2015 and nearly equaled that in 2016. Adjusted for inflation, spending in 2018 will be nearly equal to the all-time highs reached in 2015 and 2016.

Public Spending
Total public spending for 2017 remains flat at $287 billion with most major public markets down for the year.
At midyear, I expected Educational and Highway to support a Public spending increase in 2017. Those gains did not materialize. A decline in Highway spending offset small gains in Educational. By far the largest Public spending decline is in Sewer and Waste Disposal, down 16%.
Public spending hit the low for the year in July. It increased for the last three months, most recently by an 11% increase in Public Educational spending in October. We are now near the high for the year and can expect to see another six months of growth before spending levels off in mid-2018.

When you see graphics that present Residential, Nonresidential and Public spending all on the same plot, they are not additive. Only Residential and Nonresidential can be added to reach total spending. Public is a subset of Nonresidential, composed partly of Nonresidential Buildings (~40%) and partly Non-building Infrastructure (~60%), with a slight amount of residential.
The two largest markets contributing to public spending are Highway/Bridge, 32% of total Public spending, and Educational, 25% of Public spending. The third largest market, Transportation, is only about 10% of Public spending. Environmental Public Works combined makes up almost 15% of public spending, but that consists of three markets, Sewage/Waste Water, which accounts for 8%, Water Supply and Conservation. Office, Healthcare, Public Safety and Amusement/Recreation each account for about 3%.
All of Highway/Bridge is Public spending. Only 80% of Educational spending is Public and only 70% of Transportation is Public. Environmental Public Works markets are 99% Public.

Total Public spending in 2018 is forecast to reach $305 billion, an increase of 6.3% over 2017. Public spending in 2018 will reach the highest year over year growth since 2008.
Educational and Transportation will contribute equally and together account for almost 60% of the Public spending growth in 2018. Transportation new starts in 2017 grew 120% due to massive new air terminal and rail projects. Educational new starts total for the last three months posted the highest quarter in at least seven years. The 2nd highest quarter was also within the last 12 months, so still contributes fully to 2018 spending. 2018 signifies a turn-round in Public spending which has not posted significant growth since the recession.
See this companion post for Starts Trends Construction Forecast Fall 2017 11-8-17
After New Starts, dollars are tracked in Backlog, Backlog Construction Forecast Fall 2017 11-10-17
For more on Jobs and Workload see Construction Jobs / Workload Balance 11-7-17
For effects of inflation see Constant Dollar Construction Growth 11-2-17

Starts Trends Construction Forecast Fall 2017
11-8-17
It all starts here! Construction Starts Generate Construction Spending.
2017 construction starts through September total $557 billion Year-to-date (YTD), even with 2016. If/when 2017 gets revised as expected it will then show +3% to +4% growth over 2016, but we won’t see that growth in the revision data until next year.
- Previous year starts always later get revised upwards. Therefore, current year starts ytd growth is always understated.
- Revisions for the period 2012-2015 averaged +4%.
- Revisions to 2016 year-to-date through September are +10%.
- Starts have been increasing at an average rate of 11%/year for the last 5 years.
- Nonresidential Buildings and Nonbuilding Infrastructure are at or near all-time highs.
- Residential starts are at a post-recession high.
- New starts will generate record high 2018 starting backlog for every sector.
Nonresidential Buildings starts, averaged 13%/year growth for the last 4 years, even though there was a 1% decline in 2015. 2017 will post an 8% increase. The 6 months from Aug 2016 to Jan 2017 was the highest period of starts since Jan-Jun 2008, the year nonresidential buildings spending peaked. The 6 months Apr-Sep 2017 just surpassed both those previous peak highs. This will help support increases in nonresidential buildings spending for the next two years.
Infrastructure starts posted a higher value of new construction projects in the 1st 6 months of 2015 than any 6-month period in history. 2016 is down just 2% from the peak 2015 starts and 2016 is the 2nd highest starts on record. Those early 2015 starts will still generate 10% of all spending in 2018. After revisions, 2017 starts may set a new peak high. This would set up infrastructure as the strongest growth sector for the next two years.
Residential starts in 2016 posted the best year since 2005-2006. New starts in 2016 were revised up by 5% to show an increase of 10% growth over 2015. That follows five years of growth averaging 20%/year. Initial values posted for 2017 show starts up by only 3.5%, however, the average revision for the past few years has been +2% to +4%, so 2017 will get revised higher. New starts in Q1 2017 reached an 11 year high.
All construction starts data in this report references Dodge Data & Analytics Starts data.
Care must be taken to use Starts data properly. It is regularly misinterpreted in common industry forecasting articles. Starts dollar values represent a survey of about 50% to 60% of industry activity, therefore Starts dollar values cannot ever be used directly to indicate spending. Also, Starts do not directly indicate changes in spending per month or per year. Only by including an expected duration for all Starts and producing a forecast Cash Flow from Starts data can the expected pattern of spending be developed. Finally, it is the rate of change in Starts Cash Flows that gives an indication of the rate of change in spending.
Cash flow is the best indicator of how much and when spending will occur. Cash flow from DDA starts gives a prediction over time of how spending from each month of previous starts will occur from all projects in backlog. Cash flow totals of all jobs can vary considerably from month to month, are not only driven by new jobs starting but also old jobs ending, and are heavily dependent on the type, size and duration of jobs.

Nonresidential Buildings
Retail/Commercial starts may finish flat or up just slightly for 2017, but that is compared to peak starts in 2016. Starts for the 12 months Aug 2016 – June 2017 posted 10% growth over the previous 12 months. Retail/Commercial starts have been increasing every year since 2010. In 2010, Warehouse starts were only 1/3 of Store new starts. In 2018, Warehouse starts will be 50% greater than Store starts. Warehouse starts have increased between 20%-40%/year for seven years and are now five times greater than in 2010.
Office construction starts have been increasing since 2010 with the strongest growth period of new starts in the 12 months July 2016 – June 2017, the highest 12 months on record, 60% higher than the previous 12 months. That high-volume period of starts is going to elevate spending in both 2018 and 2019 to come in higher than 2017. Office starts averaged year-over-year (YOY) growth of 20%/year for the last five years. Data centers are included in Office.
Educational starts are up 7% in 2017. Starts have averaged YOY growth of 8%/year for the last two years and have had slow but steady growth since 2012. The growth in starts will support growth in spending or the next three years.
Office, Retail and Educational markets comprise 60% of all nonresidential buildings. They are collectively responsible for 70% of the increase in 2017 nonresidential buildings starts.
Healthcare starts have quietly increased to a record high over the last 12 months, up 30% for the 12 months through August vs the previous 12 months.
Lodging starts may be flat or will be up only slightly in 2017, but from 2010 to 2016 averaged over 30%/year growth for six years. In 2018, Lodging may return to that six-year average growth.
Manufacturing is the only nonresidential building market that will NOT finish 2017 with new starts totals at or near post-recession highs. Manufacturing reached record high starts in 2014 and record spending in 2015. However, 2017 will post new starts 50% higher than initially predicted by Dodge.
Manufacturing spending was expected to fall in 2017 after peaking in 2015 from massive growth in new starts in 2014. Based on cash flows from starts, spending was expected to decline in 14 of the last 18 months. It did decline in 11 of those months. We are at the point of turn-around with only 1 monthly decline predicted in the next 3 months and no spending declines expected next year.
Non-building Infrastructure
Sewer/Water/Conservation, the three Environmental Public Works markets, posted declines in new project starts in 3 (sewer) or 4 of the last 4 years. Collectively, new starts in 2017 are the lowest in 5 years. Cash flow predicted from starts has been indicating spending declines since Q2-2016. In fact, spending has declined in 12 of the last 18 months. Cash flow still indicates more spending declines over the next 8 months.
Highway/Bridge/Street starts in the 2nd half of 2014 recorded the slowest rate of growth in the last 6 years. Starts that would normally be contributing spending through 2017 and into 2018 contributed a lower than normal volume of spending which will end in 2017. Had it not been for the extremely high volume of starts in the 1st 4 months of 2014, the most ever recorded in 4 consecutive months, 2017 spending would have dropped more than double the 4% spending decline now forecast.
Highway starts in the 1st 6 months of 2015 posted the next highest growth to early 2014. Spending in 2018 will benefit from those projects that started in 2015 but that have unusually long duration. They will contribute a higher rate of spending in 2018 beyond the duration that typical projects would have ended. It is not recent new starts but old backlog that is influencing 2017 and 2018 highway spending.
Transportation Terminal starts in the first three months of 2017 were more than three times higher than any three-month period in the previous five years. While this helped turn 2017 spending positive, 2017 is still affected by uneven starts from two to three years ago holding down gains in the 2nd half. Transportation will show only a 2% gain in 2017 spending but will post strong double digits gains in 2018 and again in 2019. Terminal buildings is reported in Dodge Starts in Other Institutional Buildings. However Census reports terminal spending in Transportation along with Rail and Dock spending. I adjust the starts data in my reports to conform to the Census construction spending reports.
Power market starts peaked in 2015 at an all-time high, up 142% from 2014 and more than the prior two years combined. The Power market was the prime contributor to the abnormally high infrastructure starts in the 1st 6 months in 2015. Power spending was down 6% in 2015 and up only 3% in 2016 because Power starts were also at an all-time high in 2012, just below the 2015 level, and those starts drove 2014 spending to an all-time high, but then spending from those old jobs tapered off in 2015.
Power starts dropped 11% in 2016 and are down slightly in 2017. Recently, there has been an unexpected large volume of power plant and pipeline starts that are driving 2017 power starts to come in about 40% higher than initially expected.
Even though Power starts have been declining since the 2015 high point, Power had several periods with an exceptionally high value of new starts, some of these periods 2x to 3x the normal rate of growth and a year or two longer duration than typical; late 2014, Jan-May 2015, Feb-Jun 2016 and again in Feb-Jul 2017. A large share of the cash flow, or monthly spending, from all those exceptional starts will occur in 2018 and 2019 and will drive spending to 10%+ gains.
Although starts are not tracked for Public vs Private, Highway, Educational, Environmental Public Works and Transportation make up more than 80% of all Public construction. Only Environmental Public Works starts are down. Educational, Transportation and Highway all have a positive outlook in new starts and predicted spending for 2018 which pushes public spending to post-recession highs.
Here’s how to use the Starts data and how it affects spending Construction Starts and Spending Patterns 9-26-17
Also, after New Starts, dollars are then tracked in Backlog, Backlog Construction Forecast Fall 2017 11-10-17
See the Spending Forecast Spending Summary Construction Forecast Fall 2017 12-2-17

Nonres Bldgs Construction Spending Midyear 2017 Forecast
7-24-17
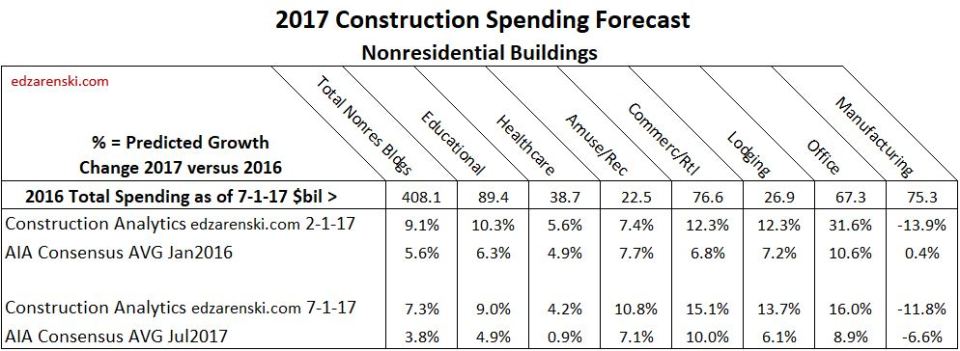
The AIA recently published the Nonresidential Buildings Consensus Forecast Midyear 2017 report. The consensus of seven firms projects spending growth for nonresidential buildings at 3.8% for 2017 and 3.6% for 2018. The largest growth in the AIA forecast for any building type for both years is 10% for 2017 Retail & Other Commercial. The highest reported total annual prediction from any firm is 4.4% for 2017 and 5.5% for 2018. AIA Midyear Consensus Report July 2017
Construction Analytics forecast for nonresidential buildings construction spending growth is +7.3% for 2017 and +10.7% for 2018. Growth in 2016 was 7.5%.
Year-to-date (YTD) spending for the 1st 5 months of 2017 is up +5.2%, led by Office and commercial, both near 15%. Estimate-to-complete (ETC) for the final 7 months is forecast at +8.1%. Total spending for Nonresidential Buildings in 2017 is forecast to increase 7.3% = $438 billion.
If spending were to slow to 3.8% growth for 2017, since YTD growth is already 5.2%, the rate of growth in the final 7 months would need to fall to only 2.4%. However, the predicted cash flow from construction starts shows very strong spending growth in the 2nd half 2017 and into 2018. Nonresidential Buildings construction starts for the last 12 months posted the highest average since 2007-2008. This is helping boost spending.
Outside of recession years, nonresidential buildings construction spending for the year dropped below 4% annual growth only twice in 24 years, since data has been tracked. In fact, right now spending needs to grow at 4.5% just to stay ahead of construction inflation. So any forecast of spending growth below 4.5% actually might suggest that construction is not expanding, but is contracting. All indications are that there are no recessionary effects right now and economic activity does not suggest we are headed for a non-recession low spending for nonresidential building construction. I don’t expect spending to drop to 4% growth for the next three years.
The pattern of nonresidential buildings construction starts for the last 30 months is indicating spending increases in the 2nd half of 2017 and is setting up 2018 for the highest ever starting backlog and record spending. Even if starts crash to zero growth for the remainder of the year, 2017 spending would drop by less than 1% and we still begin 2018 with record backlog.
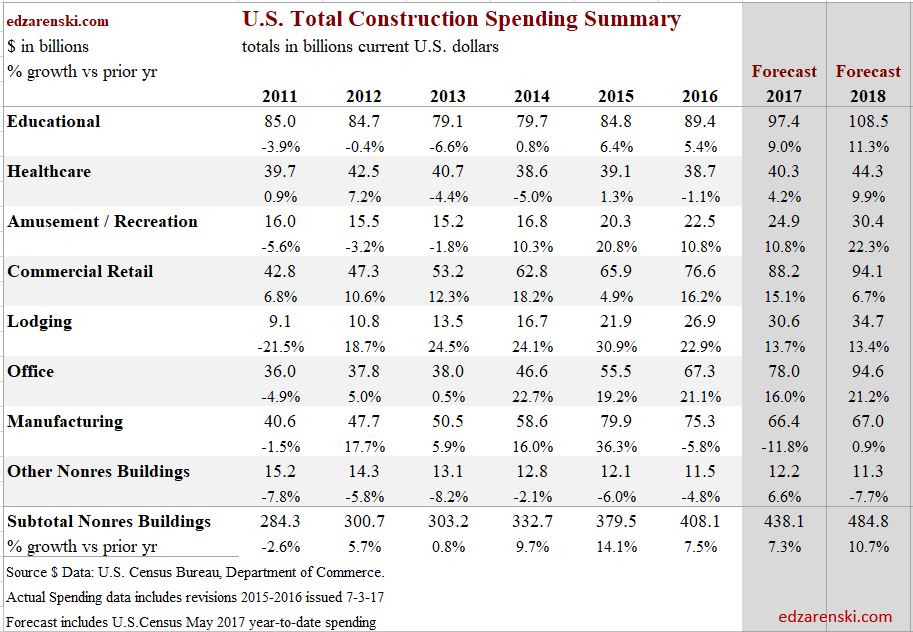
New Office construction starts for the last 12 months are the best ever recorded, on track to reach a total 50% growth over two years. Retail/Commercial starts have averaged year-over-year (YOY) growth of greater than 10%/year for the last three years. Educational starts averaged YOY growth of 8%/year for the last two years. These three markets comprise 60% of all nonresidential buildings. Healthcare starts have quietly increased to a record high over the last 12 months. Every market except manufacturing will finish 2017 with new starts totals near or at post recession highs. Manufacturing reached record high starts in 2014 and record spending in 2015. All construction starts $ data in this report references Dodge Data & Analytics starts data.
Construction spending for Commercial/Retail, Lodging and Office construction all remain very strong with 2017 total growth near 15%. Educational (+9%) and healthcare (+4%) both show sizable gains after years of little to no growth.
92% of all construction spending in 2017 is already in backlog projects.
A scenario that would have Office spending drop down to 8.9% annual growth from the track it is on today (+15.4% YTD) would require a highly improbable and unprecedented non-recessionary decline in spending in the remaining months of 2017. To grasp the enormity of the decline needed, it would take canceling 8% of all ongoing office projects or new starts for the remainder of the year would need to drop by 50%.

Educational will show an increase in YTD gains in the 3rd quarter because increasing spending in 2017 will be measured against the lowest quarter (3rdqtr) in 2016. Healthcare may not show sizable YTD gains until 4th quarter, for which 2016 reached lowest spending of the year and 2017 will reach highest.

Total nonresidential buildings spending growth accelerates to 10+% in 2018, led by institutional and office spending.
Nearly all nonresidential buildings construction starts in 2016 are still contributing to spending. Since originally posted they have been revised up by 16%. Since most spending from new starts (approximately 50%) occurs in the year following the start, early spending projections based on original posted starts $ may understate 2017 spending.

Nonresidential construction is comprised of two very different sectors, nonresidential buildings and non-building infrastructure. Infrastructure spending is quite erratic, while nonresidential buildings spending, with only slight variation, has been climbing at a strong steady pace for more than 4 years. Some analysts track nonresidential total spending, but these two sectors perform so differently it is important to break them apart to track trends. Buildings spending is up 2% from Q2’16 and up 5% YOY. In the 2nd half 2017 YOY spending is expected to reach 8% over the same months from 2016. Worthy of note is that non-building infrastructure spending, even though down slightly, just experienced two years of record highs. It will hold down the overall nonresidential total performance, but still finish 2017 near record highs.
See this article from February comparing my starting forecast compared to the Jan 2017 AIA Consensus Nonresidential Bldgs 2017 Forecasts Vary

Construction Backlog March 2017
3-20-17
Starting Backlog is the Estimate-to-Complete (ETC) value of all projects under contract at the beginning of the year. Projects in starting backlog could have started last month or last year or three years ago. The requirement is that those projects have not reached their end-date and some portion of the revenues generated by those projects is still ETC. The sum of all ETC represents current backlog.
A cash flow schedule of all ETC backlog and predicted new starts provides a tool to predict future spending. The $ reported here are the results of a cash flow analysis using Dodge Data & Analytics Construction Starts. Do keep in mind the DDA Starts value represents a survey of about 50% to 60% of the industry. While the percent change of values from year to year is relevant, the $ value does not compare directly to the actual spending $ values.
It is not enough to look at just the change in starts or the change in backlog to get an indication of the strength of the market. While continued growth in backlog is most important, the predicted cash flow from backlog and new starts is necessary for predicting future spending.

Nonresidential Buildings
The last time nonresidential buildings experienced a decline in starting backlog was 2013, Total construction spending on nonresidential buildings in 2013 registered a weak 0.8% gain. Since 2013, nonresidential buildings starting backlog is up 60%, reaching a new all-time high at the beginning of 2017. The previous high in 2009 was $241 billion. In 2016 it was $230 billion. For the start of 2017 it is $248 billion.
Revenues from starting backlog account for 75% of all nonresidential buildings construction spending within the year. If no new work started within the year, by year end there would be only 25% of the total in backlog needed to support the industry.
Not only is starting backlog higher coming into 2017, but also spending from backlog is predicted up by 5% and 2017 new starts are predicted up 8%. New starts are very strong in Office, Lodging, Educational, Healthcare and Amusement/Recreation.
This supports my predictions that 2017 will be another banner year for spending on nonresidential buildings, up a strong 10% from 2016. Similar growth is expected in 2018. This will produce a new high in current dollar spending, but will still be 15% below the constant $ all-time highs.

(edit 3-21-17 updated table)
Non-building Infrastructure
Non-building infrastructure experienced declines in starting backlog in 2012 and 2015. Fortunately, in both of those years, new starts were up. For the last eight years infrastructure starting backlog has been near $200 billion, +/- $10 billion. In 2008, the last pre-recession year, backlog stood at $178 billion. At the beginning of 2017, non-building infrastructure backlog is at an all-time high, $243 billion, up 36% from 2008. In the last two years starting backlog is up 20%.
Revenues from starting backlog account for 80% of all non-building infrastructure construction spending within the year. However, because infrastructure projects are long duration, only about 60% of total backlog gets spent within the year. If no new work started within the year, by year end there would still be 55% of the total in backlog needed to support the industry.
In 2016, although starting backlog was up, new starts were down and spending from backlog was also down. That cemented a decline in spending in 2016. New starts in 2016 declined for power, highway, transportation and public works, but due to long duration projects contributing to strong backlog in these markets, spending will be up in all except public works. New infrastructure starts in 2017 are predicted down 5%, but spending from backlog is predicted to increase by more than 10%, and that more than offsets the decline in new starts. 2017 will post a solid gain of 4% to reach a new high in spending and that is expected to increase again in 2018.
Residential Buildings
Residential new starts hit bottom in 2009 and starting backlog hit bottom in 2010. Residential on average has the shortest duration and new starts has a dramatic impact on the amount of available work. Both new starts and backlog are up about 300% from the lows. New residential starts have increased every year since the 2009 bottom, but are still lower than 2006.
Due to the shorter duration of projects, nearly 70% of residential spending within the year is generated from new starts. Unlike nonresidential, backlog does not contribute nearly as much. If no new work started within the year, within a matter of a few months there would be no backlog ETC left to support the industry.
Coming into 2017, starting backlog is up, and new starts are up and spending from new starts is up. But the rate of growth in new starts and spending from new starts is slowing. This is not unexpected after 4 years (2012-2015) of new starts growth averaging greater than 20%/year. The last two years it’s 12%/yr. This leads to a prediction of future spending increases ranging between 5% to 7% for the next two years.
See Also Behind The Headlines – Construction Backlog
Office Buildings Lead 2017 Construction Spending
New construction starts in 2016 for Office Buildings is setting up a very strong spending growth pattern for the next 2 years.

The five largest metropolitan areas comprise more than one third of total national new starts in commercial-multifamily construction. Total commercial-multifamily starts are up 7%. Commercial starts alone are up 11%. New starts for office projects increased more than 30% in 2016. The following percentages are growth in starts for new Office Buildings. Reference Dodge Data & Analytics New Commercial and Multifamily Construction Starts.
- New York City-Northern NJ-Long Island -2%, but from 2015 that was up 138%
- Los Angeles-Long Beach-Santa Ana +67%
- Chicago-Naperville-Jolliet +22%
- Washington DC-Arlington-Alexandria +87%
- Dallas-Fort Worth-Arlington +31%
Office construction starting backlog for 2017 (projects under contract as of Jan 1, 2017) is the highest in at least 8 years, more than double at the start of 2014 when the current growth cycle of office construction spending began. Also, the share of spending in 2017 from starting backlog is increasing.
Office spending since 2013 has increased every year by an average of more than 20%/year and is expected to continue or exceed that rate of growth in 2017.
Office construction spending reached a new all-time high in September 2016. Growth in office buildings will lead all 2017 commercial construction spending. Spending will be near +30% year over year growth for 2017 with total expected to come in at $91 billion.
Regardless what market fundamentals change for 2017, this work is already under contract and will be the driving force for 2017 nonresidential buildings spending.
See Also these related articles
Nonresidential Bldgs 2017 Forecasts Vary
Nonresidential Bldgs Construction Spending 2017
Behind The Headlines – Construction Backlog
Nonresidential Bldgs 2017 Forecasts Vary
2-5-7
The following table includes my 2017 growth forecast for construction spending in nonresidential buildings compared to the recently published AIA Consensus Forecast which includes individual forecasts from seven economists.
The AIA Jan. 2017 Nonresidential Consensus Forecast can be found here
My 2017 Nonresidential Buildings Spending Forecast can be found here
Construction Analytics (edzarenski.com) forecast is based primarily on scheduled cash flow of construction starts in backlog. About 75% to 80% of all nonresidential buildings construction spending in 2017 will be generated by projects that are already underway. Only 20% to 25% of all spending in 2017 will come from new projects that start in 2017.
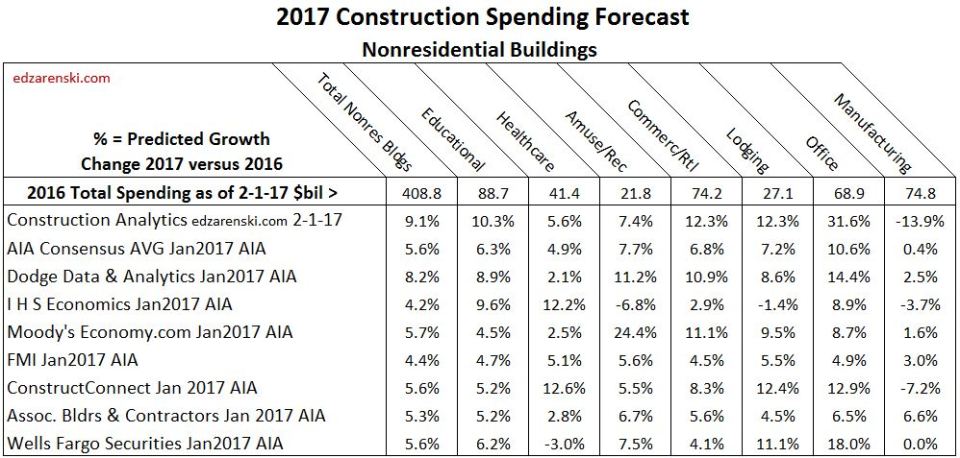
See my recent blog post on 2017 Starting Backlog here describes in part how I use backlog starts data to generate future spending forecast.
Nonresidential buildings 2017 starting backlog is 45% higher than at the start of 2014, the beginning of the current growth cycle. Spending in 2017 from that starting backlog has increased every year and it will be up 35% over 2014.
This comment I made two weeks ago in a post on Dodge Data 2016 Construction Starts helps explain in part the level of new starts in 2016 that established the pattern I see going into 2017:
“Nonresidential Building new starts in December remained consistent with October and November. Although well below the yearly highs reached in August and September, the final three months helped carry 2016 totals to an 8-year high. Nonresidential Buildings starts for the last six months averaged the highest since the 1st half of 2008.”
Nonresidential Buildings spending for 2016 totaled $409 billion, UP 8.1% from 2015.
Nonresidential Buildings spending in 2017 is forecast to increase to $447 billion, 9.1% over 2016.
The most recent 3-month average seasonally adjusted annual rate (SAAR) is already leading into 2017 starting at $420 billion only 5.5% below the peak in 2008. By midyear 2017 the SAAR will reach a new all-time high.
The widest variances between my forecast and the AIA panel forecasts are in Office, Manufacturing, Educational and Commercial. Here are explanations to support my forecast.
Office project starts at the end of the year increased more than 30% for 2016. Office construction 2017 starting backlog (projects under contract as of Jan 1, 2017) is the highest in at least 8 years, more than double at the start of 2014 when the current growth cycle of office spending began. More importantly, the share of spending from starting backlog is also increasing for 2017. This is setting up a very strong spending growth pattern for the next 2 years.
Manufacturing buildings new starts dropped 33% in 2015 and 38% in 2016. A disproportionately large portion of both 2015 & 2016 spending was generated from starts in 2014. In 2014, starts had jumped 80%+, but now almost all of that work is completed. For 2017, the amount of spending from starting backlog has dropped 25% from the level of 2016. Even an increase of 50% in new 2017 starts would not make up for that loss.
Educational buildings new starts increased 11% in 2016. But more important is that the total value of starting backlog has been increasing for several years. In 2015, the value of starting backlog increased only 5% over 2014. In 2016 it was 9% and in 2017 it is 13%. Even if new educational starts in 2017 decline by 10% to 20%, 2017 spending is being driven higher by the work already in backlog.
Commercial spending increased 11% in 2016. For 2017, spending from starting backlog will increase 10%, and starting backlog is at the highest level since pre-recession. In fact, spending from starting backlog will be 40% higher than 2014. Since starting backlog generates about 75% of spending within the year, most of the growth in 2017 is coming from very strong starting backlog.
Once again,”Simply referencing total backlog does not give a clear indication of spending within the next calendar year. The only way to know how much of total backlog that will get spent in the current year and following years is to prepare an estimated cash flow from start to finish for all the projects that have started in backlog.”
With few exceptions over the last three years, Construction Analytics, Dodge Data & Analytics and ConstructConnect have provided the most accurate forecasts. We’ll see in Feb. 1, 2018 how we all did when the total 2017 spending report gets released.
