Home » Posts tagged 'PPI' (Page 2)
Tag Archives: PPI
Construction PPI Excludes Imports and Tariffs
When assessing or tracking the pricing affect of tariffs on construction materials, you need to understand that the Producer Price Index (PPI) does not include imports (imports are not produced in the US) or tariffs. See items 4 and 24 in the FAQ provided by the Bureau of Labor Statistics. Construction PPI changes reflect pricing decisions domestic producers make on domestic products in reaction to tariffs on imported products. Tariffs have big impact on domestic prices.
BLS explanation of method and definitions
The price change we see in the PPI for construction materials reflects the domestic material prices of ALL other domestically produced materials used in the industry. While tariffs may affect only 10% of products used in the industry the PPI shows us the domestic producers reaction applied to the other 90%.
For example: Steel tariffs of +25% applied only on imported steel, affected only 30% (the imported share) of steel used in US. However the PPI shows us that all other domestically produced steel in the US and used in construction increased in price between 12% and 22% in 2018. Prices of domestic steel have receded somewhat, now ranging from +7% to +13%. But the point is that tariffs caused a price increase also in domestic steel.
AGC Tables of Construction PPI
The cost of ALL DOMESTIC steel mill products (of all types) produced in the US increased 18% in 2018 after the steel tariffs were imposed. That is domestic producers pricing response in reaction to tariffs. Tariffs impacted pricing decisions on all domestically produced products, not just the imported products. The increase has since receded but is still up 10%. Consumers pay the price.

Inflation and Forecasting Presentation Advancing Precon & Estm Conf 5-22-19
This is a PDF of slides (including notes) from my
Construction Inflation & Forecasting Presentation
at Hanson Wade
Advancing Preconstruction & Estimating Conference
Dallas, TX 5-22-19
Advancing Pre-construction & Estimating conference 2019
Full EdZ Presentation Inflation-Forecasting w notes HW-APE 5-22-19 PDF

PPI Construction Materials Inputs Index
2-20-18 original post
Feb 2019 Tables and Plots updated to end of 2018
Here’s the link to the June 2019 data
Here’s a link to the AGC APRIL 2020 summary report.
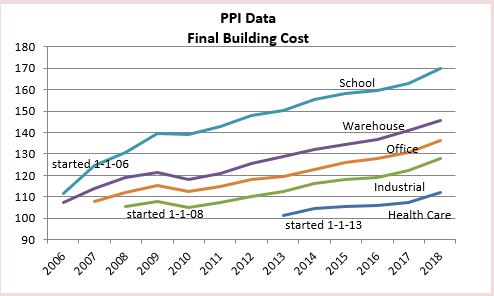
Producer Price Index of Materials Inputs to Construction. The 1st two plots are PPI Final Costs which includes all overhead and profit as sold. All other plots are PPI Input costs. Changes in PPI Input costs at the producer level may not reflect changes in actual pricing to contractors or changes in final cost as installed to building owner. Input Costs do not reflect retail markup or mark down and do not reflect overhead and profit markups that may change according to market activity.
PPI for Construction Inputs IS NOT a direct indicator of construction inflation. It does not represent selling price, the final cost of materials put-in-place which includes cost of labor, overhead and profit. See below link to description of Ovhd&Profit.
Cautions When Using PPI Inputs to Construction!
PPI Inputs and Inflation not only can vary widely but also may not even move in the same direction. See the above link for a table comparing PPI% vs Inflation%.

PPI Nonresidential Building Types
PPI Nonresidential Building Construction Sector — Contractors
Specific Building and Contractor PPI Indices are Final Demand or Selling Price indices. They are plotted above.
Bureau of Labor Statistics Producer Price Index measures PPI cost of materials price at producer level. The PPIs that constitute Table 9 of the BLS PPI Report measure changes in net prices for materials and supplies typically sold to the construction sector, but do not represent the final cost installed. They are known as PPI Inputs. They are plotted below.
PPI Materials and Supply INPUTS to Construction Industries
Here’s a brief summary of some of the PPI statistics tracked here:
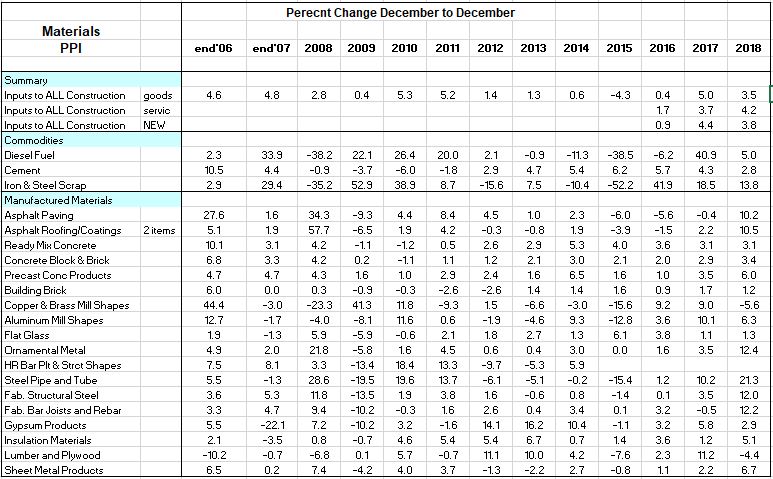
- One year (2018) change
- biggest increases > Steel Pipe and Tube 21%, Fabricated Steel for Bridges 15%, Ornamental Metals 12%, Fab Structural Steel for Buildings 12%
- biggest declines > Copper and Brass shapes -6%, Lumber and Plywood -4%
- PPI Final cost of buildings and Trades up 4% to 6%
- Final cost of buildings posted largest increases since 2008.
- Final cost of trades (except for Roofing) posted largest increases since 2009.
- Steel Products posted largest increases since 2008
- Lumber and Plywood, which had risen dramatically (+30%) earlier in the year, now down 4% from Dec ’17
- Two year (2017+2018) changes
- biggest increases > Diesel fuel 45%, Steel Pipe &Tube 31%, Aluminum Shapes 16%, Fabricated Structural Metal for Buildings 16%, Ornamental metals 16%
- no declines over a two year period
Most stable pricing over last 5 years, these items did not change by more than 5%/yr in any given year during the last 5 years and net the smallest total change for 5 years: Concrete Brick and Block, Concrete Pipe, Ready-Mix Concrete, Plastic Products, Insulation, Fabricated Steel Plate, Sand/Gravel/Crushed Stone.


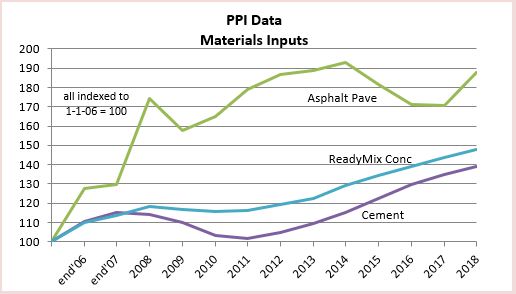
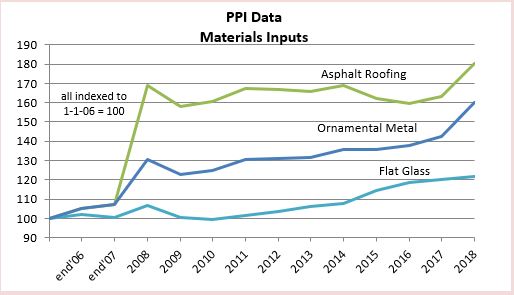
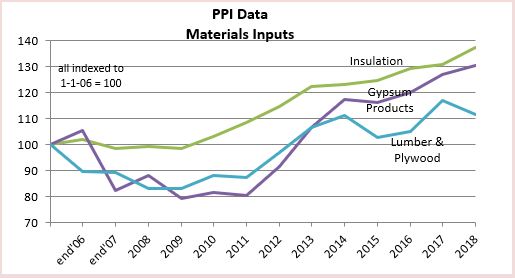


The Materials Inputs indices plots above are generated by indexing the December to December percent changes in the table below. Data updated to include Dec 2018 published January 2019.


Each month, @AGCofA @KenSimonson puts out tables and explanation of recent changes in producer price indexes and employment cost indexes for construction materials inputs, and building types and subcontractor final demand cost. Best source available. Watch this AGC page for monthly updates to the PPI
Here’s the link to the June 2019 data

2018 Construction Outlook Articles Index
Articles Detailing 2018 Construction Outlook
Links will open in a new tab
These links point to articles here on this blog that summarize end-of-year data for 2017 and present projections for 2018.

Most Recently Published
July Construction Starts Fall but 3moAvg at New High
Construction Spending June 2018 8-1-18
June Construction Starts Reach New Highs 7-25-18
Construction JOLTS – What’s wrong with this picture? 7-10-18
Construction Spending 2016-2017 Revisions 7-1-18
New Construction Starts May 2018 Near All-Time High 6-24-18
Construction Spending April 2018 – 6-1-18
Notes on March 2018 Construction Spending 5-2-18
Construction Activity Notes 4-25-18
2018 Construction Spending Forecast – Nonresidential Bldgs 3-28-18
2018 Construction Spending Forecast – Mar 2018
Construction Economics Brief Notes 3-10-18
Construction Spending is Back 3-9-18
Publicly Funded Construction 2-28-18
PPI Materials Input Index 2-20-18
Down the Infrastructure Rabbit Hole 2-16-18
Inflation in Construction 2018 – What Should You Carry? 2-15-18
Residential Construction Jobs Shortages 2-3-18
2018 Construction Spending – Briefs 1-26-18
Cautions When Using PPI Inputs to Construction! 1-15-18
Indicators To Watch For 2018 Construction Spending? 1-10-18
Spending Summary 2018 Construction Forecast Fall 2017 12-3-17
Backlog 2018 Construction Forecast Fall 2017 11-10-17
Starts Trends 2018 Construction Forecast Fall 2017 11-8-17
In What Category is That Construction Cost? 11-15-17
Construction Jobs / Workload Balance 11-7-17
Constant Dollar Construction Growth 11-2-17
Is Infrastructure Construction Spending Near All-Time Lows? 10-10-17
Summary
2018 Construction Spending Forecast – Mar 2018
2018 Construction Spending – Briefs 1-26-18
Spending Summary 2018 Construction Forecast Fall 2017 12-3-17
Construction Spending is Back 3-9-18
2017 Results
2018 Construction Spending Forecast – Mar 2018
Spending Summary 2018 Construction Forecast Fall 2017 12-3-17
2018 Starting Backlog & New Starts
2018 Construction Spending – Briefs 1-24-18
Backlog 2018 Construction Forecast Fall 2017 11-10-17
Starts Trends 2018 Construction Forecast Fall 2017 11-8-17
Construction Starts and Spending Patterns 9-26-17
2018 Spending Forecast
2018 Construction Spending Forecast – Mar 2018
2018 Construction Spending – Briefs 1-26-18
So, About Those Posts “construction spending declines…” 10-4-17
Construction Spending Almost Always Revised UP 5-1-17
Nonresidential Buildings
2018 Construction Spending Forecast – Nonresidential Bldgs 3-28-18
2018 Construction Spending Forecast – Mar 2018
2018 Construction Spending – Briefs 1-24-18
Nonres Bldgs Construction Spending Midyear 2017 Forecast 7-24-17
Residential
2018 Construction Spending Forecast – Mar 2018
Residential Construction Jobs Shortages 2-3-18
Infrastructure Outlook
2018 Construction Spending Forecast – Mar 2018
Down the Infrastructure Rabbit Hole 2-16-18
2018 Construction Spending – Briefs 1-24-18
Is Infrastructure Construction Spending Near All-Time Lows? 10-10-17
Infrastructure – Ramping Up to Add $1 trillion 1-30-17
Calls for Infrastructure Problematic 1-12-17
Public Construction
2018 Construction Spending Forecast – Mar 2018
Publicly Funded Construction 2-28-18
Spending Summary 2018 Construction Forecast Fall 2017 12-3-17
Infrastructure & Public Construction Spending 3-5-17
Materials
PPI Materials Input Index 2-20-18
Jobs
Residential Construction Jobs Shortages 2-3-18
Construction Jobs / Workload Balance 11-2-17
Construction Jobs Growing Faster Than Volume 5-5-17
Inflation
Inflation in Construction 2018 – What Should You Carry? 2-15-18
Constant Dollar Construction Growth 11-2-17
Construction Inflation Index Tables UPDATED 2-12-18
Construction Cost Inflation – Commentary updated 2-13-18
US Historical Construction Cost Indices 1800s to 1957

Cautions When Using PPI Inputs to Construction!
The Producer Price Index (PPI) for material inputs to construction gives us an indication whether costs for material inputs are going up or down. The PPI tracks producers’ cost to produce the product and supply finished products to retailers or contractors. However, that is far from the total cost from the contractor.
A good example is steel. The producer price for steel from the mill might be $750/ton for long beams and columns. The only increases captured at the producer level might be the changes in cost for raw material, energy to manufacture and the producers labor and markup. But the structural steel contractor is then responsible for delivery to shop, detailing, shop fabrication, transport to construction site, load and unload, cranes and welding equipment needed to install, installation crews and finally overhead and profit accounting for at least eight more points of potential cost change. Finally the steel subcontractor must then assess the market conditions, whether tight or favorable to higher profits, to adjust the bid price or selling price. The final cost of steel installed could be $3000/ton.
The PPI for Construction Inputs IS NOT a final indicator of construction inflation. It is an input to construction inflation. It does not represent the selling price, nor does it give any indication of the trend, up or down, of selling price.
In 2009 PPI for inputs was flat but construction inflation, as measured by final cost of buildings, was down 8% to 10%. In 2010, the PPI for construction inputs was up 5.3% but the selling price was flat. Construction inflation, based on several decades of trends, is approximately double consumer inflation. However, from mid-2009 to late 2012, that long-term trend did not hold up. During that period, PPI ranged from 0% to +6.8%, but construction inflation/deflation ranged from -10% to +2.3%, lower than PPI for all four years, something which seldom occurs. Construction inflation/deflation was primarily influenced by depressed bid margins, which had been driven lower due to diminished work volume.
The following table shows the differences between the PPI Inputs from 2011 to 2017 and the actual inflation for the major construction sectors. This table shows clearly that PPI Inputs and Inflation not only can vary widely but also may not even move in the same direction.

The PPI tables published by the Bureau of Labor Statistics do include several line items that represent Final Trades Cost or Whole Building Cost. Those PPI items don’t give us any details about the producer price or retail price of the materials used, but they do include all of the contractors costs incurred, including markups, on the final product delivered to the consumer, the building owner. I would note however that those line items in the PPI almost always show lower inflation than final Selling Price inflation indices developed separately from the PPI. Follow this link to table of inflation values which includes the PPI final cost for trades and buildings.
Construction Managers responsible for working with the client to manage project cost, part of which includes preparing a full building cost estimate, should not rely on PPI values as an indication of inflation. Selling price inflation indices are more appropriate indices to use to adjust project costs.
It is always important to carry the proper value for cost inflation. Whether adjusting the cost of a recently built project to predict what it might cost to build a similar project in the near future, or answering a client question, “What will it cost if I delay my project start?”, the proper value for inflation (which differs by sector and differs every year) can make or break your estimate.
Contractors responsible for a particular building material, although the PPI Inputs will not track market conditions sale prices from producer to the contractor, can get some indication of whether material prices are rising or falling. Contractors should be aware of PPI trends to interpret the data throughout the year.
PPI TRENDS HELP TO INTERPRET THE DATA
- 60% of the time, the highest increase of the year in the PPI is in the first quarter.
- 75% of the time, two-thirds of the annual increase occured in the first six months.
- In 25 years, the highest increase for the year has never been in Q4.
- 60% of the time, the lowest increase of the year in the PPI is in Q4.
- 50% of the time, Q4 is negative, yet in 25 years the PPI was negative only four times.
So when you see monthly news reports from the industry exclaiming, “PPI is up strong for Q1” or “PPI dropped in the 4th Qtr.” it helps to have an understanding that this may not be unusual at all and instead may be the norm.
PPI Construction Materials Inputs Index

Construction Inflation >>> LINKS
- 10-24-16 Originally posted
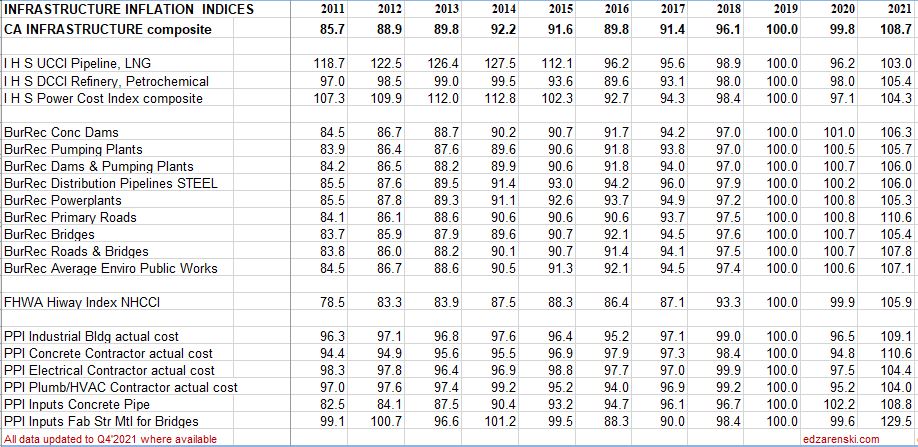
- 2-11-22 added INFRASTRUCTURE index table Q4 2021
This post is preserved for the multitude of LINKS back to sources of cost indices and for the explanation of the difference between Input indices and Output or Final Cost Indices. For all latest indices plots and table see the latest yearly Inflation post.
2-20-25 SEE Construction Inflation 2025
2-1-23 SEE Construction Inflation 2023
2-11-22 SEE Construction Inflation 2022
11-10-21 See 2021 Construction Inflation
See the article Construction Inflation 2020
Construction Cost Indices come in many types: Final cost by specific building type; Final cost composite of buildings but still all within one major building sector; Final cost but across several major building sectors (ex., residential and nonresidential buildings); Input prices to subcontractors; Producer prices and Select market basket indices.
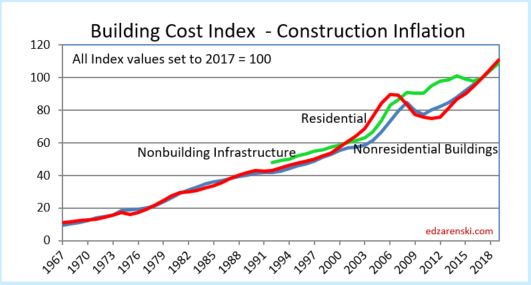
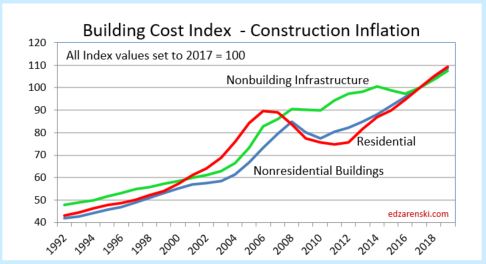
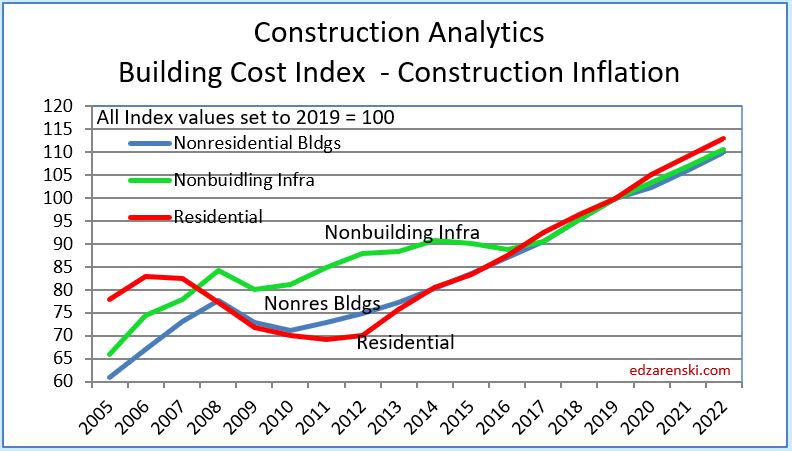
Residential, Nonresidential Buildings and Non-building Infrastructure Indices developed by Construction Analytics, (in highlighted BOLD CAPS in the tables below), are sector specific selling price (final cost) composite indices. These three indices represent whole building final cost and are plotted in Building Cost Index – Construction Inflation, see below, and also plotted in the attached Midyear report link. They represent average or weighted average of what is considered the most representative cost indicators in each major building sector. For Non-building Infrastructure, however, in most instances it is better to use a specific index to the type of work.
The following plots of Construction Analytics Building Cost Index are all the same data. Different time spans are presented for ease of use.
See the article Construction Inflation 2022
All actual index values have been recorded from the source and then converted to current year 2017 = 100. That puts all the indices on the same baseline and measures everything to a recent point in time, Midyear 2017.
All forward forecast values wherever not available are estimated and added by me.
Not all indices cover all years. For instance the PPI nonresidential buildings indices only go back to years 2004-2007, the years in which they were created. In most cases data is updated to include June 2019.
- June 2017 data had significant changes in both PPI data and I H S data.
- December 2017 data had dramatic changes in FHWA HiWay data.
SEE BELOW FOR TABLES
When construction is very actively growing, total construction costs typically increase more rapidly than the net cost of labor and materials. In active markets overhead and profit margins increase in response to increased demand. When construction activity is declining, construction cost increases slow or may even turn to negative, due to reductions in overhead and profit margins, even though labor and material costs may still be increasing.
Selling Price, by definition whole building actual final cost, tracks the final cost of construction, which includes, in addition to costs of labor and materials and sales/use taxes, general contractor and sub-contractor overhead and profit. Selling price indices should be used to adjust project costs over time.
quoted from that article,

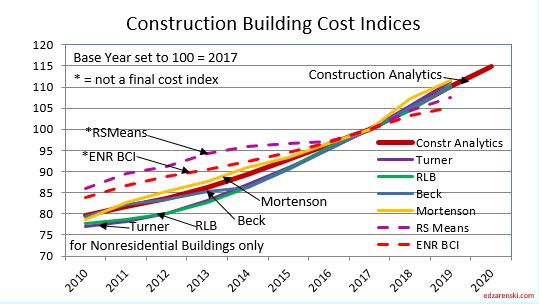
R S Means Index and ENR Building Cost Index (BCI) are examples of input indices. They do not measure the output price of the final cost of buildings. They measure the input prices paid by subcontractors for a fixed market basket of labor and materials used in constructing the building. ENR does not differentiate residential from nonresidential, however the index includes a quantity of steel so leans much more towards nonresidential buildings. RS Means is specifically nonresidential buildings only. These indices do not represent final cost so won’t be as accurate as selling price indices. RSMeans Cost Index Page RS Means subscription service provides historical cost indices for about 200 US and 10 Canadian cities. RSMeans 1960-2018 CANADA Keep in mind, neither of these indices include markup for competitive conditions. FYI, the RS Means Building Construction Cost Manual is an excellent resource to compare cost of construction between any two of hundreds of cities using location indices.
Notice in this plot how index growth is much less for ENR and RSMeans than for all other selling price final cost indices.
8-10-19 note: this 2010-2020 plot has been revised to include 2018-2020 update.
Turner Actual Cost Index nonresidential buildings only, final cost of building
Rider Levett Bucknall Actual Cost Index published in the Quarterly Cost Reports found in RLB Publications for nonresidential buildings only, represents final cost of building, selling price. Report includes cost index for 12 US cities and cost $/SF for various building types in those cities. Boston, Chicago, Denver, Honolulu, Las Vegas, Los Angeles, New York, Phoenix, Portland, San Francisco, Seattle, Washington,DC. Also includes cost index for Calgary and Toronto. RLB also publishes cost information for select cities/countries around the world, accessed through RLB Publications.
Mortenson Cost Index is the estimated cost of a representative nonresidential building priced in seven major cities and average. Chicago, Milwaukee, Seattle, Phoenix, Denver, Portland and Minneapolis/St. Paul.
Beck Biannual Cost Report in 2017 and earlier cost reports developed indices for six major U.S. cities and Mexico, plus average. In the most recent Summer 2021 report, while Beck provides valuable information on cost ranges for 30 different types of projects, the former inflation index is absent. Beck has not published city index values since 2017. Read the report for the trend in building costs. See discussion for Atlanta, Austin, Charlotte, Dallas/Fort Worth, Denver, Tampa and Mexico
Bureau of Labor Statistics Producer Price Index only specific PPI building indices reflect final cost of building. PPI cost of materials is price at producer level. The PPIs that constitute Table 9 measure changes in net selling prices for materials and supplies typically sold to the construction sector. Specific Building PPI Indices are Final Demand or Selling Price indices.
PPI Materials and Supply Inputs to Construction Industries
PPI Nonresidential Building Construction Sector — Contractors
PPI Nonresidential Building Types
PPI Materials Inputs and Final Cost Graphic Plots and Tables in this blog updated 2-10-19
PPI BONS Other Nonresidential Structures includes water and sewer lines and structures; oil and gas pipelines; power and communication lines and structures; highway, street, and bridge construction; and airport runway, dam, dock, tunnel, and flood control construction.
RS MEANS Key material cost updates quarterly
National Highway Construction Cost Index (NHCCI) final cost index, specific to highway and road work only.
The Bureau of Reclamation Construction Cost Trends comprehensive indexes for about 30 different types of infrastructure work including dams, pipelines, transmission lines, tunnels, roads and bridges. 1984 to present.
IHS Power Plant Cost Indices specific infrastructure only, final cost indices
- IHS UCCI tracks construction of onshore, offshore, pipeline and LNG projects
- IHS DCCI tracks construction of refining and petrochemical construction projects
- IHS PCCI tracks construction of coal, gas, wind and nuclear power generation plants
S&P/Case-Shiller National Home Price Index history final cost as-sold index but includes sale of both new and existing homes, so is an indicator of price movement but should not be used solely to adjust cost of new residential construction
US Census Constant Quality (Laspeyres) Price Index SF Houses Under Construction final cost index, this index adjusts to hold the build component quality and size of a new home constant from year to year to give a more accurate comparison of real residential construction cost inflation
TBDconsultants San Francisco Bay Area total bid index (final cost).
Other Indices not included here:
CoreLogic Home Price Index HPI for single-family detached or attached homes monthly 1976-2019. This is a new home and existing home sales price index.
Consumer Price Index (CPI) issued by U.S. Gov. Bureau of Labor Statistics. Monthly data on changes in the prices paid by urban consumers for a representative basket of goods and services, including food, transportation, medical care, apparel, recreation, housing. This index in not related at all to construction and should not be used to adjust construction pricing.
Jones Lang LaSalle Construction Outlook Report National Construction Cost Index is the Engineering News Record Building Cost Index (ENRBCI), a previously discussed inputs index. The report provides some useful commentary.
Sierra West Construction Cost Index is identified as a selling price index with input from 16-20 U.S. cities, however it states, “The Sierra West CCCI plays a major role in planning future construction projects throughout California.” This index may be a composite of several sectors. The link provided points to the description of the index, but not the index itself. No online source of the index could be found, but it is published in Engineering News Record magazine in the quarterly cost report update.
Leland Saylor Cost Index Clear definition of this index could not be found, however detailed input appears to represent buildings and does reference subcontractor pricing. But it could not be determined if this is a selling price index. A review of website info indicates almost all the work is performed in California, so this index may be regional to that area. Updated Index Page
DGS California Construction Cost Index CCCI The California Department of General Services CCCI is developed directly from ENR BCI. The index is the average of the ENR BCI for Los Angeles and San Francisco, so serves neither region accurately. Based on a narrow market basket of goods and limited labor used in construction of nonresidential buildings, and based in part on national average pricing, it is an incomplete inputs index, not a final cost index.
Vermeulens Construction Cost Index can be found here. It is described as a bid price index, which is a selling price index, for Institutional/Commercial/Industrial projects. That would be a nonresidential buildings sector index. No data table is available, but a plot of the VCCI is available on the website. Some interpolation would be required to capture precise annual values from the plot. The site provides good information.
CALTRANS Highway Cost Index Trade bids for various components of work and materials, published by California Dept of Transportation including earthwork, paving and structural concrete. Includes Highway Index back to 1972, quarterly from 2012.
Colorado DOT Construction Cost Index 2002-2019 Trade bids for various components of work published by Colorado Dept of Transportation including earthwork, paving and structural concrete.
Washington State DOT Construction Cost Index CCI for individual components or materials of highway/bridge projects 1990-2016
Minnesota DOT Highway Construction Cost Index for individual components of highway/bridge projects 1987-2016
Iowa DOT Highway Cost Index for individual components of highway/bridge projects 1986-2019
New Hampshire DOT Highway Cost Index 2009-2019 materials price graphs and comparison to Federal Highway Index.
New York Building Congress New York City Construction Costs compared to other US and International cities
U S Army Civil Works Construction Cost Index CWCCIS individual indices for 20 public works type projects from 1980 to 2050. Also includes State indices from 2004-2019
Eurostat Statistics – Construction Cost Indices 2005-2017 for European Countries
Comparative International Cities Costs – This is a comparative cost index comparing the cost to build in 40 world-wide cities If this International Cities Costs is a parity index, which involves correcting for difference in currency, then you must know the parity city in each country, which in the US I think is Chicago.
OECD International Purchasing Power Parity Index
Turner And Townsend International Construction Markets 2016-2017
Turner And Townsend International Construction Markets 2018
Rider Levitt Bucknall Caribbean Report 2018
US Historical Construction Cost Indices 1800s to 1957
Click Here for Link to Construction Cost Inflation – Commentary
2-12-18 – Index update includes revisions to historic Infrastructure data
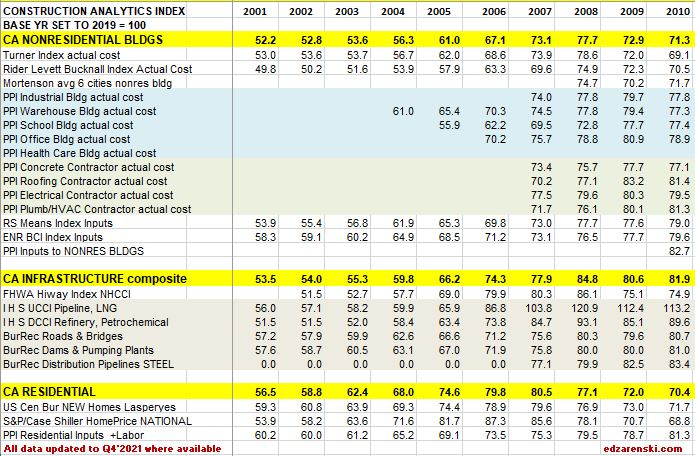
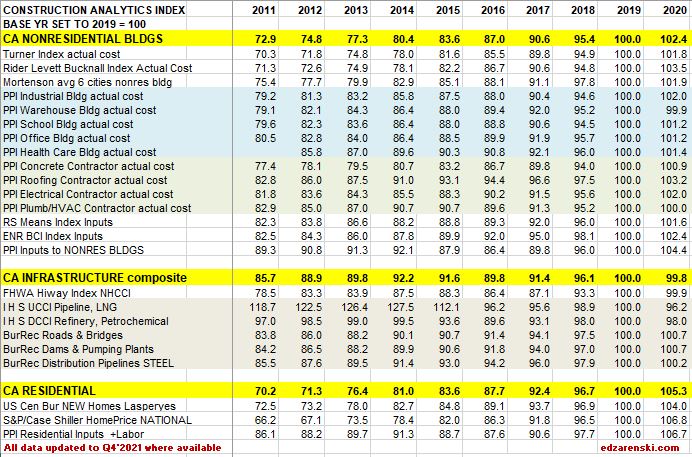
1-26-21 The tables below, from 2011 to 2020 and from 2015 thru 2023, updates 2020 data and provides 2021-2023 forecast.
NOTE, these tables are based on 2019=100. Nonresidential inflation, after hitting 5% in both 2018 and 2019, and after holding above 4% for the six years 2014-2019, is forecast to increase only 2.5% in 2020, but then 3.8% in 2021 and hold near that level the next few years. Forecast residential inflation for the next three years is level at 3.8%. It was only 3.6% for 2019 but averaged 5.5%/yr since 2013 and returned to 5.1% in 2020.
11-10-21 Follow the link at the bottom to 2021 Inflation
The Tables below 2001 to 2010 and 2011-2020 are updated to Q4 2021 with any revisions to past years posted on source websites.
The Table below 2015 to 2023 is updated to Q4 2021

How to use an index: Indexes are used to adjust costs over time for the affects of inflation. To move cost from some point in time to some other point in time, divide Index for year you want to move to by Index for year you want to move cost from. Example : What is cost inflation for a building with a midpoint in 2022, for a similar nonresidential building whose midpoint of construction was 2016? Divide Index for 2022 by index for 2016 = 110.4/87.0 = 1.27. Cost of building with midpoint in 2016 x 1.27 = cost of same building with midpoint in 2022. Costs should be moved from/to midpoint of construction. Indices posted here are at middle of year and can be interpolated between to get any other point in time.
All forward forecast values, whenever not available, are estimated by Construction Analytics.
2-13-23 Construction Inflation 2023

Construction Cost Inflation – Commentary 2019
1-28-20 See the new post Construction Inflation 2020
8-10-19 updated plots and commentary
General construction cost indices and Input price indices that don’t track whole building final cost do not capture the full cost of escalation in construction projects. To properly adjust the cost of construction over time you must use actual final cost or selling price indices.
Click Here for Link to a 20year Table of 25 Indices
Inflation in construction acts differently than consumer inflation. When there is more work available, inflation increases. When work is scarce, inflation declines. A very large part of the inflation is margins, wholesale, retail and contractor. When nonresidential construction was booming from 2004 through 2008, nonresidential final price inflation averaged almost 8%/year. This was at a time when input costs were averaging between 5% and 6%/year. When residential construction boomed from 2003 to 2005, inflation in that sector was 10%/year. But from 2009 through 2012 we experienced deflation, the worst year being 2009. Residential construction experienced a total of 17% deflation from 2007 through 2011. From 2008 to 2010, nonresidential buildings experienced 10% deflation in two years.
The following plots are all the same data. Different time spans are presented for ease of use.
8-10-19 note: this 2005-2020 plot has been revised to include 2018-2020 update.
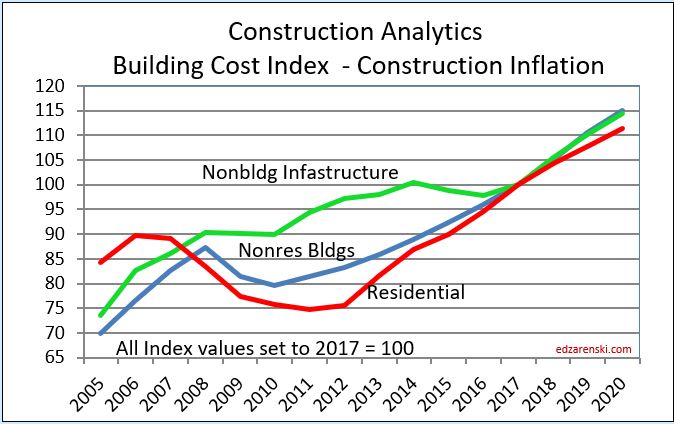
Nonresidential Buildings – Since 1993, the 25-year long-term annual construction inflation has averaged 3.5%, even when including the recessionary period 2007-2011. Long-term average inflation, without recessionary declines, is 4% for 20 non-recessionary years since 1993. During rapid growth period of 5 years from 2004-2008, inflation averaged 8% per year. Since 2011, nonresidential buildings inflation has averaged 3.8%, averaging 4.25%/yr. for the last 4 years with a high of 5.1% in 2018.
Residential, from 2007- 2011 experienced 5 consecutive years of deflation, down 20%. In the 4-year boom just prior to that, 2003-2006, inflation averaged 9% per year. Residential inflation snapped back to 8.0% in 2013. It slowed to 4.4% in 2018 but has averaged over 5% for the last three years.
Construction Spending growth posted two separate 4-year periods of 40%+ growth, up 41% in 2012-2015 and up 40% in 2013-2016, exceeding the growth during the closest similar four-year periods 2003-2006 (+37%) and 1996-1999 (+36%), which were the two fastest growth periods on record with the highest rates of inflation and productivity loss. Growth peaked at +11%/year in 2014 and 2015, exceeded only slightly by 2004-2005.
Spending growth slowed to 7.0% in 2016 and only 4.5% in 2017. In 2018, spending dropped to a gain of only 3.3%. It’s expected, after revisions that 2019 spending will finish at a gain of less than 2%.
Producer Price Index (PPI) Material Inputs (excluding labor) costs to new construction increased +4% in 2018 after a downward trend from +5% in 2011 led to decreased cost of -3% in 2015, the only negative cost for inputs in the past 20 years. Input costs to nonresidential structures in 2017+2018 average +4.2%, the highest in seven years. Infrastructure cost are up near 5% and single-family residential inputs are up 4%. But material inputs accounts for only a portion of the final cost of constructed buildings.
Labor input is currently experiencing cost increases. When there is a shortage of labor, contractors may pay a premium to keep their workers. All of that premium may not be picked up in wage reports. Also, some of the labor inflation is due to lost productivity due to less skilled workforce. Unemployment in construction is the lowest on record. There is some sign of jobs growth slowing down in Q2 and Q3 2019, and potentially getting slower.
Nationally tracked indices for residential, nonresidential buildings and non-building infrastructure vary to a large degree. When the need arises, it becomes necessary that contractors reference appropriate sector indices to adjust for whole building costs.
Click Here for Link to a Table of 25 Index Values
ENRBCI and RSMeans input indices are prefect examples of commonly used indices that DO NOT represent whole building costs, yet are widely used to adjust project costs. An estimator can get into trouble adjusting project costs if not using appropriate indices. The two input indices for nonresidential buildings did not decline during the 2008-2010 recession. All other final cost indices dropped 6% to 10%.
From 2010 to 2019, total final price inflation is 110/80 = 1.38 = +38%. Input cost indices total only 106/85 = 1.25 = +25%, missing a big portion of the cost growth over time.
CPI, the Consumer Price Index, tracks changes in the prices paid by urban consumers for a representative basket of goods and services, including food, transportation, medical care, apparel, recreation, housing. This index in not related at all to construction and should never be used to adjust construction pricing. Historically, Construction Inflation is about double the CPI. However for the last 5 years it averages 3x the CPI.
Taking into account the current (Jan 2018 12 mo) CPI of 2% and the most recent 5 years ratio, along with accelerated cost increases in labor and material inputs and the high level of activity in markets, I would consider the following forecasts for 2018 inflation as minimums with potential to see higher rates than forecast.
Residential construction, from 2007- 2011, experienced five consecutive years of deflation, down 20%. In the 4-year boom just prior to that, 2003-2006, inflation averaged +9% per year. Residential construction inflation saw a slowdown to only +3.5% in 2015. However, the average inflation for five years from 2013 to 2017 is 6%. It peaked at 8% in 2013. It climbed back over 5% for 2016 and reached 5.8% in 2017. For 2018, residential final cost inflation indexes are up only 4.5%. Residential construction inflation for 2019 is now about 4% to 4.5%.
A word about Hi-Rise Residential. About 95% of the cost of a hi-rise residential building would remain the same whether the building was for residential or nonresidential use. This type of construction is totally dis-similar to low-rise residential, which in large part is stick-built single family homes. Therefore, a more appropriate index to use for hi-rise residential construction is the nonresidential buildings cost index.
Nonresidential Buildings inflation, during the rapid growth period of five years from 2004-2008, averaged 8% per year. Inflation averaged near 4% per year for the 4 years 2014-2017.
Several Nonresidential Buildings Final Cost Indices averaged over 5% per year for the last 2 years and over 4% per year for the last 5 years. Nonresidential buildings inflation totaled 22% in the last five years. Input indices that do not track whole building cost would indicate inflation for those four years at only 12%, much less than real final cost growth. For a $100 million project escalated over those four years, that’s a difference of $8 million, potentially underestimating cost.
Nonresidential buildings spending slowed from 2017 to 2019 but is now entering a phase in which it may reach the fastest rate of growth in three years, which historically leads to accelerated inflation. Construction inflation for nonresidential buildings for 2018 and 2019 was 5%/yr. For 2020 expect 4.25%, rather than the long term average of 3.5% to 4.0%.
Non-building infrastructure indices are so unique to the type of work that individual specific infrastructure indices must be used to adjust cost of work. The FHWA highway index increased 17% from 2010 to 2014, stayed flat from 2015-2017, then increased 6%+ in 2018. The Highway index for 2019 is up about 6%. The IHS Pipeline and LNG indices increased in 2018 but are still down 20% since 2014. Coal, gas, and wind power generation indices have gone up only 6% in seven years. Refineries and petrochemical facilities have dropped 5% in 4 years but 2018 regained the level of 2013. Input costs to infrastructure are down slightly from the post recession highs, but most have increased in the last year. Input cost to Highways are up 5.0% and to the Power sector are up 3.6% in 2018. Work in Transportation and Pipeline projects has increased dramatically in 2017 and 2018.
Infrastructure power indices registered 2.5% to 3.5% gains in 2017 and again in 2018. Highway indices increased 6.6% in 2018. Anticipate 4% inflation for Power sector and at least 5%-6% inflation for Highway in 2019 with the potential to go higher in rapidly expanding markets, such as pipeline or highway.
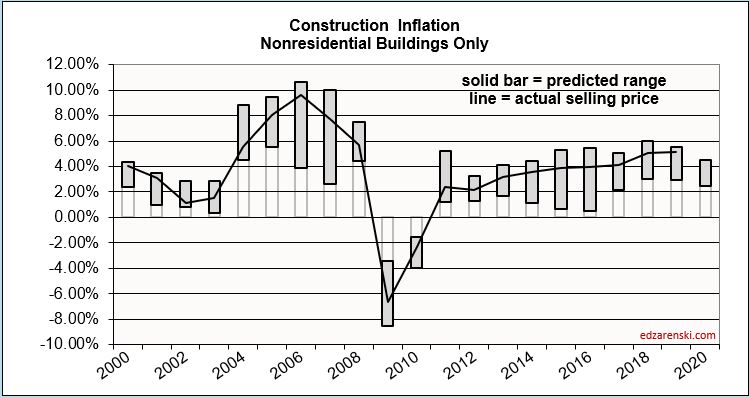
This plot for nonresidential buildings only shows bars representing the predicted range of inflation from various sources with the line showing the composite final cost inflation. Note that although 2015 and 2016 have a low end of predicted inflation of less than 1%, the actual inflation is following a pattern of growth above 4%. The low end of the predicted range is almost always established by input costs, while the upper end of the range and the actual cost are established by selling price indices.
8-10-19 note: this 2005-2020 plot has been revised to include 2018-2020 update.
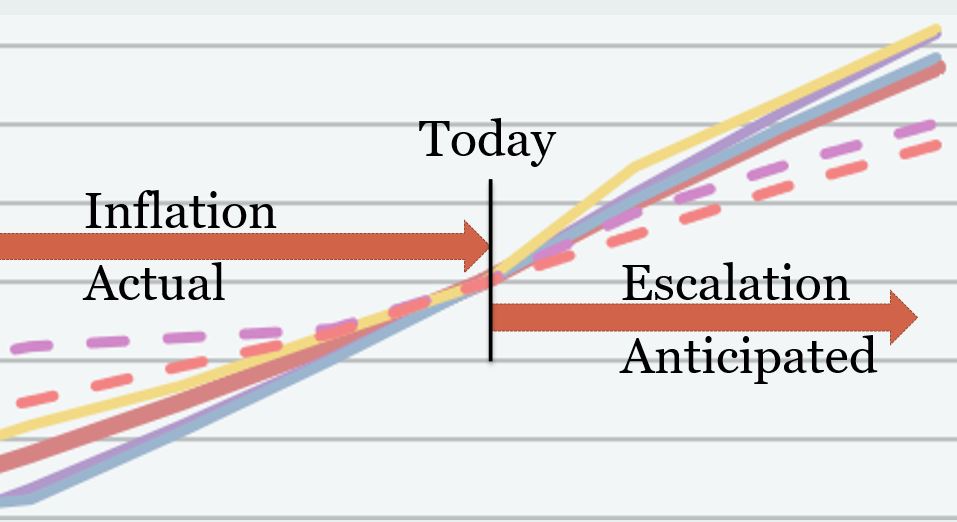
A word about terminology: Inflation vs Escalation. These two words, Inflation and Escalation, both refer to the change in cost over time. However escalation is the term most often used in a construction cost estimate to represent anticipated future change, while more often the record of past cost changes is referred to as inflation. Keep it simple in discussions. No need to argue over the terminology, although this graphic might represent how most owners and estimators reference these two terms.
In every estimate it is always important to carry the proper value for cost inflation. Whether adjusting the cost of a recently built project to predict what it might cost to build a similar project in the near future or adding an escalation factor to the summary of an estimate for a project with a midpoint 2 years out, or answering a client question, “What will it cost if I delay my project start by one year?”, whether you carry the proper value for escalation can make or break your estimate.
- Long term construction cost inflation is normally about double consumer price inflation (CPI).
- Since 1993 but taking out 2 worst years of recession (-8% to -10% total for 2009-2010), the 20-year average inflation is 4.2%.
- Average long term (30 years) construction cost inflation is 3.5% even with any/all recession years included.
- In times of rapid construction spending growth, construction inflation averages about 8%.
- Nonresidential buildings inflation has average 3.7% since the recession bottom in 2011. It averaged 4.6% for the 4 years 2016-2019.
- Residential buildings inflation reached a post recession high of 8.0% in 2013 but dropped to 3.5% in 2015. It averaged 4.6% for the 4 years 2016-2019, but is at the low point of 3.3% in 2019.
- Although inflation is affected by labor and material costs, a large part of the change in inflation is due to change in contractors/suppliers margins.
- When construction volume increases rapidly, margins increase rapidly.
- Construction inflation can be very different from one major sector to the other and can vary from one market to another. It can even vary considerably from one material to another.
Click Here for Link to a Table of 25 Index Values

Construction Inflation Cost Index
Note: The post you’ve reached here was originally written in Jan 2016. For the latest information follow this link to the newest data on Inflation. 8-15-19
ESCALATION / INFLATION INDICES
Thank You. edz
Jan. 31, 2016
Construction inflation for buildings in 2016-2017 is quite likely to advance stronger and more rapidly than some estimators and owners have planned.
Long term construction cost inflation is normally about double consumer price inflation. Construction inflation in rapid growth years is much higher than average long-term inflation. Since 1993, long-term annual construction inflation for buildings has been 3.5%/yr., even when including the recessionary period 2007-2011. During rapid growth periods, inflation averages more than 8%/yr.
For the period 2013-2014-2015, nonresidential buildings cost indices averaged just over 4%/yr. and residential buildings cost indices average just over 6%/yr. I recommend those rates as a minimum for 2016-2017. Some locations may reach 6% to 8% inflation for nonresidential buildings but new work in other areas will remain soft holding down the overall average inflation. Budgeting should use a rate that considers how active work is in your area.
Infrastructure projects cost indices on average have declined 4% in the last three years. However, infrastructure indices are so unique that individual specific indices should be used to adjust cost of work. The FWHA highway index dropped 4% in 2013-2014 but increased 4% in 2015. The IHS power plant cost index gained 12% from 2011-2014 but then plummeted in 2015 to an eight year low. The PPI industrial structures index and the PPI other nonresidential structures index both have been relatively flat or declining for the last three years.
These infrastructure sector indices provide a good example for why a composite all-construction cost index should not be used to adjust costs of buildings. Both residential and infrastructure project indices often do not follow the same pattern as cost of nonresidential buildings.
Anticipate construction inflation of buildings during the next two years closer to the high end rapid growth rate rather than the long term average.

Construction Inflation
LINK to most recent articles on inflation 2019
11-17-2015
( Also See 1-31-2016 comments and chart on inflation )
Over the last 24 months work volume has increased and short-term construction inflation has increased to more than double consumer inflation. It appears construction inflation is already advancing faster than and well ahead of consumer inflation, which supports that consumer inflation is not an indication of movements or magnitude of construction inflation.
It is always important to carry the proper value for cost inflation. Whether adjusting the cost of a recently built project to predict what it might cost to build a similar project in the near future or answering a client question “What will it cost if I delay my project start by one year?”, whether you carry the proper value for inflation (which can differ every year) can make or break your estimate.
- Long term construction cost inflation is normally about double consumer price inflation (CPI).
- Since 1993 but taking out 2 years of recession (-8%), the 20-year average inflation is 4.2%.
- Average long term (30 years) construction cost inflation is 3.5% even with any/all recession years included.
- In times of rapid construction spending growth, construction inflation averages about 8%.
- Although inflation is affected by labor and material costs, a large part of the change in inflation is due to change in contractors/suppliers margins.
- When construction volume increases rapidly, margins increase rapidly.
- Construction inflation can be very different from one major sector to the other and can vary from one market to another. It can even vary considerably from one material to another.
In the 5 years of rapid growth in spending for nonresidential buildings from 2004 through 2008, nonresidential buildings cost inflation totaled 39%, or averaged ~8% per year.
In the 6 years of spending during the residential construction boom from 2000 through 2005, residential building cost inflation totaled 47%, or averaged ~8% per year.
Neither the producer price index (PPI) for construction inputs nor the CPI are good indicators of total construction cost inflation.
Some construction cost indices include only the cost changes for a market basket of labor and materials and do not include any change for margins. Those indices are not a complete analysis of construction cost inflation.
Construction cost inflation must include all changes related to labor wages, productivity, materials cost, materials availability, equipment and finally contractors margins. Margins are affected by the volume growth of new work and demand for new buildings. So be sure to verify what is included in any cost index you reference for real construction cost inflation.
For the last three years residential construction inflation has averaged 5.7% and nonresidential buildings inflation has averaged 4.2%. Nonresidential buildings cost inflation has increased for five consecutive years. Both are likely to increase next year since anticipated volume in both sectors will grow next year.
In my construction spending data set, which goes back to 1993, there were six years with greater than 9% spending growth. By far the largest spending growth years were 2004 and 2005, 11.2% and 11.5%. We are about to repeat that historic level of spending growth. I am predicting 2015 will finish with growth of 11.6% and 2016 will experience 11% growth.
(8-12-16) 2015 finished at 10.6% because 2014 was revised up. Construction spending for 2016 will probably finish closer to 8%.
I expect historic levels of growth in spending will be accompanied by inflation relative to historic high growth periods. Don’t expect long term average inflation in high growth periods. Don’t be caught short in your construction cost budgets!
Graphic updated 1-8-16
The chart shows the low and high range of various independent nonresidential buildings construction actual cost indices. In 2015, the range of estimates was from 2% to 5%. The actual inflation came in at 4%. The plotted line is my result of where inflation actually ended up. A chart for residential construction would show much different values.

( Also See 1-31-2016 comments and chart on inflation )
