Home » Forecast (Page 12)
Category Archives: Forecast

Nonres Bldgs Construction Spending Midyear 2017 Forecast
7-24-17
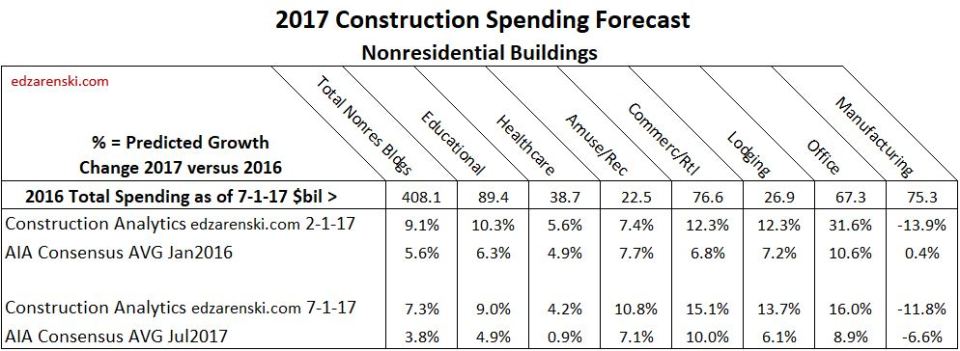
The AIA recently published the Nonresidential Buildings Consensus Forecast Midyear 2017 report. The consensus of seven firms projects spending growth for nonresidential buildings at 3.8% for 2017 and 3.6% for 2018. The largest growth in the AIA forecast for any building type for both years is 10% for 2017 Retail & Other Commercial. The highest reported total annual prediction from any firm is 4.4% for 2017 and 5.5% for 2018. AIA Midyear Consensus Report July 2017
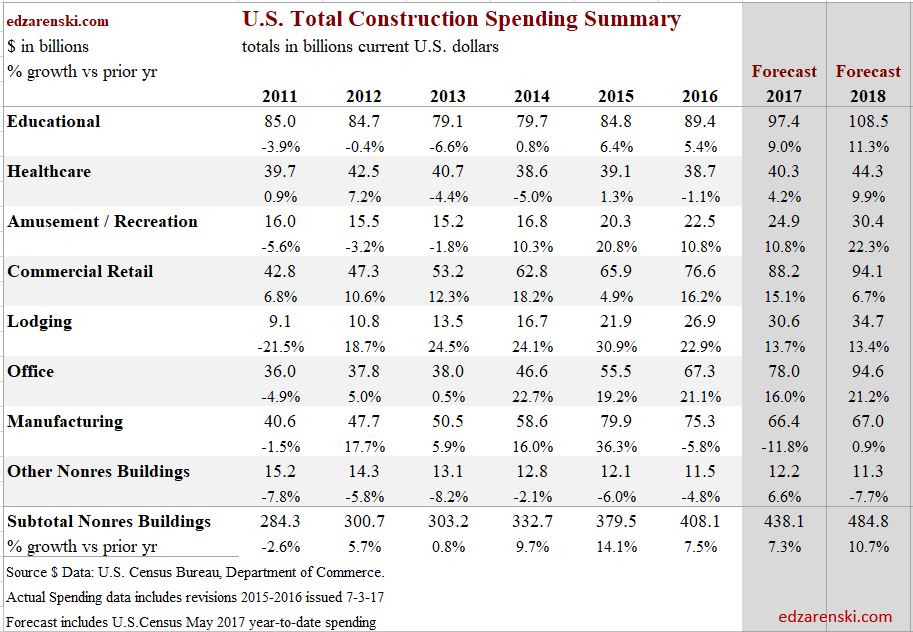
Construction Analytics forecast for nonresidential buildings construction spending growth is +7.3% for 2017 and +10.7% for 2018. Growth in 2016 was 7.5%.
Year-to-date (YTD) spending for the 1st 5 months of 2017 is up +5.2%, led by Office and commercial, both near 15%. Estimate-to-complete (ETC) for the final 7 months is forecast at +8.1%. Total spending for Nonresidential Buildings in 2017 is forecast to increase 7.3% = $438 billion.
If spending were to slow to 3.8% growth for 2017, since YTD growth is already 5.2%, the rate of growth in the final 7 months would need to fall to only 2.4%. However, the predicted cash flow from construction starts shows very strong spending growth in the 2nd half 2017 and into 2018. Nonresidential Buildings construction starts for the last 12 months posted the highest average since 2007-2008. This is helping boost spending.
Outside of recession years, nonresidential buildings construction spending for the year dropped below 4% annual growth only twice in 24 years, since data has been tracked. In fact, right now spending needs to grow at 4.5% just to stay ahead of construction inflation. So any forecast of spending growth below 4.5% actually might suggest that construction is not expanding, but is contracting. All indications are that there are no recessionary effects right now and economic activity does not suggest we are headed for a non-recession low spending for nonresidential building construction. I don’t expect spending to drop to 4% growth for the next three years.
The pattern of nonresidential buildings construction starts for the last 30 months is indicating spending increases in the 2nd half of 2017 and is setting up 2018 for the highest ever starting backlog and record spending. Even if starts crash to zero growth for the remainder of the year, 2017 spending would drop by less than 1% and we still begin 2018 with record backlog.
New Office construction starts for the last 12 months are the best ever recorded, on track to reach a total 50% growth over two years. Retail/Commercial starts have averaged year-over-year (YOY) growth of greater than 10%/year for the last three years. Educational starts averaged YOY growth of 8%/year for the last two years. These three markets comprise 60% of all nonresidential buildings. Healthcare starts have quietly increased to a record high over the last 12 months. Every market except manufacturing will finish 2017 with new starts totals near or at post recession highs. Manufacturing reached record high starts in 2014 and record spending in 2015. All construction starts $ data in this report references Dodge Data & Analytics starts data.
Construction spending for Commercial/Retail, Lodging and Office construction all remain very strong with 2017 total growth near 15%. Educational (+9%) and healthcare (+4%) both show sizable gains after years of little to no growth.
92% of all construction spending in 2017 is already in backlog projects.
A scenario that would have Office spending drop down to 8.9% annual growth from the track it is on today (+15.4% YTD) would require a highly improbable and unprecedented non-recessionary decline in spending in the remaining months of 2017. To grasp the enormity of the decline needed, it would take canceling 8% of all ongoing office projects or new starts for the remainder of the year would need to drop by 50%.

Educational will show an increase in YTD gains in the 3rd quarter because increasing spending in 2017 will be measured against the lowest quarter (3rdqtr) in 2016. Healthcare may not show sizable YTD gains until 4th quarter, for which 2016 reached lowest spending of the year and 2017 will reach highest.

Total nonresidential buildings spending growth accelerates to 10+% in 2018, led by institutional and office spending.
Nearly all nonresidential buildings construction starts in 2016 are still contributing to spending. Since originally posted they have been revised up by 16%. Since most spending from new starts (approximately 50%) occurs in the year following the start, early spending projections based on original posted starts $ may understate 2017 spending.

Nonresidential construction is comprised of two very different sectors, nonresidential buildings and non-building infrastructure. Infrastructure spending is quite erratic, while nonresidential buildings spending, with only slight variation, has been climbing at a strong steady pace for more than 4 years. Some analysts track nonresidential total spending, but these two sectors perform so differently it is important to break them apart to track trends. Buildings spending is up 2% from Q2’16 and up 5% YOY. In the 2nd half 2017 YOY spending is expected to reach 8% over the same months from 2016. Worthy of note is that non-building infrastructure spending, even though down slightly, just experienced two years of record highs. It will hold down the overall nonresidential total performance, but still finish 2017 near record highs.
See this article from February comparing my starting forecast compared to the Jan 2017 AIA Consensus Nonresidential Bldgs 2017 Forecasts Vary

Construction Spending Midyear 2017 Summary
7-11-17
Construction Spending Summary for May Spending
Year-to-date % growth in construction spending for 1st five months and expected estimate-to-complete (ETC) % growth for remaining seven months 2017. Total % growth vs 2016 and 2017 total $.
Total All Construction
YTD = +6.1%, ETC = +7.0%, 2017vs/2016 = 6.7%, 2017 total = $1.266 trillion
Particular strength is evident in the long term trend for Nonresidential Buildings for which spending growth is increasing and continues into 2018. Recently, all of 2016 spending was revised, in total up by 2%. Current 2017 values are being compared to revised 2016 values. History shows revisions have been up 45 of last 48 months. In the future, 2017 spending will most likely be revised higher. Even without that, at 6.7% total growth expected, 2017 will come in stronger than 2016. All sectors show some improvement over 2016. For 2018, Nonresidential Buildings and Infrastructure both contribute to an 7.8% forecast spending increase.


Also See Construction Spending May 2017 – Behind The Headlines
Residential Buildings
YTD = +12.2%, ETC = +9.3%, 2017vs2016 = +10.5%, 2017 total = $523 billion
Residential spending YTD has been above 12% each of the 1st 5 months of 2017. It is expected to dip between May and October due to a low volume of work contributed from starts during the period Q4’15 to Q1’16. This results in a temporary dip in spending. We could see annual spending averaging only $515b to $525b from April through September. New starts in Q1’17 reached an 11 year high, so spending increases later in the year. Residential work will finish the year with 10% growth, the 5th consecutive year over 10%. Average growth the last 5 years is 14%. Spending slows to 5% growth in 2018 .
Nonresidential Buildings
YTD = +5.2%, ETC = +7.5%, 2017vs2016 = +7.4%, 2017 total = $438 billion
Nonresidential Buildings spending is expected to increase slightly from May through September due to an above average volume of work contributed from starts during the period Q1’15 to Q2’15. The only major nonresidential building in decline this year is manufacturing. That’s not unexpected since manufacturing spending reached an all-time high in 2015 and stayed close to that level in 2016. Commercial/Retail, Lodging and Office construction all remain very strong with growth near 15%. Educational (+9%) and healthcare (+6%) both show sizable gains after years of little to no growth. Growth accelerates to 10+% in 2018, led by institutional spending.
See Also Nonres Bldgs Construction Spending Midyear 2017 Forecast
Non-building Infrastructure
YTD = -3.0%, ETC = +1.4%, 2017vs/2016 = 0.0%, 2017 total = $304 billion
Non-building Infrastructure spending, always the most volatile sector, is expected to increase slightly in the 2nd half 2017. An above average volume of work in early 2015 contributed very long duration jobs that will still contribute spending in late 2017, adding to normal average duration spending. Environmental Public Works (Sewer, Water Supply and Dams & Rivers) is holding back infrastructure from gains in 2017. Declines in that group are offsetting gains in Power, Highway and Transportation. No future growth is included from infrastructure stimulus and yet 2018 is projected to increase by 7%.

Construction Spending May 2017 – Behind The Headlines
7-6-17 Construction Spending May 2017 – Behind The Headlines
See Also Construction Spending Summary 7-11-17
Headline – Construction Spending for May came in flat compared to April, up 4.5% vs May 2016.
In this latest May report, April spending was revised up by 1% and May 2016 was revised up by 3%. The average revision since Jan 2016 is 3%/month. May 2017 will be revised in each of the next two reports and again with the May report issued in July 2018.
Current unadjusted construction spending is always being compared to previous months revised spending and growth is almost always being understated. Spending has been revised UP 45 times in the last 4 years.
In 2016, the 1st report indicated monthly spending declined 8 times from the previous month. After revisions, spending declined only twice from the previous month. Most MSM articles declaring construction spending was a miss are revised away in following months.

Nonresidential Construction Spending Remains Stagnant in May.
I’ve said this before many times, spending predictions are best tracked based on cash flows from all projects that have started. This is not simply tracking total backlog, nor is it tracking new construction starts. New starts (new backlog) represent only 20% to 25% of total spending within the year. Most spending comes from projects that started in previous years.
Big monthly changes in spending come from unusual fluctuations in starts. Very large projects ending (spending ending), compared to new projects starting, would cause a monthly drop in spending. The reverse would cause an increase. If a record volume month of construction projects that started two or three years ago are now reaching completion, and new starts today are experiencing normal growth not at record levels, then spending will most likely decline temporarily. Most monthly construction spending predictions are predetermined months ago.
Also, Nonresidential construction is comprised of two very different sectors, nonresidential buildings and non-building infrastructure. Infrastructure is quite erratic while buildings spending has been climbing at a steady strong rate for several years. Buildings spending is up 2% from Q2’16 and up 6% YOY. In the 2nd half 2017 YOY spending is expected to reach 8%.
Most infrastructure projects that started in 2015 and 2016 are still ongoing so do not effect much change in current monthly spending. It is projects from late 2014/early 2015 that are finishing that are resulting in the largest share of current spending drops. Worthy of note is that non-building infrastructure spending just experienced two years of record highs, so even though spending is down slightly we will still see 2017 finish near record highs.

Construction Companies Continue to Face Labor Shortage Challenges
Construction Spending for the last 24 months increased +13%, but after inflation actual volume during that period increased only +5.5%. Construction jobs output, (jobs x hours worked) for that same period increased +7.6%. Overall, jobs output is exceeding the growth in volume put-in-place. Most of this is being driven by imbalances in Nonresidential Buildings, for which jobs output grew by 7% in two years but volume growth measured only 2% after inflation.
Why is it that jobs output is growing faster than construction volume? Could it be that shortages are localized, not as widespread as thought? Or perhaps it’s that contractors can’t get skilled workers, so they are hiring more workers with less skill? Maybe contractors anticipate growth, so they are hiring more now to prepare for the future? Whatever the case, jobs are growing faster than construction volume and that is not what should be expected in a labor shortage.
Are contractor’s responses to survey questions about filling job positions based on an anticipated need to staff up to meet revenue growth? If so, that is a major miscalculation to determine staffing needs. This is not as far-fetched as you might think. I’ve talked with numerous contractors in the past who were doing this. As I tried to explain in several previous articles, growth in revenue (or construction spending) doesn’t address how much of the growth is due to inflation. Right now, in fact for the last 24 months, the largest portion of spending growth is inflation, not real volume growth.
If you are hiring to match your revenue growth, you are part of the reason jobs are growing faster than volume. INFLATION!
See also Construction Jobs Growing Faster Than Volume
Is there a Residential Construction Spending slowdown? If so, how significant?
YTD Residential Construction spending for the 1st 5 months 2017 is up 12.2% from 1st 5 months 2016. YTD has been above 12% since January.
Average spending for the last three months is up 4.0% from the average in Q4 2016. That’s a ~10% annual rate of growth. Starts cash flows are indicting flat spending for the next few months but then accelerated spending from late Q3 into the end of the year. Current projected spending for 2017 is $523 billion, +10.5% higher than 2016.
May vs April residential construction spending shows a 0.5% decline. However, April has been revised up once and May has not yet been revised. All months are revised twice after the first release of data. The average revision (to residential data) for the last 16 months is up 4%, the average revision for the last 28 months is up 7%. All revisions for the last 28 months were up. After revisions, there were only two monthly declines in the last 28 months, and both of those were slight.
If new starts collapse to show no gains for the remainder of the year, then based on starts already in backlog and reduced starts for the remainder of the year, spending would be reduced to $513 billion. That’s still 8.5% higher than 2016. Of course, this would be an extremely unlikely scenario. The last time residential construction starts declined for three or more consecutive months was 2010, and the last time there were no gains for six or more months was 2008.

Construction Forecasting Presentation 2017
Attached PDF of my Forecasting presentation delivered 5-22-17 at Advancing Building Estimation in Houston
EdZ presentation ABE Forecasting Costs 5-22-17
A few bullets from this presentation
- Construction Starts is not construction spending
- Cash flow = Spending = Revenue
- Revenue is not Volume of work
- Spending minus inflation = Volume
- Understand what’s in an Index to avoid misguided inflation adjustments
- We can’t ignore productivity
- Spending activity has just as much influence on inflation as labor and material cost.
Slides in this presentation come from the following articles:
1st Qtr Update 2017 Construction Spending Forecast

1st Qtr Update 2017 Construction Spending Forecast
5-1-17 Updated construction spending forecast for 2017. Actual spending is included through March data, first release 5-1-17. Forecast spending includes predictions based on Dodge Data & Analytics (DDA) construction starts through March, released 4-21-17.
Reference Construction Economic Outlook 2017 posted January 2017
5-1-17 Update Overview
Construction Spending in March posted a seasonally adjusted annual rate (SAAR) of $1,218 billion, down 0.2% from February. February was revised UP by 2.3%, and March data is still subject to revisions, usually upward, the next two months. January was revised UP 1.6% from the initial release.
The 1st release of spending is always being compared to a previous month and a previous year that have already been revised, almost always up. Upward revisions to monthly construction spending in 2016 have been as high as 3.4% and for the year average 1.1%/mo. In the last 48 months, the 1st report of construction spending was down vs the prior month 20 times. The initial value was subsequently revised UP 47 times. After revisions, only nine months were down compared to the prior month.
Total Construction Spending for Q1’17 is 3.5% higher than I predicted in my initial 2017 forecast posted 1-7-17. Construction spending growth from Q4’16 to Q1’17 gives 2017 the 2nd best quarter to quarter start in 10 years, just shy of 2014 which posted the best spending growth since 2005. Nearly all the greater volume in spending over my original 2017 forecast is in residential construction, which, for the last four months, has posted much stronger new starts and spending than anticipated based on DDA projections.
Year over year total spending:
- Jan17r/Jan16 = 4.7%
- Feb17r/Feb16 = 5.5%
- Mar17/Mar16 = 3.6%
Based on history, it is likely that Mar17 will get revised UP. (note: with the 2nd release of March spending, the Mar17 year-over-year value was revised up from yoy 3.6% to 5.0%. The initial Apr17 yoy value was posted as up 6.7% from Apr16. Year-to-date total through April is up 5.8% over 2016, and that will most likely be revised higher.)

Total construction spending in 2017 is now forecast to finish at $1,263 billion, an 8.5% increase vs 2016, supported by a 4th consecutive year of strong performance in nonresidential buildings and a very strong start in residential spending. The SAAR of spending will range from near $1.2 trillion in January to $1.3 trillion in the 4th quarter.
A significant indicator for 2017 construction spending performance is that 2017 year-to-date (YTD) spending is up 4.9% compared to a very strong 1st quarter 2016. In the 2nd quarter 2016 spending dropped and did not return to the Feb-Mar 2016 level until Sept-Oct 2016. In 2017, although growth will slow (but still remain positive) in the 2nd quarter, by Sept-Oct spending will be 5% higher than March. The six months Apr-Sept 2017 compared to the same period 2016 will show growth of more than 8%.
The SAAR of spending on a “current dollar” basis (before adjusting for inflation) is now at an all-time high, just barely eclipsing the highs of early 2006. By the 4th quarter of 2017 spending will be 5% above the previous 2006 highs on a “current dollar” basis. However, on a “constant dollar” basis (adjusted for inflation) we are still 13%-14% below peak spending, perhaps five more years away from the real inflation adjusted 2006 peak.
For inflation adjusted spending see “Are We at New Peak Construction Spending”
Sector Spending
The SAAR of Residential construction spending increased 6% in the last 3 months. It is up 5.3% from Q4’16 to Q1’17. March YTD (=Q1 2017 total) is up only 8.5% from Q1 2016, because Q1 2016 was exceptionally strong. I’m forecasting residential construction 2017 growth of 8% to 10%. Residential spending in 2017 is forecast at $512 billion, 10.2% higher than 2016.

Total Nonresidential construction spending is up 2% Q1’17 vs Q4’16 and up 2.5% vs Q1’16. Predicted cash flows indicate a strong growth pattern for 2017. I expect total nonresidential spending to finish the year up 7%. Nonresidential construction is better understood by looking at the parts, buildings and infrastructure.
Construction spending for Nonresidential Buildings in Q1’17 is up 1.6% vs Q4’16 and up 6.6% vs Q1’16. The most recent 3-month average seasonally adjusted annual rate (SAAR) is $427 billion, now less than 4% below the previous peak of $444 billion in 2008. By midyear 2017 the SAAR will reach a new all-time high and at year-end it will be near $460 billion.
Nonresidential buildings 2017 starting backlog on January 1, 2017 was 47% higher than at the start of 2014, the beginning of the current growth cycle. Spending within the year has two sources; that generated from new starts within the year and that generated from starting backlog. For nonresidential buildings, spending within the year from starting backlog has increased every year since 2014 and in 2017 it will be 42% higher than 2014.
Nonresidential Buildings spending in 2017 is forecast at $447 billion, 9.0% above 2016. Office spending will lead 2017 with 25%+ growth. Commercial, Lodging and Educational markets are all expected to post strong gains over 10%.
For details on Nonresidential Buildings, See Behind The Headlines – Nonres Bldgs Construction Spending and Nonresidential Bldgs 2017 Forecasts Comparisons
Construction spending for Nonbuilding Infrastructure Q1’17 is up 3.8% vs Q4’16, but down 1.8% vs Q1’16. Nonbuilding infrastructure 2017 growth is expected at about 4%-5%.
Non-building Infrastructure, following two down years, will increase by 4.8% to $305 billion. Infrastructure growth is being led by a very high volume of power generation and pipeline work, up only slightly from Q1’16, but up 10% from Q4’16. Although new infrastructure starts were down in 2016 and are expected to decline again in 2017, the amount of work in backlog at the start of 2017 is the highest its ever been and spending in 2017 is forecast at an all-time high.
For Non-building Infrastructure details see Infrastructure Outlook 2017

Private spending is the highest since Q1 2006. Public spending YTD 2017 vs 2016 is down 7% ONLY because the 1st quarter of 2016 was the highest quarter since 2010, elevated due to highway and bridge spending. Educational and Highway/Bridge, the largest two components, make up almost 60% of public spending. The quarterly average of Public spending has been increasing since Q2’16. By the end of Q2’17 YTD public spending will be up 2.5%.
For all of 2017 Private spending will increase 9%. Public spending could increase 7%, with half the gains coming from educational spending.
Backlog
Starting Backlog is the Estimate-to-Complete (ETC) value of all projects under contract at the beginning of the period. The sum of all ETC represents current backlog. While continued growth in backlog is most important, the predicted cash flow from backlog and new starts is necessary for predicting future spending.
Revenues from starting backlog account for 75%-80% of all nonresidential construction spending within the year. Not only was nonresidential starting backlog at the highest ever coming into 2017, but also spending from backlog is predicted up by 5% and 2017 new starts are predicted up 8%.
Due to the shorter duration of residential projects, nearly 70% of spending within the year is generated from new starts. Unlike nonresidential, backlog does not contribute nearly as much spending within the current year. If no new work started within the year, within a matter of a few months there would be no backlog ETC left to support the industry.

New Starts
Construction starts, which generate construction spending (cash flow) over the next several years, were originally reported in 2016 as up only 1% from a remarkably strong 2015. However, Jan-Feb-Mar 2016 starts have recently been revised up by a whopping 16%, and the historical trend is that every monthly value in the previous year for the last eight years has been revised up. This adds to predicted cash flow, so has an immediate affect of raising predicted 2017 spending. 2016 revisions-to-date and expected revisions are on track to raise 2016 starts up to 6% growth over 2015.
Starts that are being reported for the current year are always being compared to a previous year that has been revised up, so starts growth is always understated. So far, starts for the 1st quarter of 2017 have been much stronger than expected. Starts year-to-date are down 1.5% from the upward revised 2016 totals, however the historical revision has been in the range of 3.5% to 5%. So, the actual growth in new starts has been remarkably strong, better than forecast in October, and is adding to the basis for increased forecast in future 2017 and 2018 spending.

Construction Backlog March 2017
3-20-17
Starting Backlog is the Estimate-to-Complete (ETC) value of all projects under contract at the beginning of the year. Projects in starting backlog could have started last month or last year or three years ago. The requirement is that those projects have not reached their end-date and some portion of the revenues generated by those projects is still ETC. The sum of all ETC represents current backlog.
A cash flow schedule of all ETC backlog and predicted new starts provides a tool to predict future spending. The $ reported here are the results of a cash flow analysis using Dodge Data & Analytics Construction Starts. Do keep in mind the DDA Starts value represents a survey of about 50% to 60% of the industry. While the percent change of values from year to year is relevant, the $ value does not compare directly to the actual spending $ values.
It is not enough to look at just the change in starts or the change in backlog to get an indication of the strength of the market. While continued growth in backlog is most important, the predicted cash flow from backlog and new starts is necessary for predicting future spending.

Nonresidential Buildings
The last time nonresidential buildings experienced a decline in starting backlog was 2013, Total construction spending on nonresidential buildings in 2013 registered a weak 0.8% gain. Since 2013, nonresidential buildings starting backlog is up 60%, reaching a new all-time high at the beginning of 2017. The previous high in 2009 was $241 billion. In 2016 it was $230 billion. For the start of 2017 it is $248 billion.
Revenues from starting backlog account for 75% of all nonresidential buildings construction spending within the year. If no new work started within the year, by year end there would be only 25% of the total in backlog needed to support the industry.
Not only is starting backlog higher coming into 2017, but also spending from backlog is predicted up by 5% and 2017 new starts are predicted up 8%. New starts are very strong in Office, Lodging, Educational, Healthcare and Amusement/Recreation.
This supports my predictions that 2017 will be another banner year for spending on nonresidential buildings, up a strong 10% from 2016. Similar growth is expected in 2018. This will produce a new high in current dollar spending, but will still be 15% below the constant $ all-time highs.

(edit 3-21-17 updated table)
Non-building Infrastructure
Non-building infrastructure experienced declines in starting backlog in 2012 and 2015. Fortunately, in both of those years, new starts were up. For the last eight years infrastructure starting backlog has been near $200 billion, +/- $10 billion. In 2008, the last pre-recession year, backlog stood at $178 billion. At the beginning of 2017, non-building infrastructure backlog is at an all-time high, $243 billion, up 36% from 2008. In the last two years starting backlog is up 20%.
Revenues from starting backlog account for 80% of all non-building infrastructure construction spending within the year. However, because infrastructure projects are long duration, only about 60% of total backlog gets spent within the year. If no new work started within the year, by year end there would still be 55% of the total in backlog needed to support the industry.
In 2016, although starting backlog was up, new starts were down and spending from backlog was also down. That cemented a decline in spending in 2016. New starts in 2016 declined for power, highway, transportation and public works, but due to long duration projects contributing to strong backlog in these markets, spending will be up in all except public works. New infrastructure starts in 2017 are predicted down 5%, but spending from backlog is predicted to increase by more than 10%, and that more than offsets the decline in new starts. 2017 will post a solid gain of 4% to reach a new high in spending and that is expected to increase again in 2018.
Residential Buildings
Residential new starts hit bottom in 2009 and starting backlog hit bottom in 2010. Residential on average has the shortest duration and new starts has a dramatic impact on the amount of available work. Both new starts and backlog are up about 300% from the lows. New residential starts have increased every year since the 2009 bottom, but are still lower than 2006.
Due to the shorter duration of projects, nearly 70% of residential spending within the year is generated from new starts. Unlike nonresidential, backlog does not contribute nearly as much. If no new work started within the year, within a matter of a few months there would be no backlog ETC left to support the industry.
Coming into 2017, starting backlog is up, and new starts are up and spending from new starts is up. But the rate of growth in new starts and spending from new starts is slowing. This is not unexpected after 4 years (2012-2015) of new starts growth averaging greater than 20%/year. The last two years it’s 12%/yr. This leads to a prediction of future spending increases ranging between 5% to 7% for the next two years.
See Also Behind The Headlines – Construction Backlog
Behind the Headlines -Trend in Construction Spending
3-5-17
Headlines of construction spending declines are almost always premature.
The 1st release of January construction spending came out March 1. This initial release indicates a decline of 1% from December. Keep in mind, all 12 monthly reports in 2016 were subsequently revised up. Eight times in 2016 the 1st report of spending was down vs the previous month. After revisions, only two months were down compared to the previous month.

Monthly construction spending has been revised UP every one of the last 39 consecutive months. Since August 2013, the first report indicated a decline vs. the previous month 17 times. After revisions, there remain only seven real month/month declines in 39 months.
The 1st release of spending is almost always being compared to a previous month and a previous year that have been revised up. Upward revisions to monthly construction spending in 2016 have been as high as 3.4% and for the year average 1.1%/mo.
After spending is first published it is revised in each of the two following months. Then all the values for the entire year are revised when the May data release is issued on July 1 of the following year.
Most changes in monthly spending are predetermined.
Spending that occurs this month is generated from all the projects that are ongoing, some that started many months ago. In fact, some projects may have started three or four years ago. For instance, the largest decline in public spending this month is highway work. Although it has one of the smallest percent changes ( only -3.3% vs -12% to -16% for other markets), it is the largest share of total public spending. A very large amount work, 40% above normal, started in 2013 – early 2014. Some of that work is just now finishing. It could be seen a year ago in the cash flow models that a very large sum of work would be ending sometime in Q4’16 or Q1’17. It often occurs that the largest changes in monthly spending are driven by work ending rather than new work beginning.
Nonresidential buildings has the largest backlog ever.
Both Residential and Non-building Infrastructure will increase in 2017 after brief slowdowns but Nonresidential Buildings will lead construction spending in 2017, accounting for more than half of all 2017 growth. Office and commercial retail and then educational provide the most dollar volume growth in 2017.
Nonresidential buildings 2017 starting backlog is 45% higher than at the start of 2014, the beginning of the current growth cycle. Current year spending from starting backlog has increased every year and in 2017 it will be up 35% over 2014. About 75% to 80% of all nonresidential buildings construction spending in 2017 will be generated by projects that are already underway (in backlog). Only 20% to 25% of all spending in 2017 will come from new projects that start in 2017.
New construction starts in the final three months of 2016, although well below the yearly highs reached in August and September, helped carry 2016 new starts to an eight-year high. Nonresidential Buildings starts for the last six months averaged the highest since the 1st half of 2008.
Jobs growth may look quite slow this year.
Jobs growth over time follows closely to volume growth, not spending growth. Real volume growth is spending minus inflation. I’m predicting 6% spending growth in 2017, but after inflation that represents less than 2% volume growth. Therefore, we may add less than 2% new jobs in 2017, or less than 140,000 new jobs. An imbalance in growth between jobs and volume does sometimes occur. In the last 25 years that annual imbalance, whether up or down, has exceeded 3% only six times. Those six years were all either construction boom years or recessions. For all the other years, the difference in growth between jobs and volume has averaged less than 1%. Whether we look at the last four-year period or the last eight-year period, jobs and volume growth have been within 2%.
ABI – DMI – Starts – Construction Spending
2-22-17
The attached plot shows actual and predicted construction spending compared to several industry leading indicators. The ABI, produced by the American Institute of Architects (AIA) shows work on the boards at architectural firms. Values above 50 indicate work increasing, values below 50 = work decreasing. The DMI is a survey from Dodge that gives an indication of new construction momentum. Starts is the total cash flow growth from all nonresidential starts currently in backlog.
Both the ABI and the DMI have long lead times. For example, the ABI value posted by AIA today is an indication of what to expect 9 months from now. I’ve plotted the values for ABI and DMI out at the lead time dates (# of months) in the future so they would correspond to future cash flows from all starts and predicted spending. The Starts, DMI and Spending values on this plot are indexed so they could be plotted with the ABI while keeping growth trends in each index true.
- ABI – Architectural Billings Index
- DMI – Dodge Momentum Index
- Starts – Aggregate Cashflows of Dodge Starts
- Spending – Actual and Predicted Construction Spending

Overall Spending mostly correlates with Starts except that Starts showed a steeper growth rate in 2016 before a drop. Starts and Spending match well for all of 2014 and 2015. Both DMI and ABI are more erratic, however, the advances and declines in the ABI do correspond well with pickups and slowdowns in Spending. From mid-2015 through the end of 2016, the DMI was in a narrow range and that could possibly be said to be in synch with a slowed period of Spending.
Although they don’t match exactly by month, the ABI, DMI and Starts all show a drop sometime between 4th qtr 2016 and 2nd qtr 2017. That appears in Spending as a slight dip in 1st qtr 2017. The ABI gives an indication of a nice increase midyear. Both DMI and Starts are indicating substantial growth in spending by year end 2017.
Summary of 2017 Construction Outlook
2-21-17 This Summary is a collection of briefs pulled from all the articles that make up the 2017 Construction Outlook
Follow this for Link to Articles in 2017 Construction Outlook
NEW STARTS
Total of all Dodge Data & Analytics new construction starts for 2016 finished as the highest year since 2005. After 2016 totals get adjusted up we might see 2016 growth of 4% to 5% over 2015.
- Residential starts in 2016 posted the best year since 2005-2006. New starts show an increase of only 6% for 2016, but that follows several years of growth averaging more than 20%/year. I expect after adjustments 2016 residential starts will be revised to 8% growth.
- Nonresidential Buildings starts for the last six months averaged the highest since the 1st half of 2008. I expect after adjustment nonresidential buildings will show a 2016 increase of about 8% to 9%.
- Infrastructure starts even though posting a substantial decline for 2016 came in at the second highest year on record. 2015 was up 27% from 2014. I expect after adjustments the 2016 decline will be revised up by 3 points to -8%.
BACKLOG
The types, values and duration of projects that make up the backlog help get a clear picture of spending activity over time, particularly in the coming year.
Nonresidential buildings 2017 starting backlog is 45% higher than at the start of 2014, the beginning of the current growth cycle. Spending from starting backlog has increased every year and in 2017 it will be up a total of 35% over 2014.
SPENDING
Total construction spending in 2017 will reach $1,236 billion, an increase of 6% over 2016, supported by a 4th consecutive year of strong growth in nonresidential buildings. The monthly rate of spending will range from near $1.2 trillion in January to $1.3 trillion at year-end.
- Nonresidential Buildings spending in 2017 will increase to $447 billion, 9.1% over 2016. Office spending will lead 2017 with 30%+ growth. Commercial, Lodging and Educational markets are all expected to post strong gains over 10%.
- Non-building Infrastructure, following two down years, will increase by 4.4% to $304 billion, due to growth in the highway and transportation markets.
- Residential will increase only moderately to $485 billion, adding 4.8% over 2016. That follows on three years of substantial growth averaging 17%/year.
- The entire construction industry best growth rate ever achieved (in constant 2016$) absorbed $1 trillion in new spending over 5 years. Infrastructure has not absorbed $1 trillion newly added work in 25 years.
- None of the starts or spending detailed above includes any projections of potential work from future stimulus.

PUBLIC CONSTRUCTION
The two largest components of Public Construction Spending, by far, are Highway/Bridge/Street and Educational Buildings. These two markets have more impact on the magnitude of public spending than any other markets.
Public Construction Spending average for the first six months of 2016 was the highest since 2010 and is up 10% from the Q4’13-Q1’14 low point.
Public spending finished 2016 down 0.8% from 2015, but that is down from a near six-year high, so spending is still strong. It is still 9% below its 2009 peak. Public spending in 2017 could increase more than 8%.
JOBS
For 2017, several economists (including myself) are predicting total construction spending will increase by just over 6%. However, I’m also predicting that combined construction inflation for all sectors will increase by 4.0% to 4.5%. That leaves us with a net volume growth of only 1.5% to 2.0%. Therefore, for 2017, we should not expect jobs to increase by more than 1.5% to 2.0%, or 100,000 to 140,000.
HOUSING
Housing Starts (# of units started as reported by U.S. Census) can be erratic from month to month and short term changes in growth can sometimes be misleading. Trends should be looked at over longer term periods. New monthly starts on a seasonally adjusted annual rate (SAAR) basis for the last eight months through January 2017 have now averaged over 1,200,000.
For the last four months housing starts have averaged an annual rate of 1,250,000, an increase of 8.5% over the range-bound average of 1,150,000 for the previous six quarters.
Housing starts for 2017 could surprise to the low side. Spending is predicted to grow 5%, but almost all of that is inflation. New starts could finish lower than the 65,000 in 2016.
MATERIALS
Most material prices have been muted over the last year, or even two years. Through the 3rd quarter 2016, material input prices had not registered a year over year gain for two years. In the last 4 months that has all changed. Steel, lumber and concrete are now all up in cost substantially over last year. Construction Input prices are up 4%. However, it is not material prices that have been driving inflation, which is up due to labor cost and market activity. Now material prices are also accelerating and that cold have a big impact on future inflation.
Final cost of materials averages perhaps 30% to 50% of building cost. The input cost of materials can contribute much less to overall project cost. For example a 10% cost increase in mill steel could add 0.4% to the total cost across all steel in a building. It could add 1% to the cost of a structural steel contract. A 10% increase in the cost of concrete, depending on if the building is a steel structure or a concrete structure, would add only 0.2% to 0.6% to the total cost of a building. A 10% increase in the cost of gypsum board would add less than 0.1% to the total cost of a building.
INFLATION
Constant $ adjusted for inflation converts all past spending into 2016$ for an equalized comparison. From the low point in 2011 we’ve increased spending by 48% but in constant 2016$ we’ve added only 29% in volume and we are still 16% below the 2005 peak. (updated plot 3-9-17)

As measured in comparable constant dollars, No, we are not back to previous levels of construction spending. We will probably not return to previous highs before 2020.
- Long term construction cost inflation is normally about double consumer price inflation (CPI).
- Since 1993 but taking out 2 worst years of recession (-8% to -10% 2009-2010), the 20-year average inflation is 4.2%.
- Average long term (30 years) construction cost inflation is 3.5% even with any/all recession years included.

If you want to use a cost index to adjust project costs over time, you must understand what it measures. Selling Price, by definition, whole building actual final cost, tracks the final cost of construction, which includes, in addition to costs of labor and materials and sales/use taxes, general contractor and sub-contractor overhead and profit. Selling price indices should be used to adjust project costs over time.
Follow this link to 2017 Construction Outlook Compilation of Links to All Articles
2017 Construction Outlook Articles
Articles Detailing 2017 Construction Outlook
Links will open in a new tab
These links point to articles here on this blog that summarize end-of-year data for 2016 and organize in one place my projections for 2017.

Most Recently Published
Spending Summary Construction Forecast Fall 2017 12-3-17
Starts Trends Construction Forecast Fall 2017 11-8-17
Backlog Construction Forecast Fall 2017 11-10-17
Is Infrastructure Construction Spending Near All-Time Lows? 10-10-17
Construction Jobs / Workload Balance 11-2-17
Constant Dollar Construction Growth 11-2-17
Summary
Summary of 2017 Construction Outlook 2-21-17
1st Qtr Update 2017 Construction Spending Forecast 5-1-17
Construction Spending Midyear 2017 Summary 7-11-17
August Construction Spending 10-2-17
Spending Summary Construction Forecast Fall 2017 12-3-17
2016 Results
2016 Construction Spending 1-3-17
New Starts and 2017 Starting Backlog
New Construction Starts Totals for 2016 1-24-17
Starts Point to Robust 2017 Spending 10-20-16
ABI – DMI – Starts – Construction Spending 2-22-17
Construction Backlog Leading Into 2017 1-16-17
Construction Backlog 2017 3-20-17
Construction Starts and Spending Patterns 9-26-17
Starts Trends Construction Forecast Fall 2017 11-8-17
Backlog Construction Forecast Fall 2017 11-10-17
Spending Forecast
Forecast 2017 Construction Spending 1-7-17
Are We at New Peak Construction Spending? 1-4-17
Trends in Construction Spending 3-5-17
Construction Spending Almost Always Revised UP 5-1-17
Construction Spending May 2017 – Behind The Headlines 7-6-17
So, About Those Posts “construction spending declines…” 10-4-17
Ahead of the Sept Construction Spending Forecast 10-25-17
Nonresidential Buildings
Nonresidential Bldgs Construction Spending 2017 1-4-17
Office Buildings Lead 2017 Construction Spending 2-15-17
Nonresidential Bldgs 2017 Forecasts Vary 2-5-17
Nonres Bldgs Construction Spending Midyear 2017 Forecast 7-24-17
Residential
Housing Starts vs Residential Construction Spending 2-18-17
Infrastructure Outlook
Infrastructure Outlook 2017 1-12-17
Calls for Infrastructure Problematic 1-12-17
Infrastructure – Ramping Up to Add $1 trillion 1-30-17
Saturday Morning Thinking Out Loud #1 – Infrastructure 10-29-16
Is Infrastructure Construction Spending Near All-Time Lows? 10-10-17
Public Construction
Public Construction Spending 2016-2017 10-21-16
Infrastructure & Public Construction Spending 3-5-17
Jobs
Construction Spending vs Jobs 2-9-17
Behind The Headlines – Construction Jobs 2-16-17
Is There a Construction Jobs Shortage? 3-10-17
Construction Jobs Growing Faster Than Volume 5-5-17
Construction Jobs / Workload Balance 11-2-17
Inflation
How Much Does A Steel Cost Increase Affect Construction? 9-18-16
Constant Dollars – Impact of Inflation 2-4-17
Construction Inflation Index Tables UPDATED 8-6-17
Constant Dollar Construction Growth 11-2-17
