Home » 2016 (Page 5)
Yearly Archives: 2016
Construction Forecast 1st Look – What To Expect in 2016?
Construction spending may reach historic growth in 2016.
There are currently six estimates available forecasting 2016 total construction spending ranging from 6% to 10% growth, with an average of 8.7%. My forecast is 9.7%.
Total construction spending, forecast to grow 9.7% in 2016, could reach a total 30% for the three years 2014-15-16. The only comparable periods in the last 20 years are 29% in 2003-04-05 and 27% in 2013-14-15.
The current nonresidential buildings construction boom could become an historic expansion. Nonresidential buildings spending is forecast to grow 13.7% in 2016. Added to 8.8% in 2014 and 17.1% in 2015, the three-year total growth could reach 40% for 2014-15-16. The only comparable growth periods in the last 20 years are 40% in 2006-07-08 and 32% in 1995-96-97.
For perspective, residential spending increased 46% in 2013-14-15, similar to only one comparable period in the last 20 years, 48% in 2003-04-05.
Non-building infrastructure projects, in two of the last three years have barely shown any gains entirely due to declines in power plant projects. This will repeat in 2016.
This is still the 1st or 2nd most active 3 year period of growth in construction in more than 20 years, and it’s already been ongoing since 2013-2014. With the forecast for 2016, spending growth could reach a new three-year high.
From the middle of Q1 2016 to the end of Q3 2016, total spending will post six to eight months at an annual growth rate of 20%, but due to the dips at the beginning and the end of the year, total 2016 construction spending will finish at 9.7% growth. Construction spending momentum is not yet losing steam. We may be seeing the effects of a few years of erratic growth patterns and a shift from more rapidly changing commercial and residential work to slower growth institutional work.

Residential spending will slow several percent early in 2016 before resuming upward momentum to finish the year with 12% growth, slightly less than growth in 2014 and 2015. Periods of low new start volumes need to work their way thru the system and this produces growth patterns with periodic dips. The upward momentum will carry into 2017.
Nonresidential buildings spending will slow moderately in the next few months before we see a 15% growth rate through the middle of the year, only to see another slowdown late in 2016. Major contributions are increasing from institutional work in educational and healthcare markets. Office, commercial retail, lodging and manufacturing will decline considerably from 2015 but still provide support to growth.
Infrastructure projects spending will decline over the next six months due to the ending of massive projects that started 24 to 42 months ago. There will be large advances in spending midyear before we experience another slowdown later in 2016. Following a 0.5% increase in 2015, spending will increase only 1.2% in 2016, held down by a 10% drop in power projects, the second largest component of infrastructure work.
Construction added 1.0 million jobs in the five years 2011-2015. 800,000 jobs were added in the last three years. To support forecast spending, jobs need to grow by 500,000 to 600,000 in 2016-2017. Growth in nonresidential buildings and residential construction in 2014 and 2015 led to significant labor demand which has resulted in labor shortages in some building professions. Demand in 2016-2017 will drive up labor cost and may slow project delivery.
Spending growth, up 35% in the four-year period 2012-2015, exceeded the growth during 2003-2006 (33%) and 1996-1999 (32%) which were the two fastest growth periods on record with the highest rates of inflation and productivity loss. Construction spending growth for the period 2013-2016 is going to outpace all previous periods.
Construction inflation is quite likely to advance more rapidly than some owners have planned. Long term construction cost inflation is normally about double consumer price inflation. Construction inflation in rapid growth years is much higher than average long-term inflation. Since 1993, long-term annual construction inflation for buildings has been 3.5%, even when including the recessionary period 2007-2011. During rapid growth periods, inflation averages more than 8%.
For the last three years the nonresidential buildings cost index has averaged just over +4% and the residential buildings cost index just over +6%, however, the infrastructure projects index declined. The FWHA highway index, the IHS power plant index and the PPI industrial structures and other nonresidential structures indices have all been flat or declining for the last three years. This provides a good example for why a composite all-construction cost index should not be used to adjust costs of buildings. Infrastructure project indices often do not follow the same pattern as cost of buildings.
Anticipate construction inflation of buildings during the next two years closer to the high end rapid growth rate rather than the long term average.
2016 Construction Outlook Articles
Articles Detailing 2016 Construction Outlook
Links will open in a new tab
These links point to articles here on this blog that summarize end-of-year data for 2015 and point to articles with projections for 2016.
Most Recently Published
Summary of 2017 Construction Outlook 2-21-17
How Much Does A Steel Cost Increase Affect Construction? 9-18-16
2015 Results
Construction Spending 2015-2016 – How Do The Forecasts Compare? 12-9-15
Construction Spending 2015 and 2016 11-9-15
Construction Spending Market Performance of Nonresidential Bldgs 2015-2016 10-15-15
New Starts and 2016 Starting Backlog
Construction Backlog 2017 3-20-17
New Construction Starts Leading Into 2017 1-24-17
Behind The Headlines – Construction Backlog 1-16-17
Starts Point to Robust 2017 Spending 10-20-16
New Construction Starts Much Better Than Might Appear 9-23-16
Spending Forecast
Forecast 2017 Construction Spending 1-7-17
2016 Construction Spending year end 1-3-17
Are We at New Peak Construction Spending? 1-4-17
Construction Spending Gets Revised UP 10-6-17
Construction Spending 2016 – Midyear Summary
1st Quarter 2016 Construction Spending and Forecast
Construction Forecast 1st Look – What To Expect in 2016? 1-14-16
Erratic Pattern Ahead for 2016 Construction Spending. Why?
Nonresidential Buildings
Construction Spending 2016 – Midyear Nonresidential Markets
Updated 1-23-16 Forecasts of 2016 Nonres Buildings Construction Spending % Growth
Construction Spending Market Performance of Nonresidential Bldgs 2015-2016 10-15-15
Residential
Construction Spending vs Dodge Starts vs New Housing Unit Starts 4-27-16
Residential Work Flow From Housing Starts 4-25-16
Housing Starts > Look a Little Deeper 11-18-15
Claryifying Housing Starts Numbers 11-6-15
Residential Construction – Not All Data Tells The Same Story 10-25-15
Infrastructure Outlook
Infrastructure – Ramping Up to Add $1 trillion 1-30-17
Infrastructure Outlook 2017 1-12-17
Calls for Infrastructure Problematic 1-12-17
Saturday Morning Thinking Out Loud #1 – Infrastructure 10-29-16
Public Construction
Infrastructure & Public Construction Spending 3-5-17
Public Construction Spending 2016-2017 10-21-16
Jobs
Construction Spending vs Jobs 2-9-17
Behind The Headlines – Construction Jobs 2-16-17
Construction Jobs Show 3rd Qtr Growth 10-7-16
How Many Construction Jobs Needed to Support 2016-2017 Spending Forecast? 1-12-16
Inflation
How Much Does A Steel Cost Increase Affect Construction? 9-18-16
Construction Inflation Cost Index 1-31-16
How Many Construction Jobs Will Be Needed to Support 2016-2017 Spending Forecast?
1-12-16
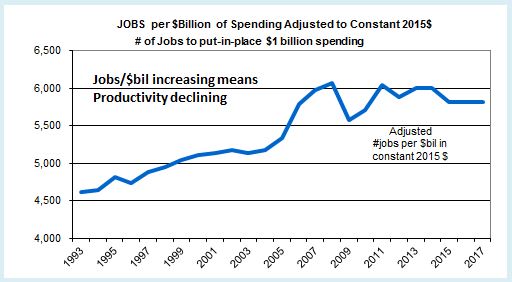
This is a pretty straight forward analysis. If productivity is to remain the same, then jobs need to grow by the same percentage as volume. If volume grows faster, then productivity increases. If jobs grow faster, then productivity declines. Let’s have a look at the numbers to find out what’s been going on and where we might be headed. Spending forecasts will give the basis for predicting jobs growth.
A few weeks back I commented on a study published by Bureau of Labor Statistics on how many construction jobs would be created by 2024. BLS Says +790,000 Construction Jobs by 2024. Let’s Look Behind The Headlines. Now that I’ve completed updating spending and jobs data and developed a forecast for 2016-2017, I will show what has taken place over the last 4 years and what to expect for the next two years.
Here’s what we know.
Volume is not the same as construction spending. Spending is the number nearly everyone follows. Volume is spending minus inflation. I use composite inflation factors based on tracking numerous construction selling price indices.
In 2015 nonresidential buildings spending grew by 17%, but after inflation, volume grew by only 12%. Overall construction spending in 2015 grew by 11%. Total all construction volume grew by 8%. Annual construction inflation varies for residential, nonresidential buildings and nonresidential infrastructure.
For the four years 2012 through 2015 construction spending grew by 35% but after inflation volume grew by 21%.
Work output grows by number of new jobs added and by any increase in total hours worked. For the four years 2012 through 2015 construction jobs increased from 5.5 million to 6.4 million, or 16%. In addition hours worked by the entire 6 million workforce increased by 2%. So effectively, total workforce output increased by 18%.
The last four years volume grew 21% and the effective number of jobs grew 18%. There was an increase in productivity over this four year period of 3%. An increase in productivity occurred because we put-in-place more volume than the (effective) number of jobs added.
Now we can ask the question, “How many construction jobs will be added in the next two years if we achieve the spending forecast?”
Let’s use what we know and apply it to the forecast.
I’m forecasting 10% spending growth in 2016 and 12% in 2017. I anticipate higher inflation than we have experienced in the last few years. After inflation, volume should grow 4% and 6%. So, total volume growth for the next two years is forecast 10%.
With rapid growth, I would expect productivity to decline slightly, but the last 4 years of growth showed a slight productivity gain, so let’s go with that. That means we will lower our estimate of jobs needed because some of the increased volume over the next 2 years will be supported with increased productivity.
Total volume growth for the next two years is forecast at 10%. If we follow the same pattern as the last 4 years, we may see an increase in productivity of 2%. So we need only an 8% increase in workforce output to put-in-place the forecast volume. The average number of jobs for 2015 is 6.4 million. An 8% increase in 2 years on the 6.4 million means we need to add 512,000 jobs in 2016-2017.
If we do not see gains or losses in productivity we need to add 10% to jobs, the same percentage jobs as we have volume growth. That would be 640,000 new jobs in 2016-2017.
As a result, based on this analysis expect a need of about 500,000 to 600,000 new construction jobs in the next two years.
For comparison, in 2014-2015, 601,000 new jobs were added. Then, spending grew 20% but volume after inflation was 12%. Jobs grew by 10%.
Jobs have increased more than 600,000 in two adjacent years only a few times. Any two years within 1996-1998 were over 600,000, also 83-84 and 93-94. The highest ever was 1998-99 when we added 770,000 new jobs, and that two year period had the same total jobs as 2014-2015. The only other recent high periods are 2004-05 added 700,000 and 2014-15 added 601,000.
Also, it’s easy to see now, had this been based on total spending increases for the two years rather than volume, the need would be 20+% or 1.0 to 1.2 million jobs, not just the 8% or 10% jobs growth used here. The last time jobs grew by more than 10-12% in two years was 1977-1978 at 18% and the highest growth ever was 770,000 jobs added in 1998-99, the only time over 700,000. So, as expected, 20+% growth and a million jobs in two years has never been reached.
BLS predicted construction will add 790,000 jobs over 10 years, the period from 2015 through 2024. In 2015 we’ve already gained 260,000 jobs so that would leave 530,000 new jobs expected over the remaining 9 years.
The spending forecast and past job growth patterns indicate that we will add far more jobs and much faster than is predicted by BLS.
Of course, another recession would alter this, but this is not based on another recession.
Welcome to the New Year. What’s Up With Construction?
It’s been about two weeks since I wrote a blog post. With good reason. I’ve spent the last few weeks working sometimes 10 or 12 hour days getting all the information for and writing a construction economics report. Coming soon!
Here’s a few tidbits out of the mass.
The nonresidential buildings construction boom that is going on right now could become an historic expansion. I’m predicting 13.7% growth in 2016. Added to 8.8% in 2014 and 17.1% in 2015 that could be 39.6% growth in 3 years 2014-15-16.
Only 3 year periods back to 1993 that are comparable: 2006-07-08 40.1% and 1995-96-97 32%.
Similarly,
Total construction spending growth for the 3 years 2014-15-16 could reach 30%. I forecast 9.7% growth in 2016.
Only 3 year periods back to 1993 that are comparable: 2003-04-05 29% and 1998-99-2000 25%.
Well, there is one more comparable. The last three years of total construction spending growth for 2013-14-15 was up 27%, so this expansion is already ranked 2nd.
What we see here is the 1st or 2nd most active 3 year period of growth in construction on record back to 1993, and it’s already been happening for two or three years.
For perspective, residential spending for 2013-14-15 grew 46%! Similar only to residential spending in 2003-04-05 at 48%.
Welcome to the new year. So let’s go see if we can break some records.
