With the July 1 release every year, Census issues spending revisions to prior years, in this case to 2022 and 2023.
For 2022, Census added +$54bil (3%), mostly to Nonres Bldgs. The largest revisions in 2022 are Comm/Rtl +$10bil (+8%), Mnfg +$10bil (+8%), Power +$12bil (+11%).
For 2023, Census added +$44bil (+2%). The largest revisions are Comm/Rtl +$10bil (+7%), Amuse/Rec +$4bil (+11%) and Power +$12bil (+9%).
Along with 2022 and 2023, Census also revised Jan-Apr 2024. For the first four months of 2024, Census added +$14bil (2.2%), mostly to Residential +$7bil (+2.6%) and Power +$4bil (+8.4%).
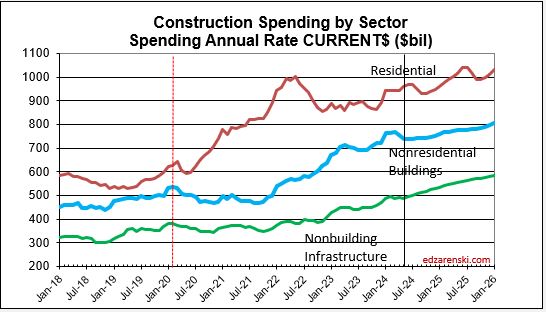
Overall, total construction spending, including the May data for 2024, is now forecast +8.5% over 2023. With the upward revisions to Jan-Apr, Rsdn spending forecast is now +7.7% for 2024. Nonres Bldgs (+6.9%) and Nonbldg (12.7%) growth over 2023 is down from prior forecasts not because 2024 spending went down, but because 2023 revisions were higher.
Compare this forecast to the forecasts issued in July in the AIA Consensus Construction Forecast.

From 2012 to 2024, construction spending has been up every year, averaging +8.2%/year. It’s been as low as +4% and as high as +15% in that time. Well, after taking out inflation, construction volume of business really increased only on average +3.2%/year. The low years were +0.2% to -0.2%. The highs were 2014 and 2015 when volume increased +7% and +9%. All other years were +5% or lower. The table below shows the percent volume growth for recent history and forecast.

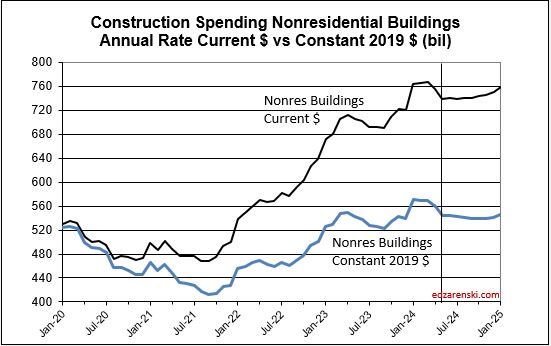
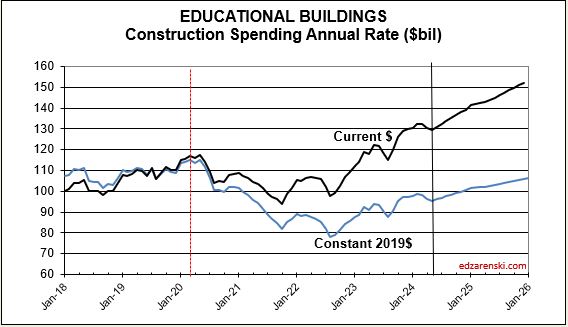
So far, through May, the inflation rate for all building types is much lower than most of the recent years. All inflation at this point is projected to finish 2024 between 3.5% and 5%. 2024 spending in constant$ will be the highest rate of volume growth since 2020. Keep in mind, the Constant$ in the table above (and in all the plots below) represents 2019$. If reported in 2024$, then 2024 would be constant and all total annual dollars would be higher. The percent Constant$ change from year to year would not change.


While the first 5 months of 2024 show no new highs for residential starts, the average of the first five months is higher than the average for 2023. Starts in 2022 still hold the highest monthly and highest annual average for residential starts.


The jobs plots below show a steady rate of growth in jobs before the spike down, as well as after. It’s just that the pattern was delayed for two years until jobs caught back up to where they were. Jobs move somewhat independent of the volume of work being put-in-place, at a very steady long term growth rate.
Since 2011, jobs have increased at an average of 3.3%/yr., several times reaching 4%/yr., seldom hitting 5%/yr. In the last 12 months jobs are up 3.6%. Year-to-date jobs are up 1.5% for the 1st six months.
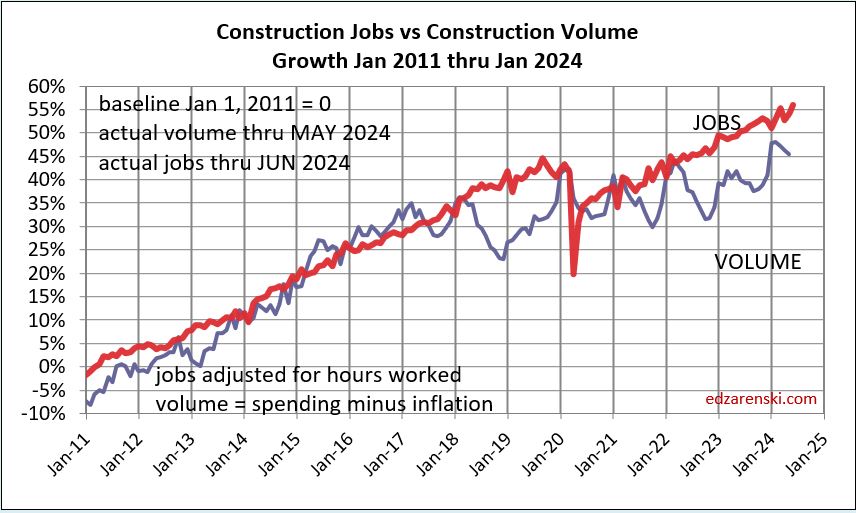
This enlarges the 2020-2025 portion of the plot above. Volume growth has spent much of the last three years still lower than needed to balance with jobs growth, but has made rapid recent gains. But look at the Volume plot, down midyear in 21, 22 and 23. My data file shows the next 4-5 month, a stall in spending, but we are at all-time highs, (so, it doesn’t hurt much) then followed by 15 months of growth.


JOBS Year-to-date:
- Residential jobs are up 1.0%. Volume is up 6.4%
- Nonres Bldgs jobs are up 2.0%. Volume is up 1%.
- Non-Bldg jobs are up 1.4%. Volume is up 1.3%
- Total all construction jobs is up YTD 1.5%. Volume is up 3.3%
JOBS In the last 12 months and last 24 months:
- Residential jobs are up 2.6%. Volume is up 4.1%. Over two years, jobs are up 4.4% while volume is up 6.9%.
- Nonres Bldgs jobs are up 4.8%. Volume is up only 0.4%. But look back over two years and jobs are up 8% while volume is up 18%.
- Non-Building jobs are up 3.1%. Volume is up 2.9%. Over two years, jobs are up 6.9% while volume is up 12%.
JOBS Since the onset of the Pandemic (May 2024 compared to Dec 2019):
- Residential jobs are up 15.0%. Volume is up 13.4%
- Nonres Bldgs jobs are up 5.4%. Volume is up 10.6%.
- Non-Bldg jobs are up 6.0%. Volume is down 5.8%
- Total Construction Jobs are up 9.2%. Total Volume is up 7.6%.
Non-Bldg Infrastructure volume is forecast to increase 10% in the next 12 months. Nonresidential Bldgs volume expected to increase 1.7%. Residential expected to increase 1.0%. I expect total volume to increase by 4% to 4.5% in 2024, I expect total construction jobs to increase about 3.5% to 4% in 2024. Total jobs through June are up 1.5%.

Confirming your job vs. spending growth analysis is adjusted for inflation. If so, the spread between growth and jobs suggests a forecasted period of additional inflation, in addition to contractor margins. How do you see the labor quality tying into your forecast on inflation?
LikeLike