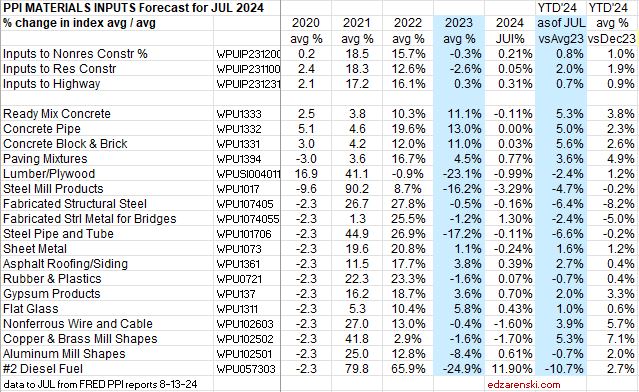
With the PPI release on Aug 13, for July data, we see both Inputs and Final Demand year-to-date (YTD) tempered considerably. Inputs since December are up only 1% to 2%. Final Demand is up less than 1% YTD.
PPI Inputs averaged for Nonres Bldgs, Residential and Highway, have all been at +1% or lower since Q3 2022. Inputs do not track final cost. No labor or Margins. Inputs can be at very different stages of manufacture and can include a variety of products. For instance Fabricated Structural Steel has been ordered from the mill and includes detailing and fabrication, ready to deliver to the jobsite, whereas Steel Mill Products has not yet been fabricated to any end-user details and in fact includes all types of steel, which would include sheet steel used for manufacture of automobiles and appliances.


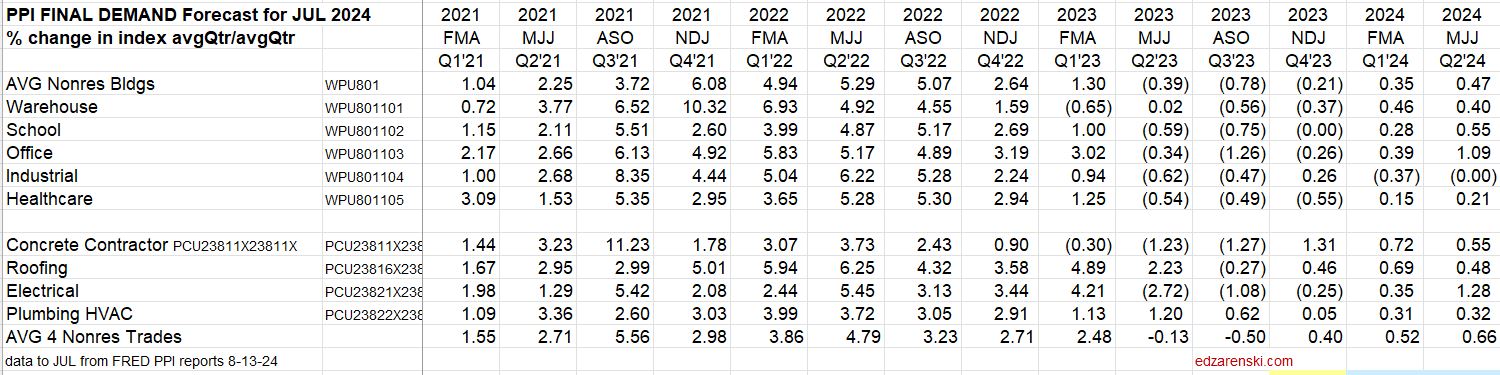
Construction Inflation per PPI Final Demand has been at -1% to +1% since Q2 2023. A number of independent firms report Nonres Bldgs inflation at 3% to 4%. I’m tracking at 3.1%.
Turner Index is up 1.9% for the first two quarters of 2024. That is up 3.5% from the average of 2023. RLB is up 2.4% since December and that is up 4.6% from the average of 2023. The U.S. Census New Homes index is up less than 1% since December but that is up 2.8% from the average index in 2023. These are all final cost indices.