11-21-24 My construction spending forecast for 2025 Nonresidential Bldgs is down 1.5%. But this decline is driven by projects ending in Manufacturing. In the last 3 yrs, there were $230bil Mnfg new starts, most in 2022, about $130bil above normal for 3yrs. Now some are ending. Without Mnfg, Nonres Bldgs 2025 spending would be up 4.5%. (This original article written 11-21-24)
(edit 4-15-25 only to update forecast. Mnfg data has not changed) Construction spending for 2025 Nonres Bldgs is forecast up 2.9%. Manufacturing is expected to fall 9%, from $233bil in 2024 to $212bil in 2025. Mnfg is forecast to drop to $174bil in 2026. Without Mnfg data, Nonres Bldgs 2025 spending would be forecast up 8.2% in 2025. Tariffs and/or recession would (will) lower this forecast.
Now, let me clarify. The spending I reference is Census PIP current$ spending. It doesn’t matter if we look at current$ or constant$ (inflation adjusted), by the end of 2025 spending on Mnfg bldgs will be down 25%. The new starts above are those reported by a firm that tracks construction starts. But, only about 40% of actual starts are captured in that number. Real Mnfg starts over last 3yrs is just over $600bil, whereas normal starts without any influx of government investment would be about $300bil/3yrs. Most of those starts were posted from Q3’22 thru 2023. By far the highest period of new starts was the 2nd half 2022. About $100bil of that spending growth over the 3 years is inflation, leaving the remainder of about $200bil in excess (but welcome) spending growth attributed to government investment.
Mnfg projects can have a longer spending curve (on average) than most nonres bldgs, so obviously end dates are pushed out further. The average spending for all nonres bldgs is spread out over a spending curve of approximately 20:50:30, where 20% of all the starts in the year gets spent in the year started, 50% in the 2nd year and 30% over the 3rd and 4th yr. The spending curve for Mnfg is more like 17:40:30:13. We will see declining spending from this pool that will impact total nonres bldgs spending at least for the next 2-3 years.
So while the outward appearance in the data may be that nonres spending in total is declining, in large part it may be due to mega-spending on mnfg bldgs tapering down upon completion, creating large, but normal, annual declines. This may have the effect of offsetting gains in other nonres bldgs markets. That influx of spending is unlikely to be repeated. So, as we see mnfg spending begin to taper off, we should not expect additional support from new mnfg starts. We should expect mnfg starts to return to a more normal growth rate.
edited 2-4-25 added next paragraph and following Mnfg spending plot
Whenever we get an unusually large increase in new construction starts and spending, the tapering off of those projects leads to a decline on the tail end of the timeline. Peak spending was near the midpoint of projects, so after that it’s all declining. Mnfg new starts peaked in 2022-2023. Here’s what the manufacturing spending taper may look like.

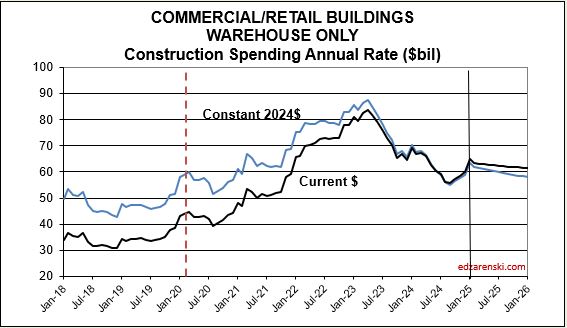
edited 4-11-25 added Warehouse Plot and text
This is exactly what happened in Warehouse spending. Warehouse contract starts began to rise in 2020, but rose rapidly in 2021 and 2022. Therefore, the rate of spending began to rise in late 2020, then rose substantially from late 2021 well into 2022, when project spending would have been expected to peak. New starts began to fall back in 2023 and more-so in 2024. Peak spending was reached in Q1 2023 and spending has fallen in 18 of the last 24 months. The current rate of spending is now back to the level of 2021.
This same scenario will occur in Highway/Bridge. Normal starts have consistently been about $100bil/yr, with slow growth. But for the last 3 years, actual starts were closer to $500bil for the 3 years. This strong growth in starts is expected to continue at least into 2025, totaling near $650bil for 4 years. Again, consider that part of that is inflation, but the remainder is government investment growth. So a decline from the taper back to normal for Highway/Bridge may not show up at least for the next few years. But once the taper begins it will have the same effect on Nonbldg Infrastructure spending that we will see from Mnfg in Nonres Bldgs.
If you know in advance what to expect, there should be no surprises when it occurs.
