The headline construction data is the year-to-date (ytd) comparison. Through July data, ytd2025 is -2.2% compared to ytd2024. But where is it headed. Watch for this. Last year spending was increasing until it peaked in October. This year spending is falling and will continue to fall into Q3. Every month now the ytd spread gets worse, because 2025 is decreasing and 2024 was increasing. It’s significant in residential which is currently thru July down YTD 4.0% and is forecast to finish 2025 down 5.2%.
Construction Spending is down 7 out of the last 9mo, now down -3.5% or an inflation adjusted total -6.5% since October. Over that period spending is down most significantly in Residential. Residential spending peaked in October 2024. Since then it’s down 10% ($90bil). Warehouse is down -12% ($8bil). Manufacturing is down only 6% but that is $15bil. Manufacturing is experiencing the tail end of a huge volume of work that peaked also in Oct., 2024. It is expected to continue on a slowly declining spending slope for at least the next year. Spending is up the most now in Data Centers, on track to gain 32% (+$10bil) in 2025 and 31% ($13bil) in 2026.
When spending is up by just a little it looks like we are making progress. But we are always fighting inflation. If spending is up by 3% but inflation is 4%, then real business volume declined by 1%. If spending is down 5%, with 3% to 4% inflation, business volume is down 8% to 9%.
Overall, business is declining. The current data in the table below indicates constant$ spending, or business volume, drops for the next three years.

Do not overlook the impact of inflation. Residential spending for 2025 may end down only 5.2% but spending includes inflation of 4.7%. When real residential volume is compared to real volume in 2024 we find that residential volume of business declined 9.1% in 2025. This happened also in 2023, then not since 2009, when it fell 24%. Let that sink in! Residential business volume in 2025 is forecast down almost 10% ($85bil). Since the most recent peak spending in 2022, residential volume is down almost 15%, (~$150bil).

Since 2011, (excluding recession yrs) construction jobs thru Aug increased on average by 150,000 over the 8mo. For 2025, jobs thru Jul increased only 6,000, the slowest jobs growth (ex recessions) in 50 years. Residential construction jobs peaked in Sep’24. Spending was near the May peak from August to December. Since then, spending has been falling and will continue to fall. Rsdn jobs have fallen 7 out of the last 10 months. Rsdn jobs are down 1% ytd. Nonresidential and Nonbuilding jobs are both increasing slightly. The outlook for 2025 has construction jobs falling by 40,000. Jobs are expected to fall even more in 2026.


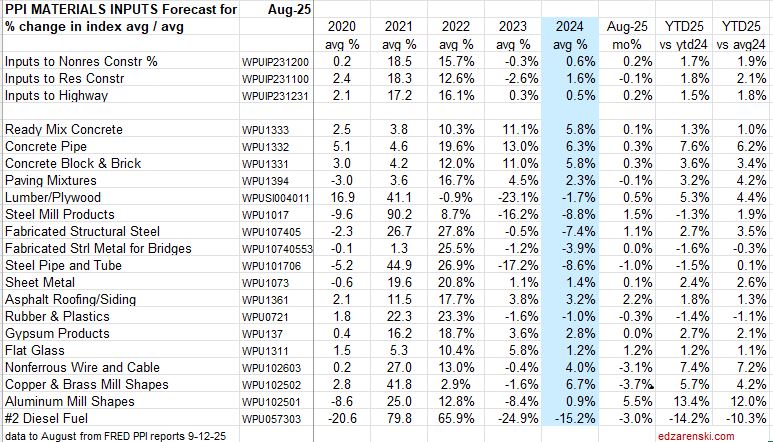
While many of the construction cost items in the PPI are tame so far, there are a few that have outsized gains. PPI YTD thru Aug vs the 2024 avg Conc Pipe +6.2%, Lumber/Plywd +4.4%, Fab Str Steel +3.5%, Nonferrous wire +7.2%, Alum Shapes +12%, Diesel -10.3%.
Final Demand pricing for Nonres Bldgs holding down at 2% or lower. Construction Analytics inflation rate for 2025, which includes inputs from eight sources, is 4.4%.
Remember, the PPI does not track imports or tariffs.

