After some delayed data released recently, we now have August Construction Spending and Sept Jobs.
In the past 12mo, Rsdn construction jobs fell 46k (-1.4%). Nonres Bldgs jobs increased 59k (+1.6%) and Nonbldg jobs increased 24k (+2.1%). Rsdn spending is down 5% (-$39bil) Nonres Bldgs is down 3.4% (-$25bil) Nonbldg is up 3.1% (+$15bil) Expect total spending in 2025 down 2.1%, jobs UP 1%
Construction Spending Forecast Total spending varies less than 1% from current through 2026 Jobs YTD up 16k. Only times job growth that slow was 2020 or recessions. 2011 through 2024, even with losses in 2020, avg jobs growth was 200k/yr. Don’t expect job openings (see JOLTS) in near future.
Environment for construction jobs looking difficult. Constant $ spending in 2026 is down just less than 1%. But Volume of work (spending minus inflation) available is down just over 4% and is declining all through 2026. Biggest declines by far, Manufacturing and SF Rsdn.

The decline in Manufacturing construction spending is due to having passed the peak in the scheduled project timelines for the large volume of mega-projects that started in 2021-22-23-24. (I wrote about it in more detail in Nov’24 in the article linked.) Peak spending is typically just past the midpoint of project construction. From Apr 2024 to Nov 2024, Mnfg spending averaged $240bil., the highest rate of spending on record. In 2025 it started the year at a rate of $$230bil but will end the year at $210bil. By the end of 2026 the rate of spending drops to $190bil.
The Manufacturing Spending Taper

My forecast has not changed much overall in the last few months. Residential has gained in revisions added to June and July and Aug posted a very strong 1.3% gain.


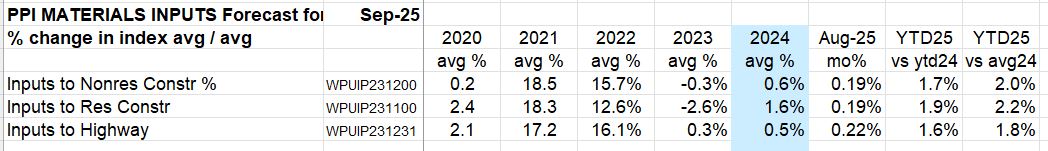
We will wait a little longer before we see any meaningful changes in construction materials input costs. September data (released 11-26-25) reported here. Also remember, PPI does not track imports, only domestic producers. Therefore, any implied increase in PPI being related to tariffs would be a domestic reaction to an import tariff. We can expect that.
INPUTS thru Sept up ~2% from avg2024. Final Demand for Nonres Bldgs is up 1.2% ytd vs avg 2024. However, Oct is the revision month for Q3 Final Demand data, so Final Demand data not finalized for Q3.