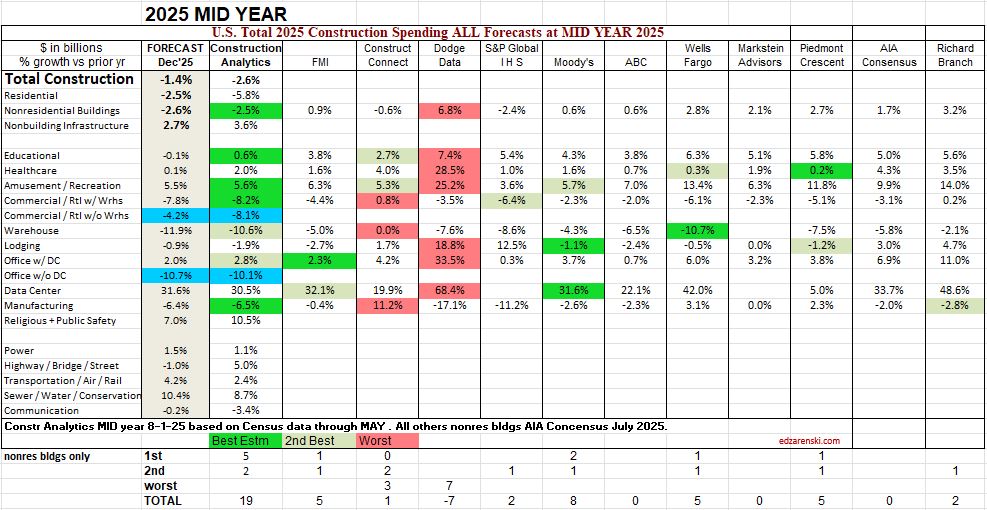
This is a simple list compiled of the percent growth forecast by each firm at Mid year 2025, then compared to the final outcome at year end. It’s a “How’d we do? comparison. The column titled Forecast’25 is the year-to-date spending through Dec. reported by Census 2-28-26, or in essence, the 1st look at final spending for 2025, the number all forecasters are trying to predict. There will still be minor revisions to this number.
To get an idea of how each firm’s forecast compares, I scored 3 points for closest forecast to actual, 2 points for 2nd closest and minus 1 point for worst forecast. Only Nonresidential Bldgs is counted here. We always see the forecasts published. We seldom, if ever, see the final outcome published.
You can search this website (search for the word Compared) for the outcome results for the last 6 years. Construction Analytics, by far, has proven to post the best forecasts. Not always, but more often than any others, particularly in the Midyear forecast where Construction Analytics, out of six years, has three of the best and two of the 2nd best forecasts.
AIA Consensus did not report Commercial/Retail w/o Warehouse, nor Office w/o Data Center. Construction Analytics did not report Comm/Rtl w/Warehouse nor Office w/Data Center, but those values were available in the file data and are shown here for comparison. The two items highlighted in blue are not used in the score.