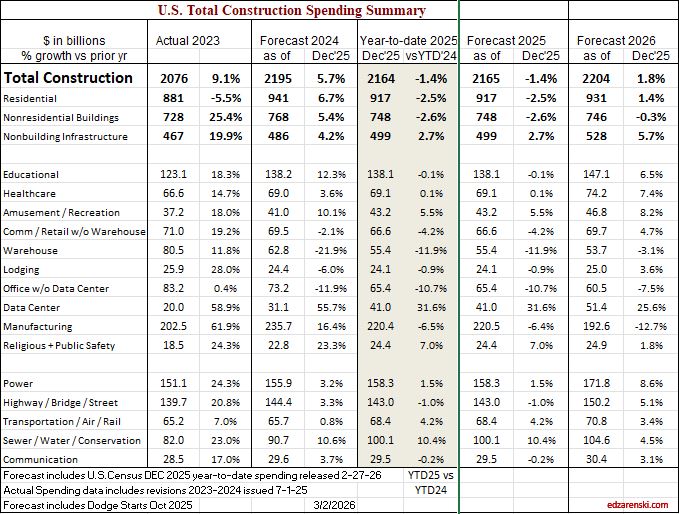
First pass at forecast 2026, includes first Census report of final 2025 spending. 2025 will be revised several times in the coming months, Dec and Nov are still subject to revision. All of this is behind what would be normal schedule due to shutdowns. Then all of 2025 will be revised, often a more significant revision, with the release of May data on July 1. However, this represents my initial Outlook for 2026 spending. More to soon follow on jobs and inflation.
SPENDING
Tracking spending throughout the year:
There are several months during the year when spending is remarkably consistent. For instance, over a period of 25 years, June and July have averaged 9.1% and 9.2% of actual annual spending, with a high/low range variation of less than +/- 0.25%. August and September have the highest rates of annual spending, but with slightly higher rates of variation. January and February have the lowest share of annual spending with the highest rates of variation. May, June, July and August have the lowest rates of variation from average across 25 years. Using subsets of months with the lowest variation in annual spending is a way to check forecasts during the year.
If we add up the total NSA (Not Seasonally Adjusted) Construction $ spent in AMJJAS (Apr thru Sep) and divide by the statistical average spending for those 6 months, 23 out of 25 times the result is within less than +/-0.75% of the final total annual spending. So once we have September data we have a subset that usually predicts the final spending outcome for the year within less than 1%. If we add up the total (NSA) Construction $ spent in MJJA (May thru Aug) and divide by the statistical average spending in those 4 months, 24 out of 25 times the result will be within less than +/-1.25% of total annual spending. Both of these subsets of data, for the last three years, predicted final annual spending within less than +/-0.5%.
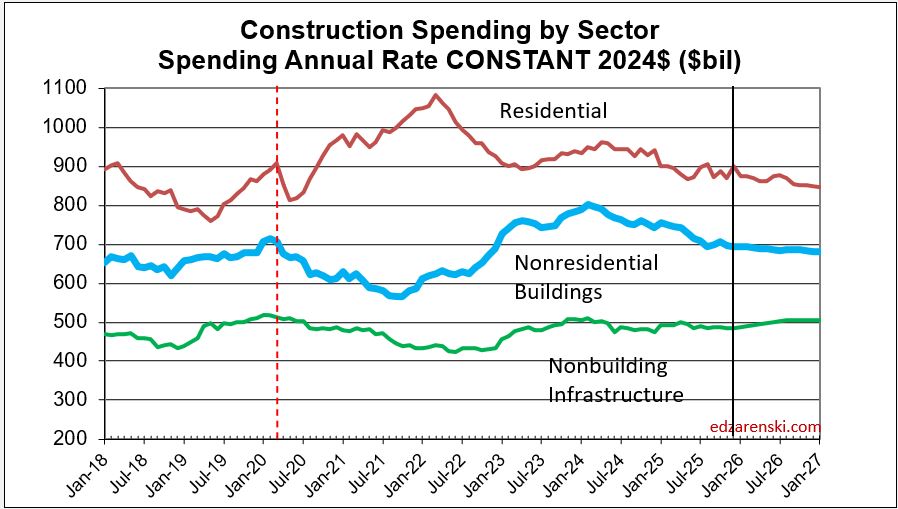
My forecasts as of July and again as of August data in 2025 were both within less than 1% of the reported final annual spending through December data. My forecasts for Nonresidential Buildings, since June data, have been within +/-0.5% of final 2025 spending.
INFLATION
Notice in the table below, I carry inflation at about 4% in 2025 and similar in 2026. Actual inflation values are a composite of eight different sources, so the inflation carried in these reports will never be the highest or lowest. Predicted inflation reverts to historical averages with some influence of current conditions. Taking 4% out of all the spending numbers above gives the Constant$ results or actual volume of business conducted. For 2025 business volume declined 5.1%. For 2026 it’s expected to decline about 2.3%.
An increase in gasoline/diesel prices results in an increase on every single material item used in construction. If it’s not delivery charges, it’s heavy onsite machinery operation to install. Fuel surcharges are not uncommon in construction contracts. It could also be in fuel needed to manufacture products. The current world situation may/will have adverse effects on future construction inflation.
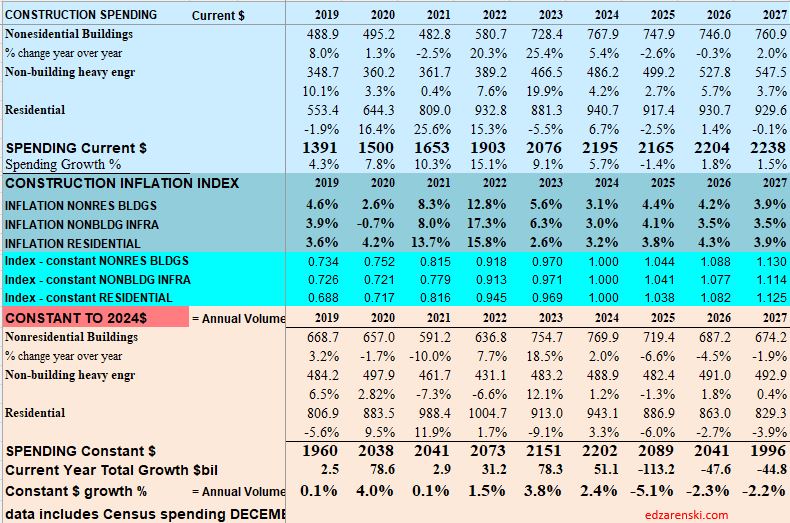
Constant $ adjusts all spending for inflation to represent dollars spent at the same point in time. Throughout these analyses, Constant $ are adjusted to midyear 2024. Constant $ is a measure of the change in business volume.
Inflation increases revenues but adds nothing to business volume. If your construction business revenue increased less than 5.1% in 2025, your total revenues did not even keep up with inflation. Your real business growth fell in 2025.
PPI
Data through February for individual Producer Price Index items. PPI items do not reflect imports, so tariffs would not be reflected in these numbers. Also current world oil situation would not yet be captured in values through February. I would expect to see numerous line items and total inputs increase in future months.
Cost of Inputs YTD thru Feb is showing the fastest rate of inflation recorded since 2022.
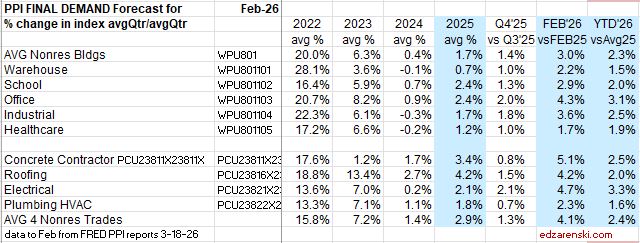
Construction PPI
largest gain in last month Deisel +20%, but still down -11% from average 2025
largest gains over last 6mo Aluminum +43%, Copper +21%, Steel +9%, Paving +9%
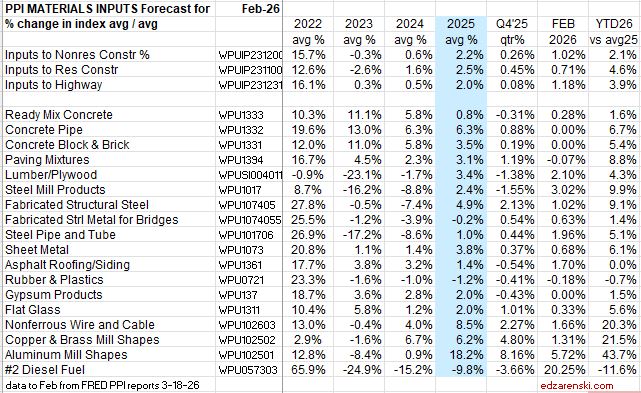
Almost all 2025 final cost inflation was added in Q4 2025, and in every case YTD’26 inflation has increased since Q4.
JOBS
Construction jobs from Dec24 to Dec25 fell by 4,000. But the better comparison, Avg’25 vs the Avg’24, increased by 58,000. However, spending was indicating a decline in jobs. Current $ spending in 2025 declined -1.4% or $30bil. After inflation, or Constant$ spending, declined -5.2%. That would indicate a decline of 400,000 jobs, but jobs seldom fall at the same rate as spending.
When constant$ spending declines more than jobs, that indicates a decline in productivity. It’s safe to say that construction productivity is at its lowest point in over 30 years, and by the looks of the following plot, probably the lowest ever.
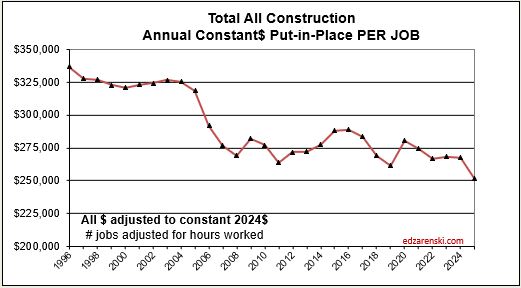
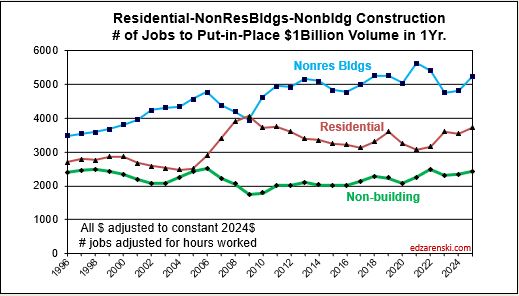
The inverse of $ put-in-place per job (the plot above) is # of jobs to put-in-place a given amount. The plot below does that for $1 billion worth of construction volume. For every billion$ of volume Nonres Bldgs, it takes about 5,000 jobs one year to put-in-place. For residential it’s only about 3,700 jobs. Both vary from year to year. For Nonbldg infrastructure jobs it takes only about 2,500 jobs to put-in-place $1billion in one year.
Although Current$ spending in 2026 is expected to increase slightly, Constant$ spending after inflation is projected to fall about 2.5%, indicating a decline of 200,000 jobs. Once again, don’t expect jobs to fall at the same rate as spending, so don’t expect a decline of 200,000 jobs, but I don’t expect even slow jobs growth like we see in 2025.
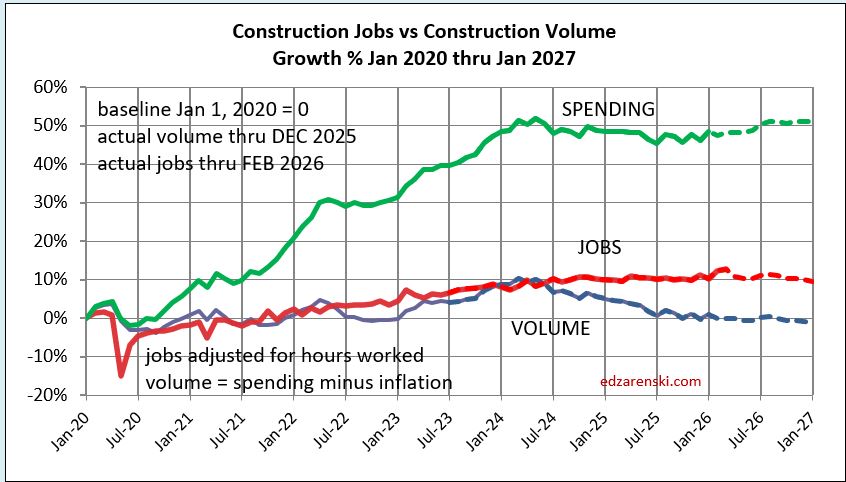
YTD through Feb. 2026, construction jobs are up 50,000 over Jan-Feb 2025. That’s kind of a hard to believe number, since construction Constant$ spending, or real construction volume, is forecast down 1.5% or $2.5bil (NSA not seasonally adjusted) over the same two month period. That would have us suspect a loss of 10,000 jobs. Even more astonishing is that workforce hours worked over the same 2 month period ’26 vs ’25 increased 2.5% or the equivalent of +200,000 jobs.
In 2022, 2023 and 2024, jobs increased in 35 out of 36 months. Construction volume fell in 14 out of those 36 months, but average volume increased all three years. We added 680,000. Total 3yr annual average volume increased 8%.
In 2025 plus Jan-Feb 2026, construction jobs declined in 9 out of 14 months. Volume has fallen in 10 out those 14 months. Jobs are down only 0.6% since Dec 2024. Volume fell 5.1% in 2025 and is forecast to fall 2.3% in 2026. Currently there is no growth in volume to support jobs growth.
January 2026 posted the largest construction jobs increase (+48,000) in 4 years. There has been no consistent increase in volume to support jobs growth since the 1st half of 2024.
Unemployment and productivity includes only jobs counted in the official U.S. Census Bureau of Labor Statistics (BLS) jobs report. There is a large, unaccounted for shadow workforce in construction. By some accounts, 40% or more of the construction workforce in California and Texas are immigrant workers. Immigrants may comprise between 14% and 22% of the total construction workforce. It is not clear how many within that total may or may not be included in the U.S. Census BLS jobs report. However, the totals are significant enough that they would alter some of the results commonly reported.
MARKETS
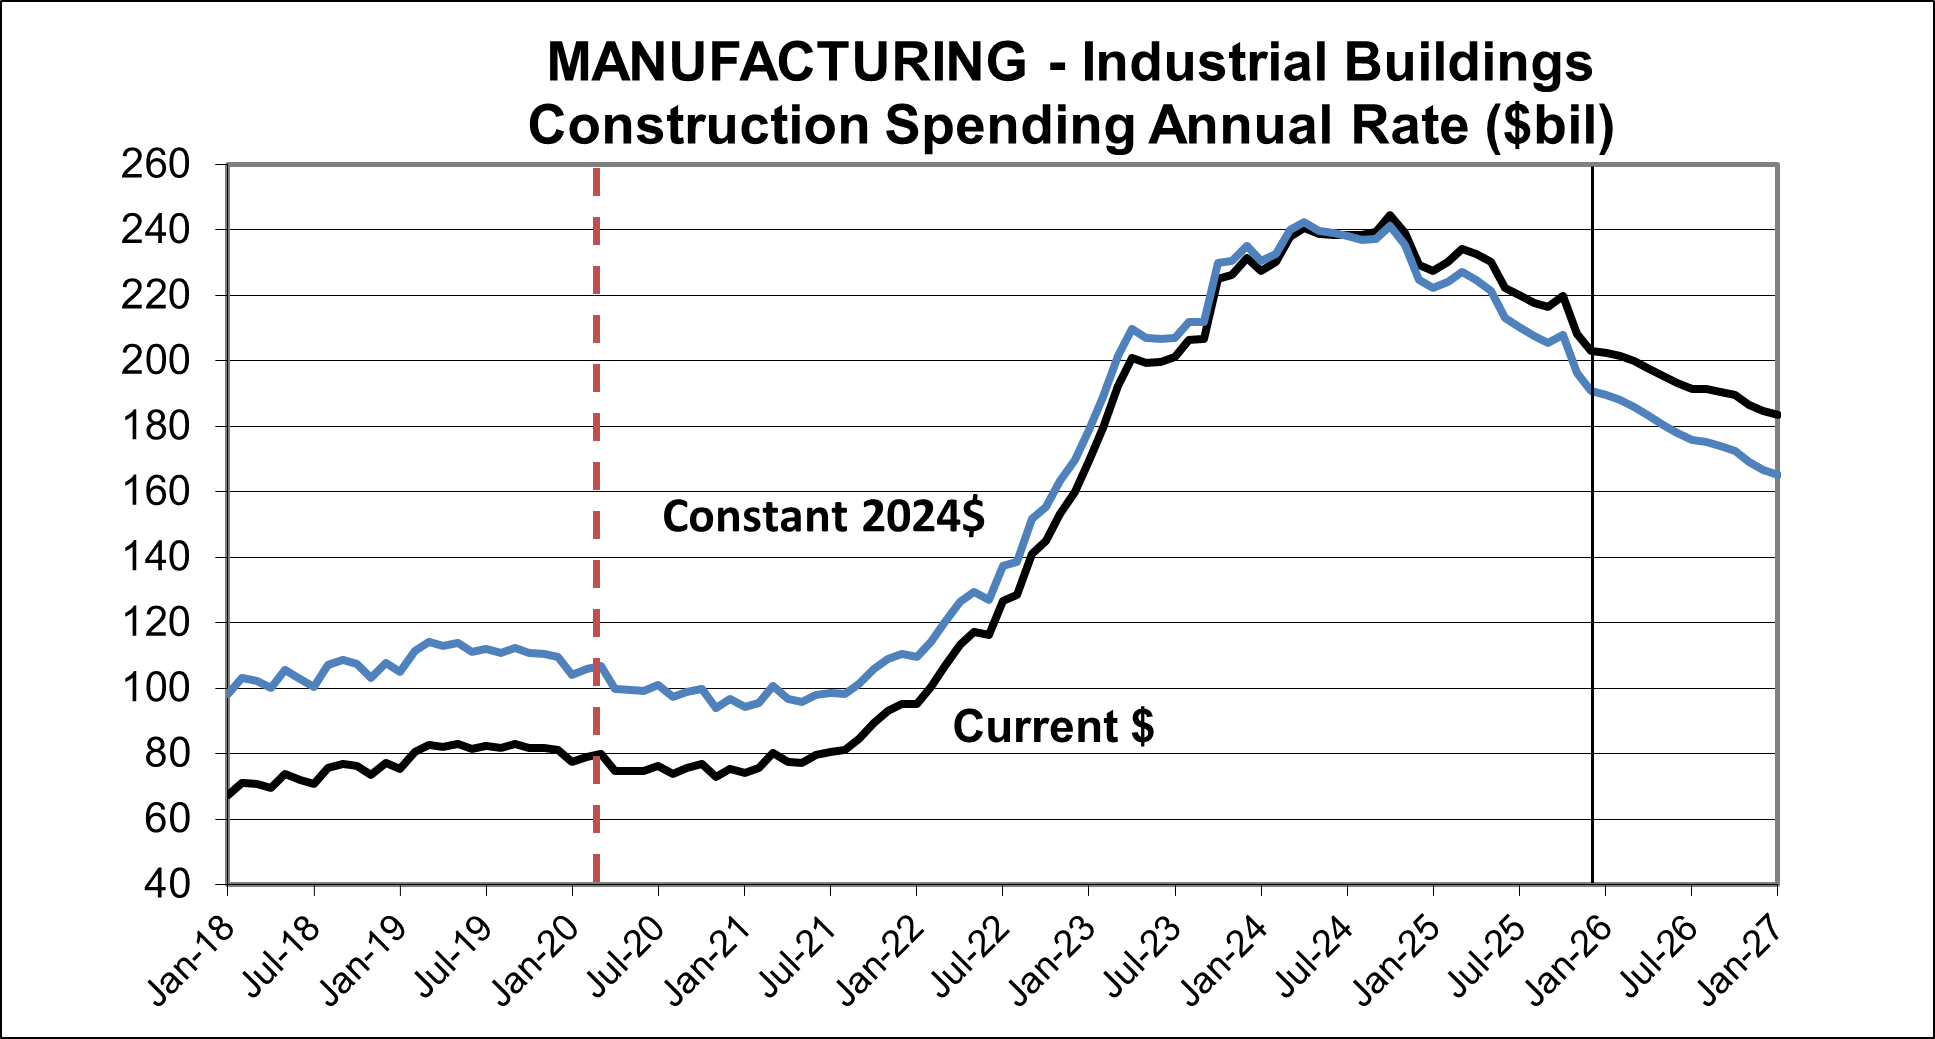
Manufacturing starts peaked in early 2023, now down 25%. Starts will fall another 10% in 2026. The spending decline in Manufacturing is expected and was predicted in 2024. With peak new starts in 2023, and peak spending from those starts expected at the midpoint of project activity, a year to perhaps 18 months later, it is not unexpected to see the falloff from peak spending. Spending was forecast to fall in 11 of 12 months in 2025. It fell in 9 months for a net decline of -6.5% for the year. It has increased only once since March 2025. Spending is forecast to fall in 11 months in 2026 for a net decline of -12%. Spending continues to decline into 2027.
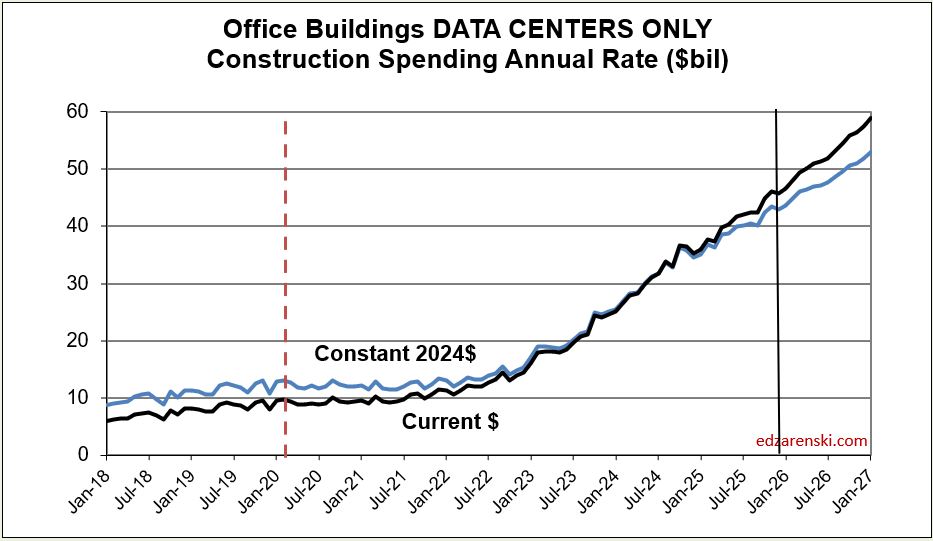
Data Center new starts have been increasing $10bil/year for the last three years contributing to rapid spending growth. Starts are expected to increase the next few years. But recent events may lead to cancelation or delay of some future projects. 25 data center projects were canceled in 2025 amidst surging local opposition — 4X as many as in 2024. Growth is expected to hold around 20% to 25%/year the next two years.
Then we have articles like this: “The largest data center in the world is scheduled to be built in Ohio, total cost $40 billion.” Now, all of that cost must not be construction of the data center. Some must be computer equipment. But, just to put that in perspective, if $25 billion of that is building construction cost, it will take a daily average of 15000 workers 8 years to build a $25bil building cost data center complex. That’s 6% of the entire construction workforce in Ohio. And that is daily average for 8 years. That means the project could starts off with 1,000 workers onsite and could peak at 30,000. And it will require 1/3 of Ohio’s entire statewide power grid capacity. That one project represents about 5% of the entire national construction forecast for data centers over the next 8 years. Seems highly unlikely.
( Personal opinion – Data Center growth will be restricted by difficulty to ramp up power generation and transmission. This in turn will slow construction spending growth in the data center market).
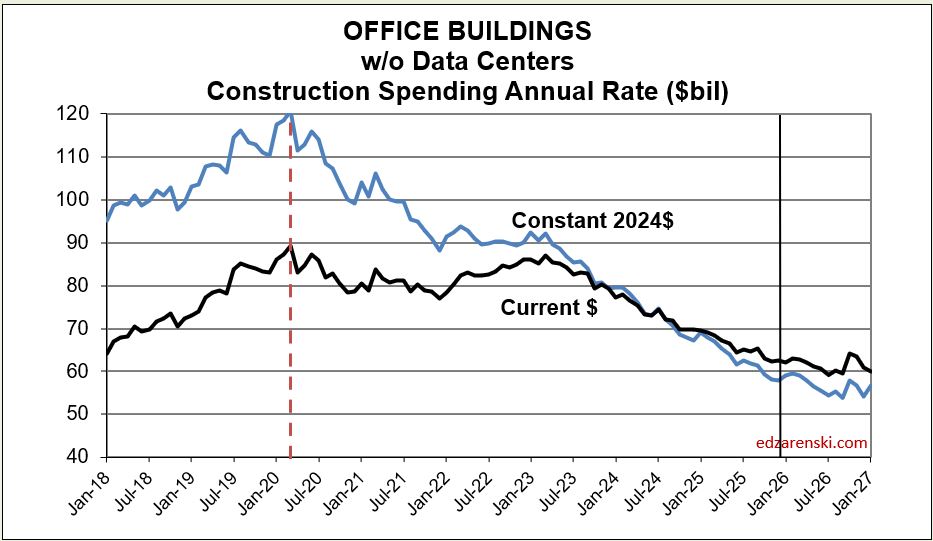
Without Data Centers, Office spending is doing poorly. Spending in Current$ peaked in early 2020 then again in early 2023. Spending is now down 30% from the 2023 peak and is predicted to decline 7% in 2026, then remain flat in 2027.
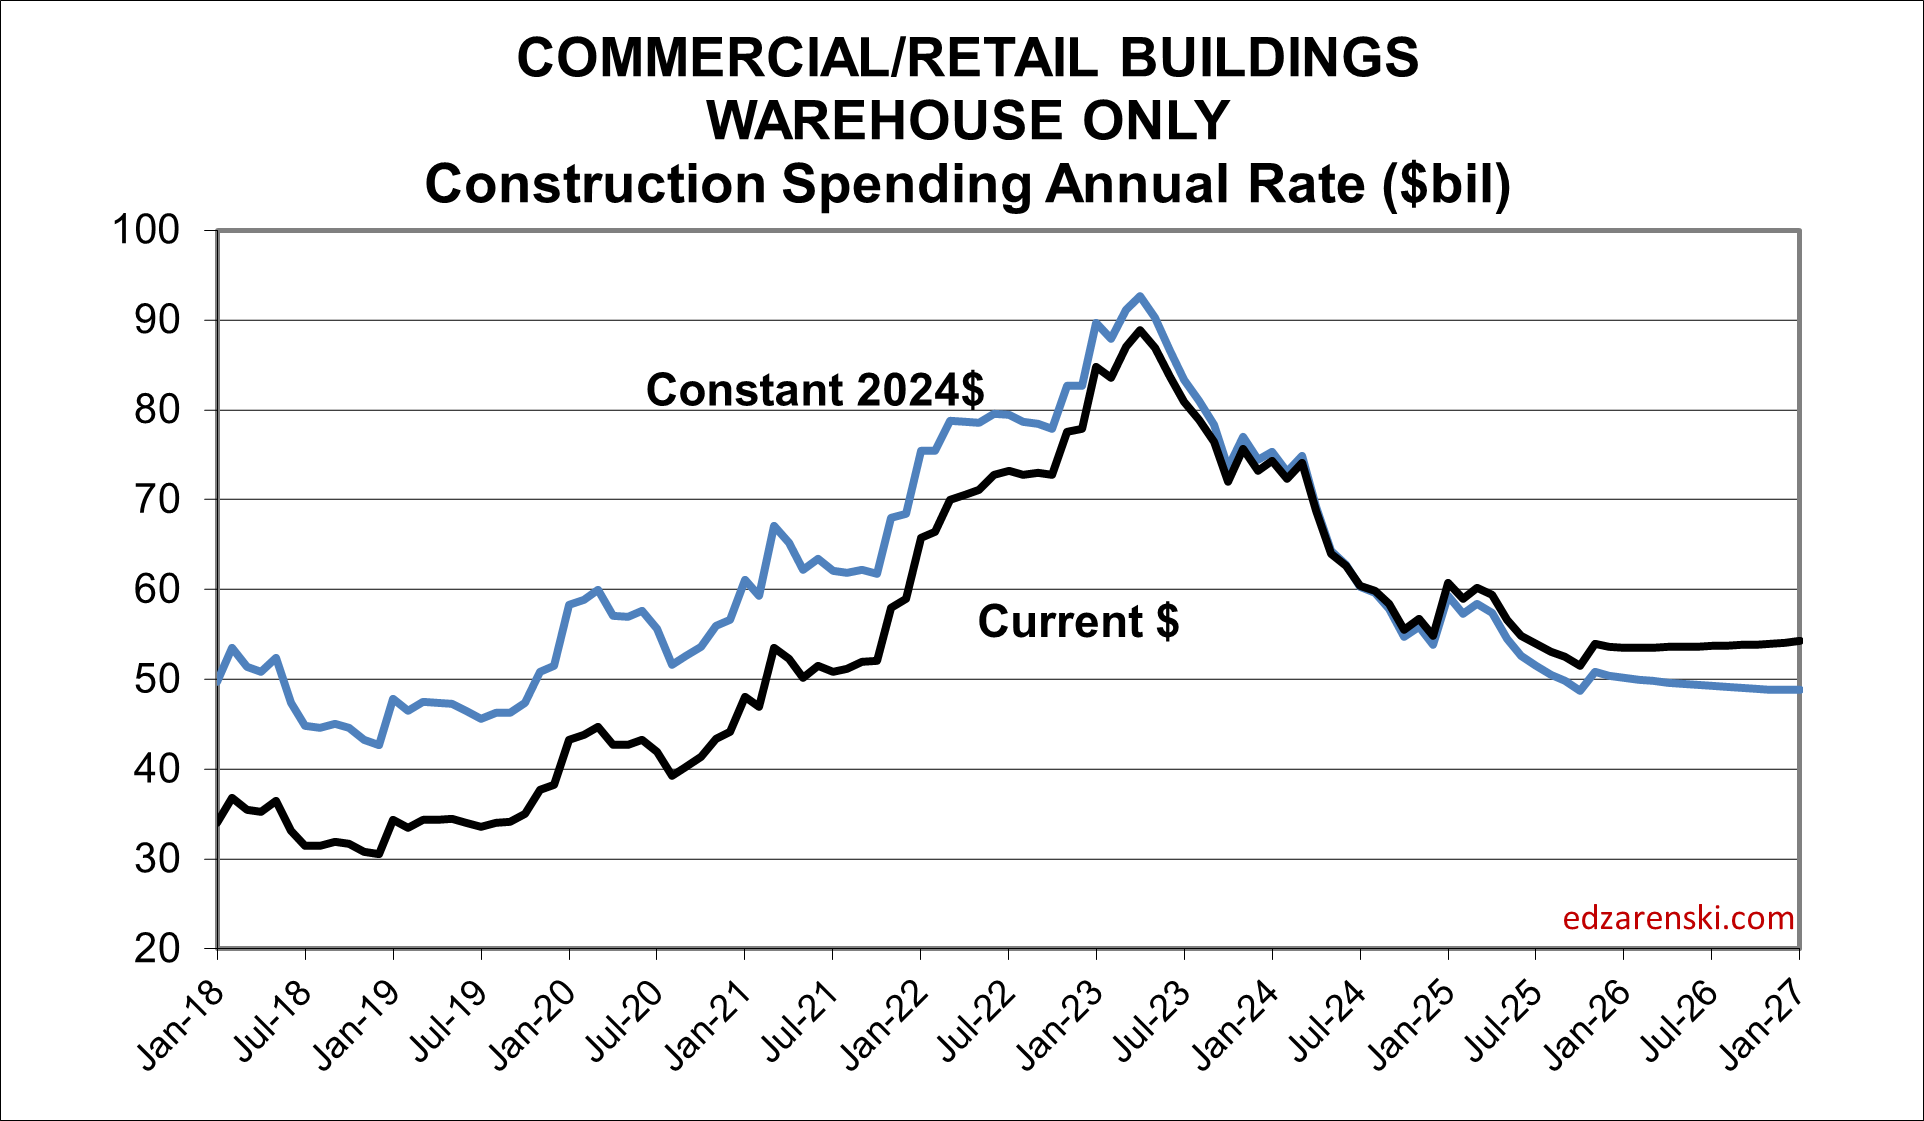
Warehouse starts peaked in 2022 and since have fallen 25%. Spending is down 35% from 2023 peak and may remain near this level through 2027.
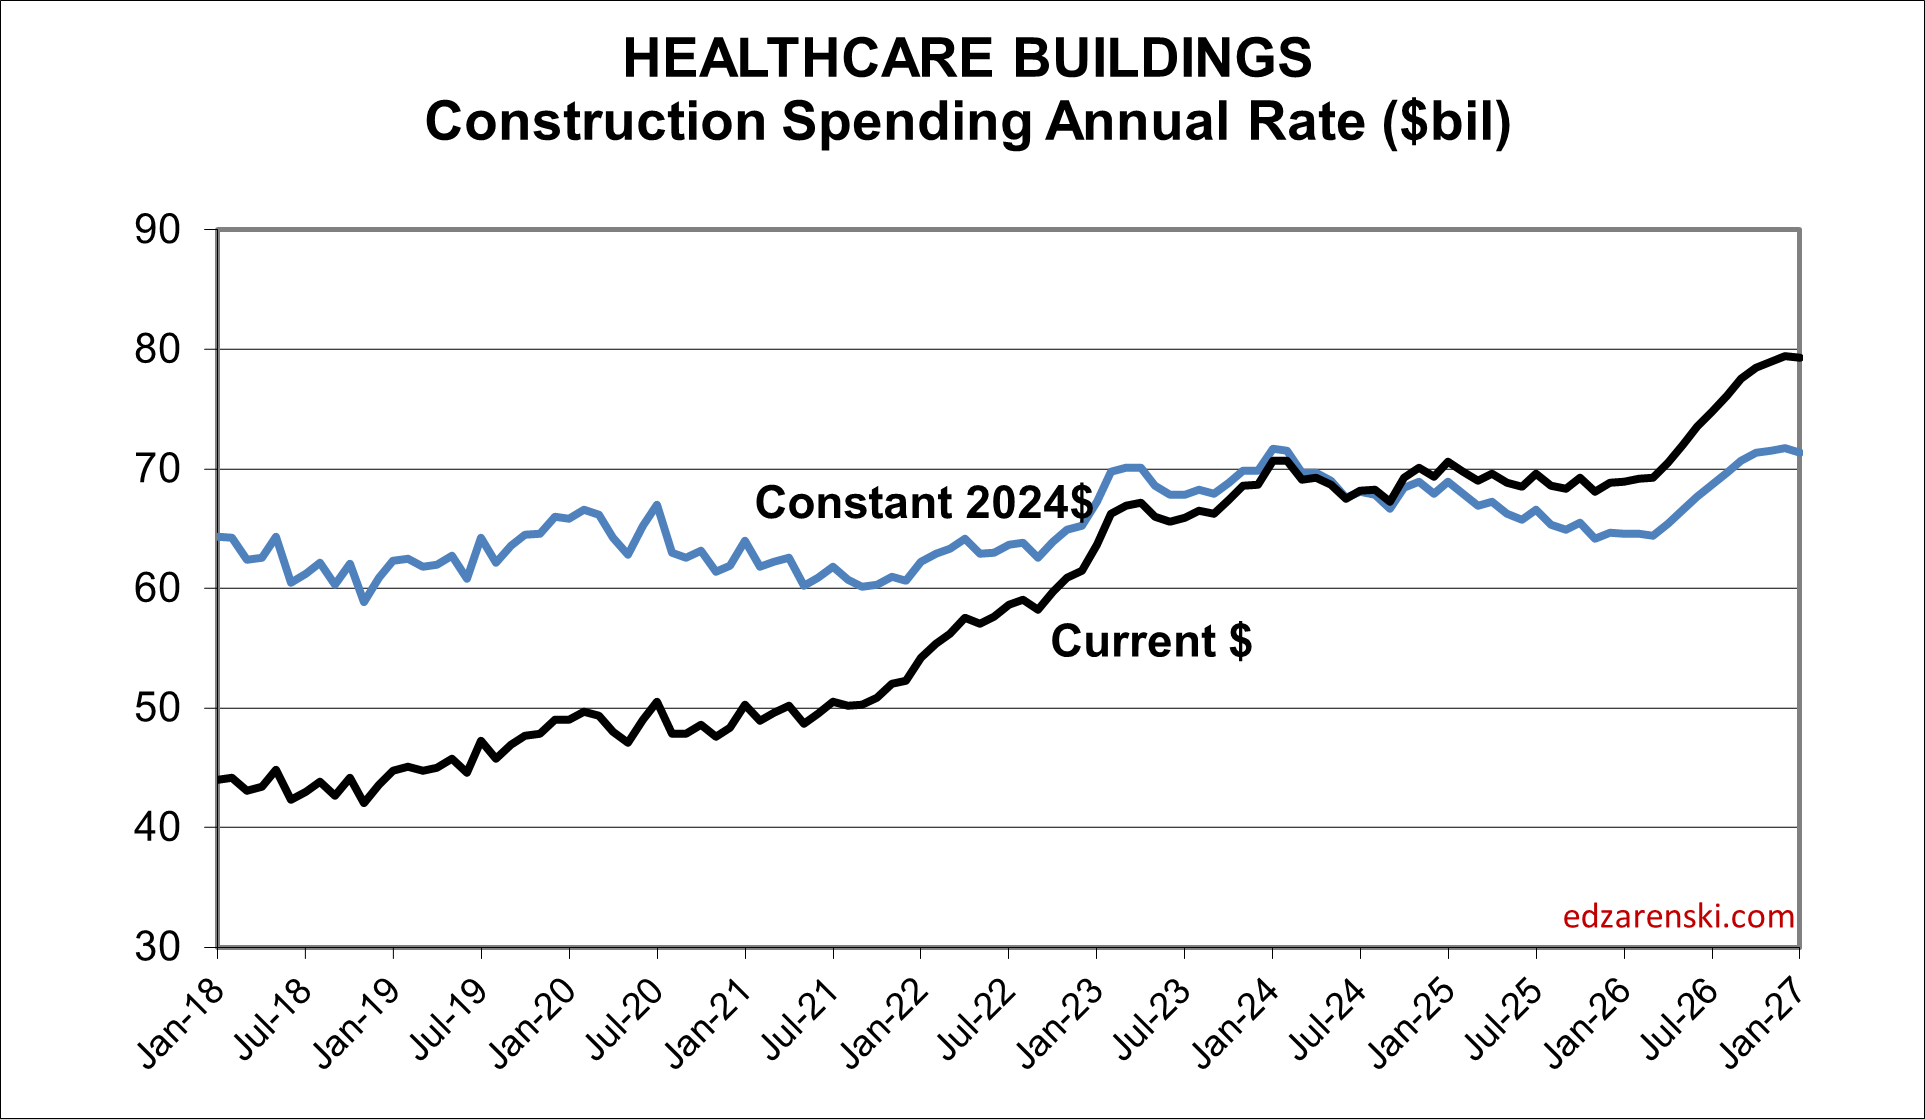
Healthcare spending is a bright light among the nonresidential markets. My forecast predicts a 7% increase in 2026 and a 12% increase in 2027.
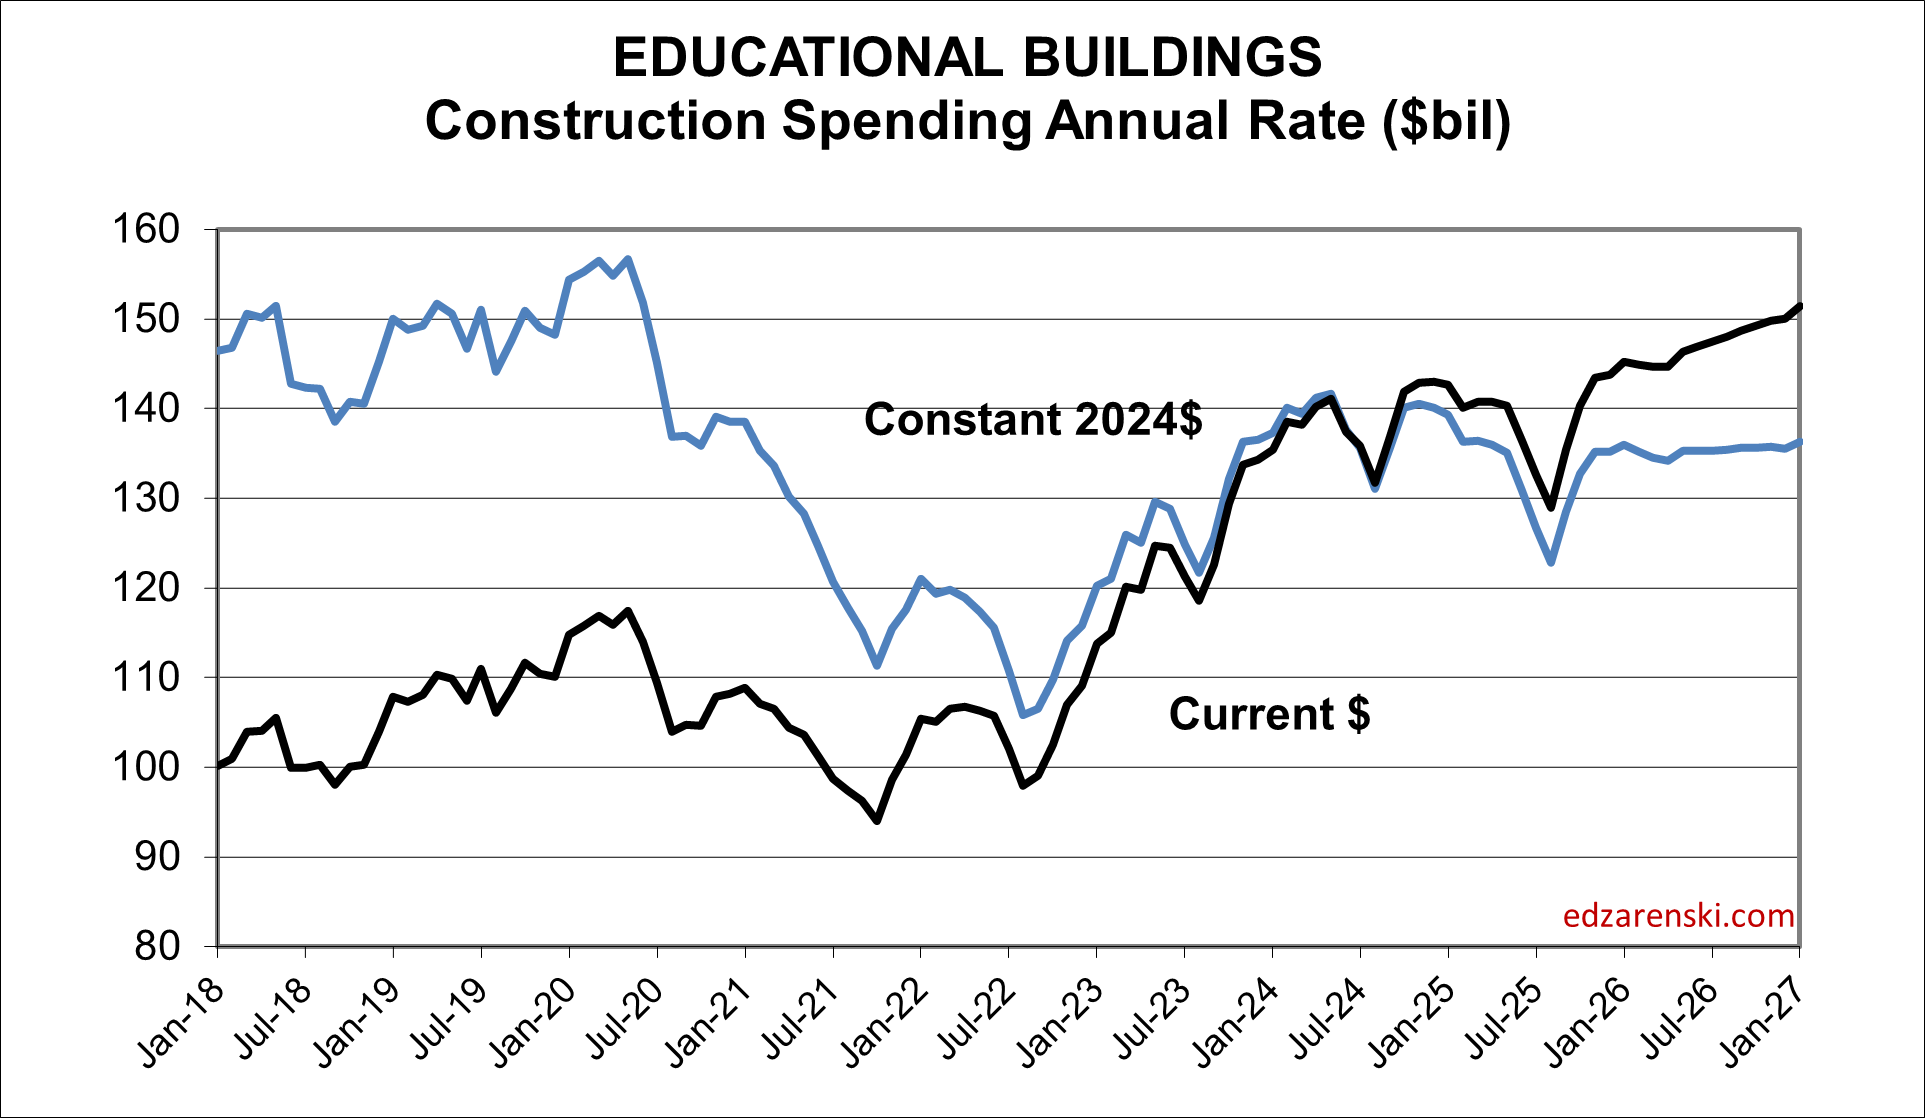
Educational spending advances in both 2026 and 2027, but not quite at the same rate as Healthcare, and certainly not near the rate of Data Centers.
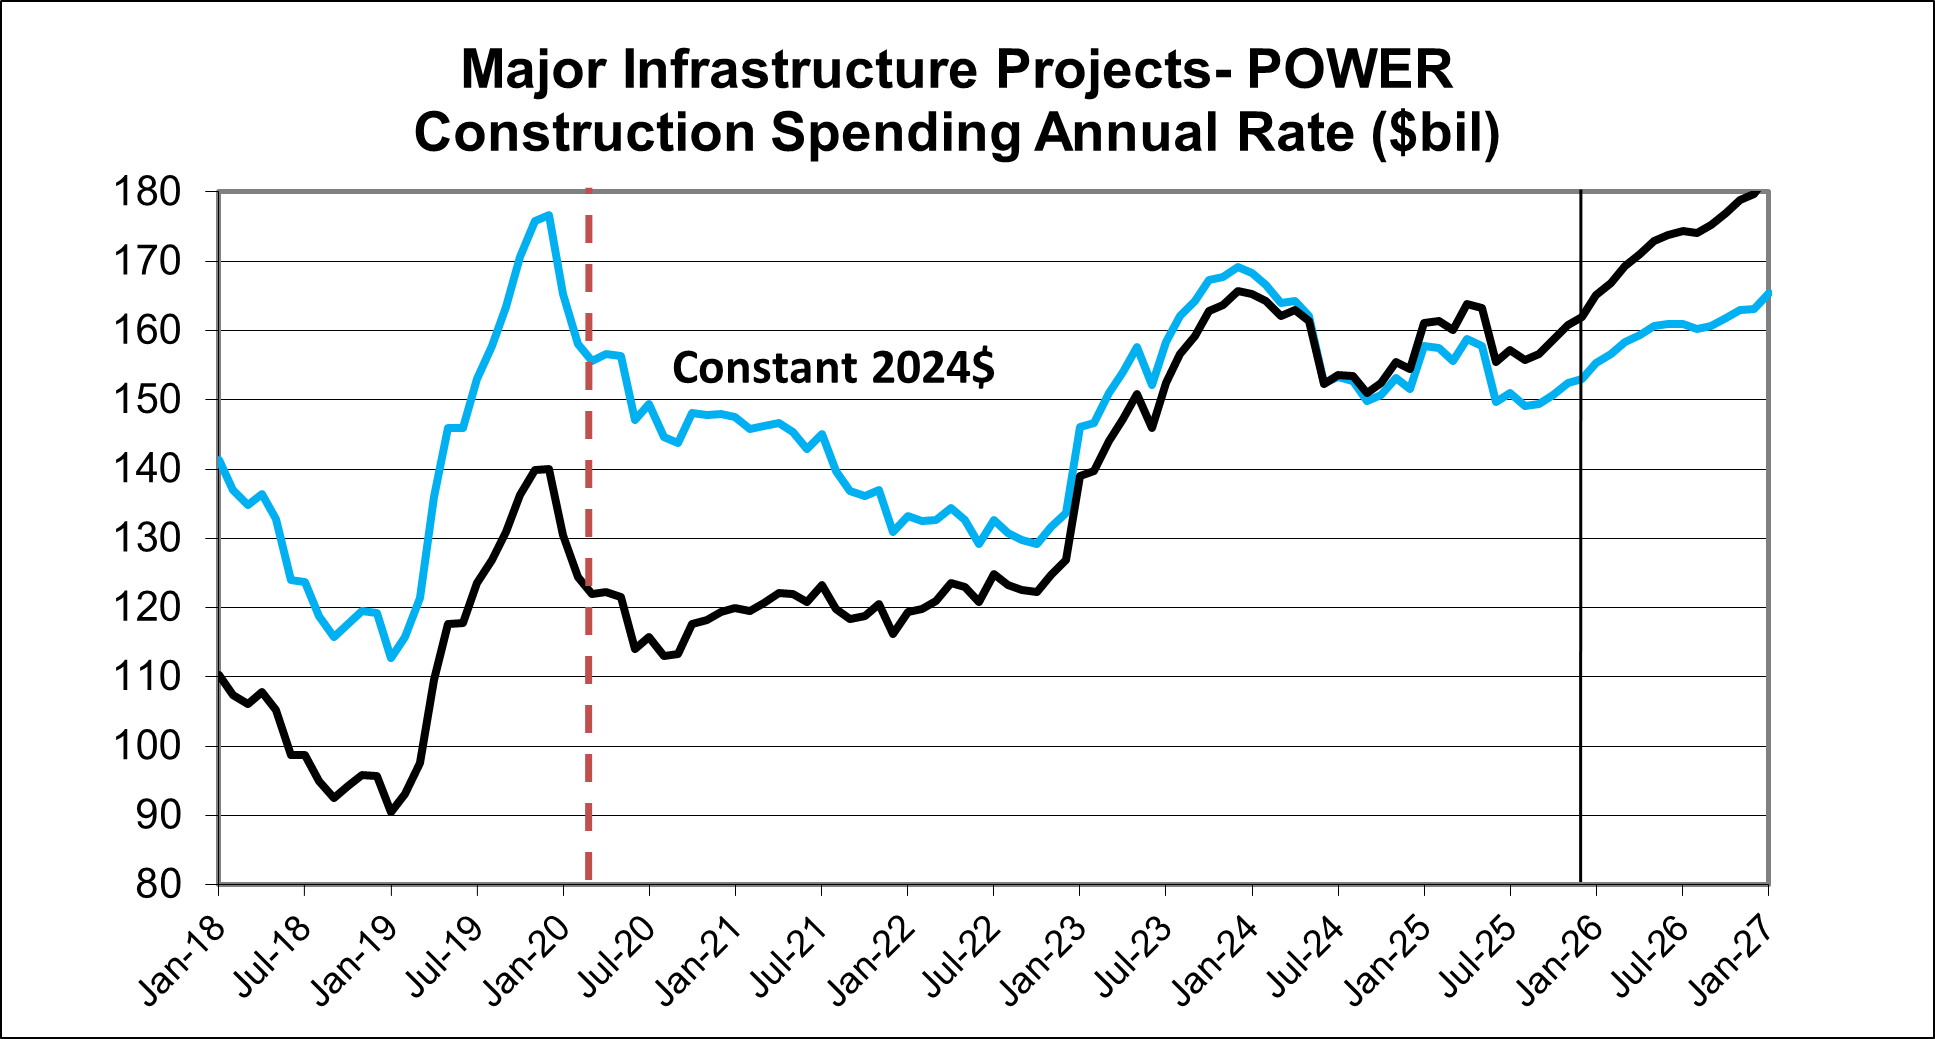
Power is difficult to forecast. Although I have spending increasing 8% in 2026, gains may be somewhat dependant on power supplies to new data centers. If data centers fail to advance as rapidly as expected, power spending may slow as well.