The American Institute of Architects Architectural Billings Index
The Dodge Momentum Index
The Associated Builders and Contractors Construction Backlog Indicator
These three construction leading indicators are often referenced. Do you reference any of these indices? Do you know what the index represents?
The American Institute of Architects Architectural Billings Index, ABI, is a diffusion index, measuring work on architectural firms’ drawing boards, measured as above 50 if increasing and below 50 if decreasing. The index is comprised of survey responses from firms representing 45% institutional work, 40% commercial work and 15% residential work. The index is said to lead commercial construction spending by 11 months and institutional construction spending by 7 months. BUT, the correlation is this, the ABI is compared to “the percent change in year over year construction spending”.
https://content.aia.org/sites/default/files/2016-04/Designing-Construction-Future_3-14.pdf
Year over year percent change can provide skewed results. If last year construction spending was on a slow decline every month, and this year spending is level from month to month, that would show up as a continually increasing year over year percent growth. Because year over year spending percent is increasing, it could be misinterpreted that current year spending is growing, but it is flat. In another example, if last year construction spending was slowly increasing every month, and this year spending is slowly increasing every month at the same rate of growth, that would show up as no growth in year over year spending, but actual month to month spending is slowly increasing. Year over year spending can be influenced by last year activity as much as current activity and may not show the current trajectory in spending.
The Dodge Momentum Index, DMI, measures the earliest known indication of projects in planning. This includes only projects that are actually in design. The index is comprised of gathered results for nonresidential projects, excluding megaprojects and excluding manufacturing. The index is said to lead nonresidential construction spending by 12 months. However, it’s individual components could lead Institutional spending by 15 months and Commercial spending by 7 months. We see that the ABI refers to the point in time when the project is already under design and that leads spending by 7 to 11 months. It would be expected that the Dodge index has a longer lead time. As an indicator of early planning Dodge excludes projects that are about to go out to bid, preserving the intent of a leading indicator.
https://www.construction.com/download/Dodge_Momentum_Index_WhitePaper.pdf
The Associated Builders and Contractors Construction Backlog Indicator, CBI, attempts to measure the work in backlog, or growth in the value of work on contractor’s books. It measures the current month of total remaining value of projects in backlog (nonresidential only) divided by the previous fiscal 12 months total revenues, times 12. The resulting output purports to measure months of remaining backlog or remaining revenues. Of course, projects have varied schedules to completion that may take many more months if not years to complete, so contractors may not run out of work in the few months indicated by the CBI. Therefore, this index does not measure months to backlog extinction, it simply sets the result to base 12. It could just as well be times 100 and set to base 100. This index also may be influenced by something that occurred a year ago that may not reflect the current activity. What this index really measures is the current backlog as a percentage of previous fiscal year revenues, just skip the part that multiplies that percent times 12. It provides no indication of expected annual revenues. The ABC CBI has always produced a result around 8 to 9 months, that would indicate backlog is about 65% to 75% of previous year revenues.
Construction Analytics collected starts and spending data back to 2005, which is sufficient in turn to provide an analysis of backlog since 2010. With exception of residential, which has short durations and for which backlog is always only about 30%-35% of previous year revenues, for all other work, never was backlog shown to be less than the previous year spending.
https://abc.org/Portals/1/CEU/ABC%20CBI%20and%20CCI%20Methodology.pdf
Construction Starts – A Leading Indicator to Spending
Construction starts, although a general indicator that construction spending may be poised to grow (or fall), can also be misinterpreted. Construction starts refers to a total project value at a point in time, the contract award or the start date. For nonresidential construction, all projects that started prior to the beginning of a year will account for at least 80% of all spending within that upcoming year. Construction spending is that total project value spread out over the project scheduled duration from start to finish. Building construction spending peaks at 50% to 60% into the schedule.
Construction starts may be increasing, but rather than resulting in increased monthly spending, those starts may represent longer duration contracts. Increases in new starts does not always indicate an increase of monthly spending, but may instead represent lower monthly spending for a longer duration into the future.
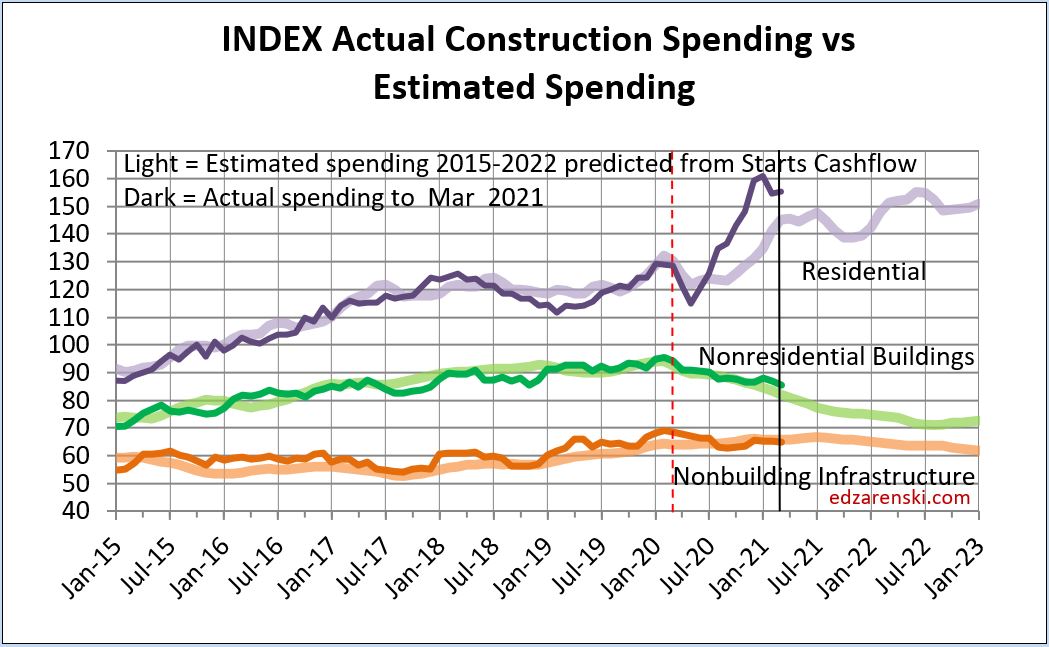
All of these indices do not correlate directly to construction spending. To forecast construction spending, a cash flow schedule of all construction starts must be prepared. In any given month, spending on construction includes some monthly portion of spending from all projects that started in all previous months but that have not yet reached completion. A cash flow schedule of all monthly construction starts is the best indicator that directly forecasts construction spending.
Construction Analytics prepares estimated cash flow schedules from monthly reports of new construction starts and exclusively uses cash flow to forecast future construction spending. The cash flow schedule also allows to directly calculate the estimate to complete backlog in current $.
Know what an index represents before you put all your faith in following that index to develop your forecast.