10-12-23 Updated PPI INPUTS added PPI plots
8-11-23 Updated PPI Inputs and Final Demand tables
8-12-23 Added Table that shows Spending, Inflation, Index, Constant$
When Census released May construction spending data on July 3 they also revised spending for all markets for the last 2 years. Largest revisions are usually in previous year. This changes % growth and baseline for the start of 2023.
Census added $50 bil to 2022, $27 bil to 2021 and $6 bil to Jan-Apr 2023. Largest revs 2022, Rsdn +$17bil, Mnfg +$7bil, Comm/Rtl +$6bil, HiWay +$4bil. Largest revs 1st 4 mo (JFMA) 2023, Rsdn +$6bil, Mnfg +$2bil. 2023 Forecast$ went up, but % increase went down, because 2022 $ revs went up by more.
My midyear forecast here would be compared to the AIA Consensus Midyear July 2023 Forecast.
AIA Consensus Midyear July 2023 Forecast.
A significant difference here is that the AIA forecasts are all compared to 2022$ before the Census revisions published 7-3-23, which are included in my forecast. That would mean that all AIA Forecast, in all markets, would be lower since Census revisions were up in every market.
Be careful out there. Here are other significant watchouts to be aware of in available midyear forecasts:
One forecast is based on a recession.
No other forecast (as of mid-July) besides Construction Analytics (this forecast) includes the Census 2021-22 updates to spending put-in-place of $27bil in ’21 + $50bil in ’22.
One forecast has public works adding 2% to 4%/yr spending the next few yrs, while new starts are up 50%.
There is a remarkable 50% spread ($52bil) on the forecast growth in manufacturing spending in 2023.
There is a 15% ($270bil) spread in forecasts for total$ in 2024.
There is a 16% ($100bil) spread just in nonres bldgs forecast for 2023.
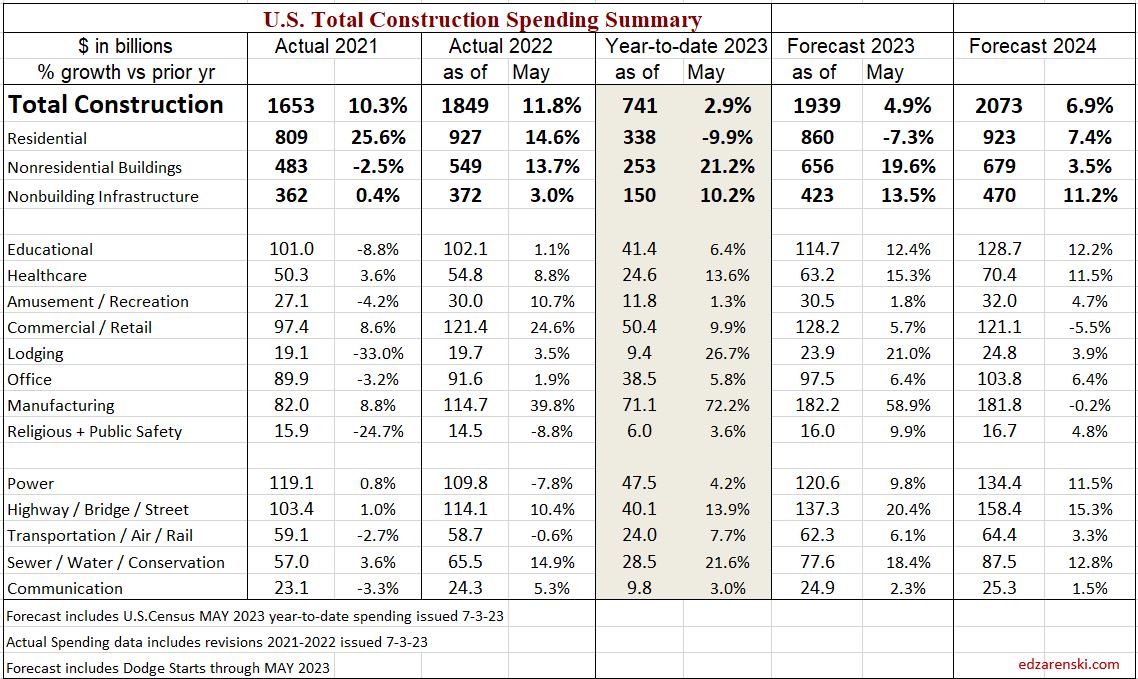
Residential Construction Spending Since Nov, Rsdn spending has seesawed up/down in a range from $840bil to $880bil. Currently at the high for the year. Will move slightly higher, but falls from peak in Q3. 2023 is currently down ytd 10%, will finish the year down 7%.
The big story is manufacturing construction spending. The average monthly expenditure on MNFG constr spending for the 4 years 2017-2020 averaged an annual rate of $78 billion, ending Dec’20 at $73bil. In 2021, spending was flat at $73bil. But by Dec’22, spending increased to $100bil. In the 1st 5mo of 2023, MNFG construction spending increased to an annual rate of $150bil.
8-12-23 Added this table, 2015-2025 Spending Inflation, Index, Constant 2019$
The path to constant volume starts with current spending. This table shows the progression of how we get there. Constant volume growth is what we compare to, for business volume or jobs growth.

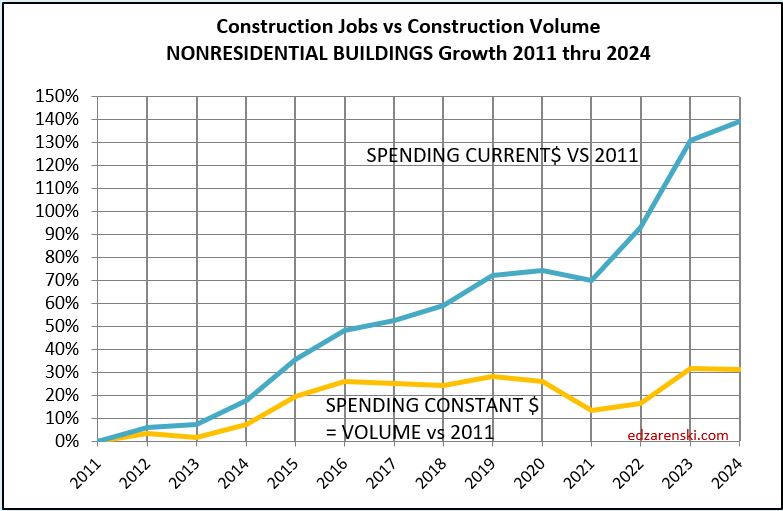
Construction JOBS continue to creep higher. From Apr’22 to Oct’22 jobs increased 1.5% but volume of work dropped 10%. Jobs and volume should track together as seen from 2011 to 2018. Since Oct’22, jobs up only 2% while volume up 7%. Volume catching up.


Construction spending, particularly nonresidential buildings, stalls for the 2nd half of 2023. Spending is up/dn thru year end, ending the year about where it is now. But by year-end, after taking out inflation, volume will be down 2%. In last 3 yrs, jobs seldom drop along with volume. I think jobs will not track volume down 2%, but finish 2023 about where they are now.
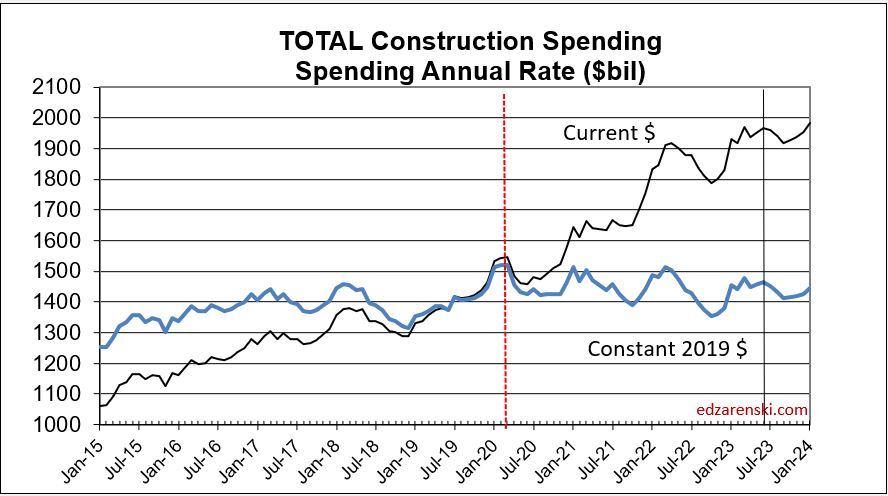
Construction Spending since Feb 2020 has increased (monthly SAAR Current $) $425bil, up 28%. But inflation increased $480bil (32%). Actual volume of work has decreased 3.5% or $55bil (monthly SAAR Constant 2019 $) since Feb 2020. The big decline in constant $ in 2020 and in 2021 is nonresidential buildings. The big decline in 2022 is residential.
PPI Data for June
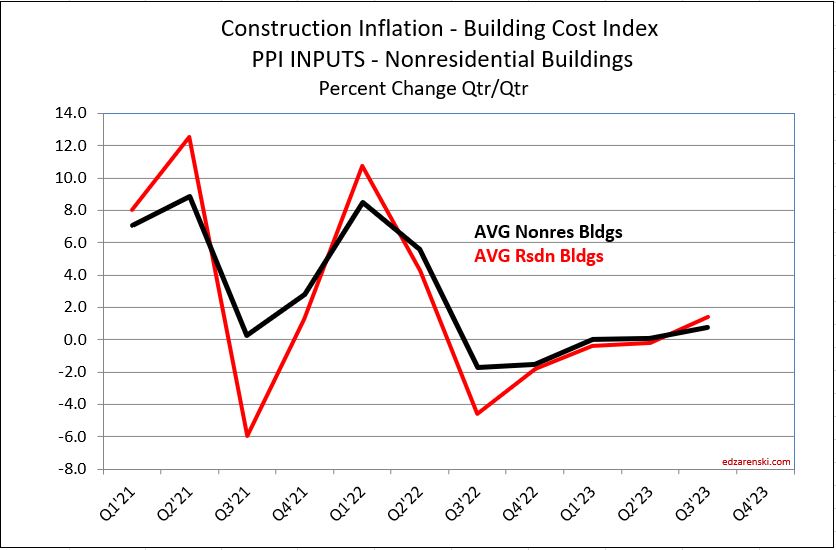
PPI Mtrl Inputs to Construction are up less than 0.1% in June, up less than 2% ytd. Cost of Inputs was up 30% over the last 2yrs. Year-to-date 2023 vs average 2022 Nonres Bldgs down 0.5%, Rsdn down 3.2%, Concrete products UP 10%-13%, Lumber/Plywood down 22%, Steel Products down 12%-15%, Diesel Fuel down 30%.
PPI Final Demand Construction for June, most Bldgs and Contractor costs peaked in March. 2nd qtr costs are not yet complete until July data gets released in mid-August. (The PPI Final costs is a three-month series that is corrected in data released for Jan, Apr, Jul and Oct.) Most costs are down 1% since Jan. Current avg all Bldgs and Trades cost are up 9% from avg 2022, but costs are headed down.
PPI INPUT TABLES UPDATED 10-13-23
The last column, YTD vs 2022avg, gives an indication of 2023 avg if current YTD costs remain constant for the remainder of the year. However, Inputs to Nonres Bldgs has been down 3 of last 4 qtrs. Res has been down 4 of last 5 qtrs. So it’s likely we will see some more downward pressure in the indices.

PPI FINAL DEMAND TABLE UPDATED 8-11-23
The PPI Final Demand index is a three-month series that is corrected in data released for Jan, Apr, Jul and Oct. Most Bldgs and Contractor costs peaked in March. With this PPI Final Demand Construction for July, 2nd qtr costs are now complete (with the July correction for MJJ). Most costs are down at least 1% since Jan. Current avg all Bldgs and Trades cost is up 8% from avg 2022, but costs are headed lower.
The Final Demand index posted declines for the two most recent adjustment months, Apr and Jul. If distributed back to the months being corrected, Apr into Feb and Mar, Jul into May and Jun, it shows all bldgs, except Office, have at least 6 months of declining cost. Office has been declining for only 3 months but Warehouse has been declining for 8 months. Buildings are down 1% to 3% so far this year.
The Avg Nonres Bldgs is down 1.4% in the last two quarters. And yet, if we hold the current index constant, keep it at today’s rate for the rest of the year, then the avg for 2023 will be up 7.8% from the avg 2022. I think, based on downward trend in costs, it will be lower than that at year end.


Thanks Ed. Appreciate the July Mid-Year updates. I did not find the Construction Analytics Index table 2015 – 2024 included with the update? Will that slide be updated soon? Thank you!
LikeLike
See https://edzarenski.com/2022/12/20/construction-inflation-2023/
LikeLike
I have no data, but recent discussions (twitter) I’ve read indicate timeframes for ordering some equipment sometimes out 52 weeks.
LikeLike
Hey Ed,
Thank you for the hard work. We built quite a bit of backlog over the past year, but we are having a problem with any of it starting because of equipment backorders. It’s very frustrating. Do you have any data to suggest that this trend will soften any time soon?
LikeLike