Updates to Forecast, spending, starts, inflation, jobs will follow next few days, so revisit this post for Apr data updates.
SEE ALSO Construction Analytics Outlook 2024
Today, 6-10-24, this blog recorded the 1,000,000 view. That doesn’t count scrolling from the home page, where a visitor might scroll down to read 3 or 4 articles, and there are 500 landings on the home page every week. So, the counter hit 1,000,000 but including scrolling, the actual total views could be higher. Nearly 500,000 people read on average 2.1 articles every visit. Inflation articles draw the most attention, with a read rate of about 1000 times a week on a slow week and 2,000 on a busy week.
Thank you to all my visitors, and to the 1,000,000th viewer. Keep reading! edz
April construction data update
Total construction spending for 2024 is forecast up 9%, down slightly since last update. Residential was reduced, expect now only +4%. Nothing else changed much. Nonres Bldgs forecast up 11%. Nonbuilding up 15%.
Jobs growth from May’23 thru May’24: Total Jobs +3.2%; Nonres Bldgs + 4.7%; Nonbldg Infra +3.6%; Residential +2.9%. In all cases most of the growth was in 2023.
Residential construction spending cash flows indicate a drop of 4% over the next 6 months, but then a slow steady climb of +10% in the following 12 months.
Nonresidential Buildings construction spending cash flows indicate we have settled in a temp flat top for the next 6 months, down 2% from the Feb’24 peak. Then we get a 5% annual rate of increase for the next two years.
Non-building Infrastructure cash flows are not showing any monthly pullback for the next two years. Spending adds 8% from now until year end and then adds 10% in 2025.

Baseline Spending Adjusted to Constant 2019$

Since the end of 2019, (in Dec 2019 spending hit $1,464T) total construction spending as of APR’24 is up 46%. The real Volume of Business is spending minus inflation. Inflation adds nothing to the volume of business. After inflation, Volume is up only 6%. Total jobs are up 9%.
Since the end of 2019, Residential volume is up 7%. Rsdn jobs are up 15%. Nonres Bldgs Volume is up 12%. Nonres Bldgs jobs are up 5%. Nonbuilding volume is down 8%. Nonbldg jobs are up 5%.
A follower commented to me they thought total adjusted spending would be higher. At the time, we were referencing Constant2019$. When we set base year to 2024, all other years would be compared in Constant2024$. All years would appear higher, but the percent change yr/yr would be the same. Here’s the same data as the table above, except the Index year has been changed to Constant 2024$.
Baseline Spending Adjusted to Constant 2024$

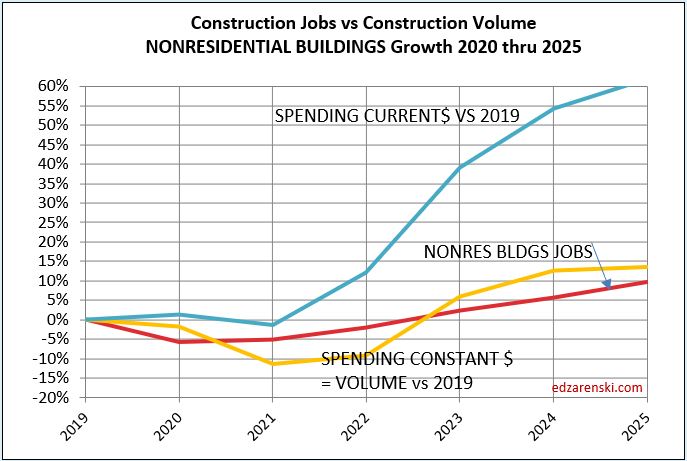
Nonresidential Bldgs volume (spending after adjusting for inflation), increased 28% in the last 18 months. Nonres Bldgs jobs increased only 7%, and hours worked (OT) did not increase. That leaves 21% of Nonres Bldgs volume that was put-in-place without a balancing increase in jobs. The added work got absorbed into the existing workforce. That’s a very hard fact left unexplained by the argument that there are jobs shortages. As one reader commented, there are some reasons why more $ value of work is counted at the jobsite with less jobs, i.e., prefab, but not 21% of all Nonres Bldgs work.
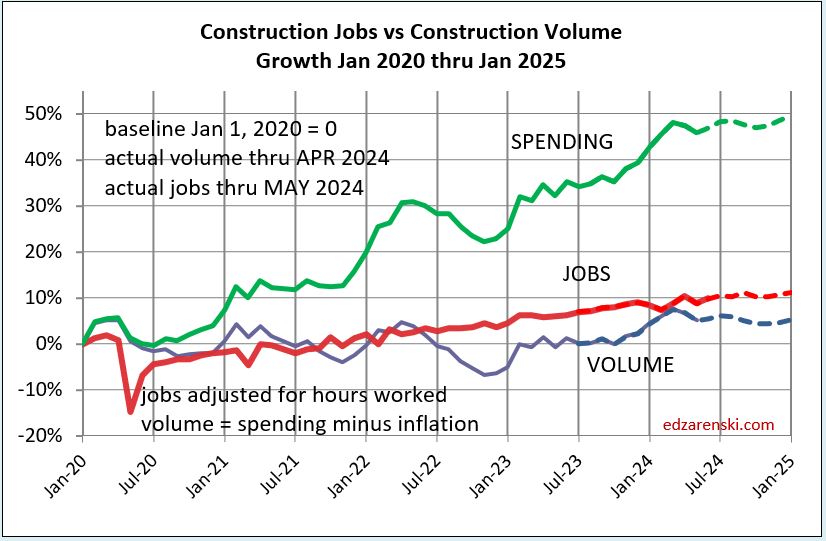
This plot below removes spending, shows a better scale comparison of Jobs to Volume.

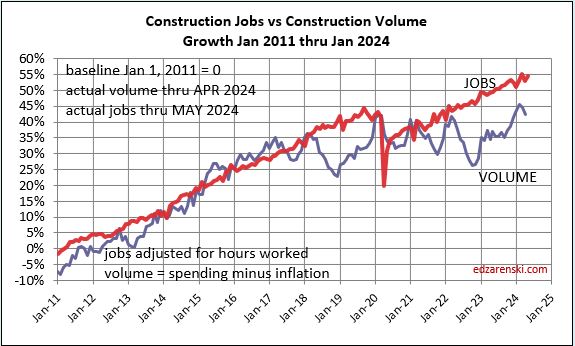
The above plot is taken from this 2011-2025 plot below. Looking back to 2011 shows how consistent jobs and volume growth was from 2011 thru 2019. This plot shows Construction Jobs growth since mid-2020 occurring at the same slope (rate of growth) as 2011-2019. Construction jobs grow avg 3.5%/year, even if volume growth varies. The Pandemic set jobs growth back by almost 2 years.
The next three plots Jobs vs Volume Growth, are set to zero start at Dec 2019. Last month, MAR data, I showed these same plots going back to start Jan 2011. Here’s a link to Mar data for those 2011 plots.

I’ve recently read comments on Twitter X that a slowdown in new residential starts is causing a drop in residential employment, and that leads a recession. Well, residential jobs are up 1% year-to-date, up 2.5% from May’23 to May’24, and right in line with average jobs growth since 2011. There is a slowdown in the rate of growth of constant $ volume. Although May starts are the lowest since November, that slowdown from May to December is only 3.5%. This may not be a big enough drop in volume to initiate a drop in jobs. We’ve seen other years (2018) where a small volume drop is not followed by a drop in jobs and never does the drop in jobs equal the magnitude of the drop in volume.


Look at the Total all jobs plot I added from 2011 to 2025. Also see the link to the sector plots back to 2011. Differences in jobs vs volume growth occur sometimes simply because of volume changes. Nonres Bldgs productivity didn’t increase 21% in a year, although the data will show that. It had been artificially lowered by the jobs that existed that absorbed all that work.
LikeLike
Ed , interesting point about the increase in nonres bldgs and only a 7% increase in jobs. Are you only seeing efficiency gains like this within the nonres segment?
LikeLike