Here’s a look at the residential construction industry. Except for the first mention of Current $, All $ in this analysis are inflation adjusted Constant 2019$, so all years can be compared on equal terms. All numbers are rounded slightly.
Currently in 2024 $, residential construction spending is $940 billion/year, 43% of all construction. Only 60% of that ($560 billion) is spending on new housing units. The other 40% is Reno.
Currently for 2024, residential construction supports 3,350,000 jobs. Only 60% of the jobs (2,000,000) are for new units.
30 years ago residential construction spending was $550 billion/year and there were 2,200,000 jobs. On average over 30 years (including all up or down years) we’ve added $14 billion/year in spending and 38,000 jobs per year.
The 30 year (1995-2024) average growth in residential spending, counting only 21 up years, (eliminating all 9 down years) is +$36 billion/year. There were 2 years that we added +$70 billion/year in spending (one of those in 2021) and including those, there were only 7 years over +$50 billion/year.
The 30 year (1995-2024) average growth in residential jobs, counting only 21 up years, (eliminating down years) is +125,000 jobs/year. In 1999, we added 270,000 residential jobs. Since 2011, the most we’ve added in a year is 170,000 jobs in 2021. That’s for ALL residential construction.
In 30 years, we’ve never added more than $70 billion/year in residential construction spending nor more than 270,000 residential jobs in a year. Since 2011, the most residential spending increased was $70 billion in a year and the most residential jobs increased was 170,000 jobs in a year, both in 2021.
Only 60% of all residential spending and jobs is associated with building new housing units. The other 40% is renovations, not associated with new construction. That must be considered when reviewing all the historical data noted above. So the following is just to look at the data without renovation.
Reduce the data by 40% to eliminate spending and jobs associated with renovation and look at just the data associated with building new housing units: In 30 years, we’ve never added more than $40 billion/year (2004,2021) in residential construction spending on new units nor more than 160,000 residential jobs in a year (1999,2005). This is for New Units construction only.
Since 2011, the most spending increased for new units was $40 billion in a year (in Constant 2019$) and the most jobs increased was 100,000 residential jobs, both in 2021.
The last time residential jobs for new units increased by 100,000 or more in a year was 2005. Best growth ever was 2004-2005-2006, when we averaged +120,000 jobs/yr for 3 years, just for new units. In fact, the only times residential jobs for new units increased by more than 100,000 were 1999, 2004, 2005 and then finally again in 2021. But 2004-2006 was a time when the construction unemployment rate averaged 7.5%-8.5%. In 2021, construction unemployment averaged 6%. Now the unemployment rate is averaging 4.5%.
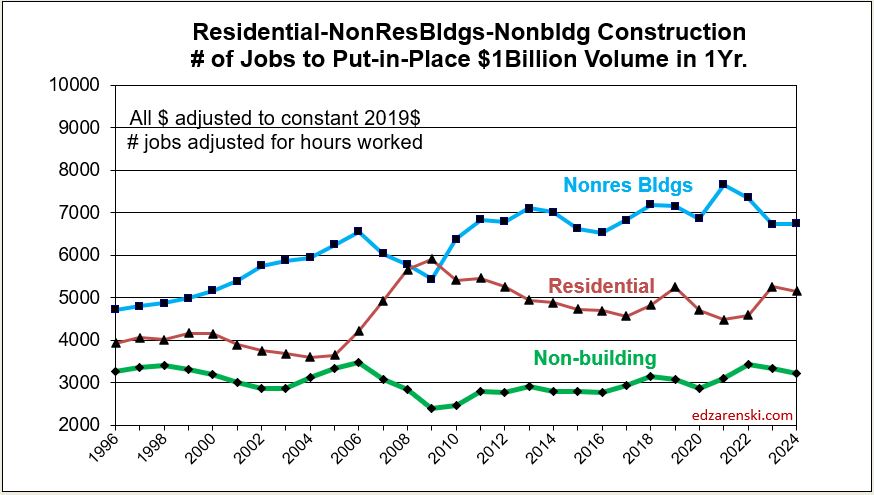
(It would be wise to use post-2011 data for the jobs analysis. The construction industry, especially residential and nonres bldgs, experienced a labor base reset in the period 2006-2010, a period from which we have never fully recovered. Notice in this plot that residential was nearly level at 4000 for 10 years, then from 2005-2009, it shot up to over 5000. It’s remained near 5000 since 2010.).
If we were to match the maximum growth rates since 2011 (and in the case of spending, since 1994) we would increase new residential units construction spending by $40bil/$390bil = 10% and we would increase new residential jobs by 100,000/2,000,000 = 5%. Spending maxed at 10%, but jobs max growth at 5%.
The number of new housing units built in a year varies, but for this post I’ll use 1,500,000. Currently it’s a bit less than that. Increasing new units by 5% to 10% per year on a base of 1.5 million units/year would net a growth between 75,000 to 150,000 added units per year. Let’s use 100,000 new units in the first year. That would be 6.7% growth, already more than the 5% jobs. We would continue the growth, so we increase that by another 100,000 in the 2nd year, and again in the 3rd and 4th years. Leave no doubt, growth of 100,000 units/yr would mean adding jobs to match or exceed the best single-year growth rate in the residential new units construction industry since 2005, and keep matching that growth rate for four consecutive years.
CORRECTION: 8-21-24 The Corrections (now fixed) above raise the upper limit of potential growth based on spending from 7% to 10%, or 150,000 units/yr, but only if we take the result to be dependant on the upper limit % spending growth. I had divided by current $ when I should divide by constant $. Spending can vary a lot more than jobs. While some years of jobs growth reach 6%-7%, average residential jobs growth is just over 4%. Jobs never grow at 10%/year.
This plot shows the steady growth in residential jobs, 75% over 15 years. Compounded that’s about 4%/yr. So, it seems much more likely the limiting factor here is jobs, not spending.

In this analysis, the number of units was chosen at 100,000/yr., an increase of 6.7%/yr., well below potential spending growth but already more than jobs growth. The jobs increase in 2021 was 5%/yr. In 2004-2005, jobs growth was 8%/yr. So, this 6.7% is near the high end of potential jobs growth. This implies an add of 130,000 jobs.
So we would increase new units by 100,000 + 200,000 + 300,000 + 400,000 or 1,000,000 total new affordable residential units over the next 4 years.
By this rough analysis, to increase new residential units by 3 million over current production over the next 4 years would require that we increase residential construction and jobs by 3x greater than the best performance achieved in the construction industry in the last 30 years, and keep it up for the next 4 consecutive years. That’s more jobs than the entire construction industry gains in one year and the new units subset of construction is only 25% of all construction.
Although there has been times past when jobs increased by 120,000/year, that was a time when unemployment was much higher and there were more workers available to readily go back into the workforce. It’s not impossible that jobs can grow faster, and therefore also the number of new units, but it is unlikely.
If a substantial portion of the current 1,500,000 unit production (500,000 units a year for the next 4 years) were shifted over to affordable units, the picture changes considerably. But I wouldn’t expect that current demand to just go away and shift to lower cost units. So, this leaves current demand as is and adds jobs.
A Proposal: If some amount of the funds to be invested in this program is directed towards trades training programs, within two years, and every year after, we could potentially be turning out some of the extra 260,000 additional workers we would need every year to achieve 3 million new housing units. This approach would create both good jobs and new affordable homes. Incentivize the training program somehow. Paid internship. Perhaps with a guarantee in return to work for 2-3yrs. If we don’t invest in training workers for this effort, we cannot build more than the labor we have. Here’s a thread on my training proposal. https://x.com/EdZarenski/status/1828778915055468816

Great tips on saving money with roof repairs! Proper maintenance truly makes a difference. Thanks for sharing!
LikeLike
An insightful and thought-provoking post! The challenge of adding 3 million residential units in 4 years is definitely a bold goal. Great analysis!
LikeLike
Ed, it is my opinion that your article completely ignores the elephant in the room. I like the statistics, but I do not believe you could draw the conclusions you have drawn with those statistics. Simply put, it is impossible to discuss dollars and sense in the construction Industry i.e. cost of housing units or total dollar spent building or renovating housing units, when Material cost fluctuation in the construction industry is staggering, and does not follow the normal inflationary patterns. Therefore, adjusting yesterday’s money to today’s money does not work in construction. Worse, yet, housing unit cost fluctuates out of sequence with inflation because of other factors.
I believe, the best way to examine the issue is with a ratio of the number of units built per year/per decade per population. When you look at housing units per the entire population of America, you can see that every year we fall behind in creating housing units. When we divide housing units into categories; single-family houses, two family houses, multi-unit structures and apartment buildings, we can really see where the deficiency lies. America needs rental units. We often joke about our kids remaining at home long into their adulthood. This is not a joke. This is what’s happening. The transition housing is missing. The child at home, moving into an apartment, getting married, having children requires mommy and daddy’s house, an apartment, and a single-family home. When we are missing the apartments, it keeps the children home longer, and drives up the cost of the single-family house. I have been building and renovating multi family dwellings for 50 years. I am an architect that teaches construction management in one of the largest architectural schools in the country. I have watched this problem steadily grow since the 1970s. Public policy restricts the building of apartments. Public policy restricts the management of apartments. Public policy has substantially increased the cost of apartment(s). Public policy has denied the investor a reasonable return on the risk of building an apartment building. Americans, Real Estate Investors, Builders, Insurers, bricklayer’s and carpenters do not need government subsidization. They do not need a bill to pass through Congress. They need to remove all of the restrictive public policies put in place by politicians, who offered cheaper rent for everyone who votes for them.
LikeLike
Thanks for your comments. I encourage anyone with knowledge of all the factors in their chosen discipline to put together an analysis. They may be much more similar in results than one might at first think.
Let me address just one segment of your discussion. Inflation. Construction inflation is much different than consumer inflation. Consumer inflation has no relevance to construction and should not be used to adjust construction costs. Readers of this blog are acutely aware that construction inflation is tracked here on this blog from as many as 30 sources. Not only that, but although separate construction labor and construction material inflation is part of the analysis, heavy favor is given to sources that track whole building final cost, which includes contractors Ovhd&Profit. Only construction inflation is used here to adjust costs related to construction.
LikeLike
What this article doesn’t consider is the Supply Chain required to increase expanded housing starts. At current industry capacities it will fail at a level somewhere between 1.65 and 1.8 million starts limiting growth regardless of what the jobs added are.
LikeLike
Well-written and very informative! It’s refreshing to see a blog that simplifies a complex topic. Keep teaching us!
LikeLike
Hi Ed,
A recent Realtor.com article stated that the US is 1.5M units short of a balanced market. Not sure if this means the US needs 1.5M per year going forward, but if so, does that mean the market needs 6M units over the next 4 years?
Thanks for all you do!
Richard Cavnar
LikeLike
Yes. 3 million of which need to be affordable units. Neither goal can be reached through the current construction workforce.
LikeLiked by 1 person
Hi Ed,
A recent Realtor.com article stated that the US is 1.5M units below a balanced market
LikeLike
Hi Ed,
Curious about what your source is for the number of employees in both residential and non-residential building construction. Also, the employee split between new units and work on existing units.
Your numbers are significantly different than those published in FRED.
Thanks and best regards,
Dale Stroud
LikeLike
My jobs numbers come directly from BLS Table B1a
Residential Jobs July 930.9 + 2419.6 = 3,350,000
A common error users make is to access FRED and query only Residential Building Construction. That represents only about 25% of residential construction jobs. A little further down the tables is Residential Specialty Trades Contractors, where most residential jobs are posted. Any contractor that provides only ONE type of service is a specialty trade: foundations, framers, roofers, drywall, painters, electricians, plumbers, HVAC, landscapers, pavers, etc.
Jobs for renovations vs new are not reported by BLS, so I simply use the same percentage as spending.
https://www.bls.gov/web/empsit/ceseeb1a.htm
LikeLike