11-13-25 See new post Construction Inflation 2025 Update Nov. for all new index tables and plots update dates vary from July, Aug to Q3.
10-17-25 Residential Index reduced and minor reduction in Nonres Bldgs Index, see notes in Construction Analytics Building Cost Indices and Reference Indices. The tables and plots included data only thru July.
9-3-25 Updated PPI tables and plots to JULY data issued 8-15-25.
5-15-25 all ppi DATA UPDATED TO APR
2-21-25 All new data updated to Q4. A major change with this new data / plots, is the change in the base date from 2019 to 2024. These index tables / data cannot be mixed with prior issues. Now using base 2024 = 100 in all data / plots included here. Percents yr/yr or mo/mo don’t change, the indexes change.
To properly adjust the cost of construction over time you must use an Actual Final Cost Inflation Index, otherwise called a selling price index. General construction cost indices and Input price indices that don’t track whole building final cost do not capture the full cost of escalation in construction projects.
Spending Must Be Adjusted by Inflation
Usually, construction budgets are prepared from known “current” costs. If a budget is being developed for a project whose midpoint of construction costs is two years in the future, you must carry in your budget an appropriate inflation factor to represent the expected cost of the building at that time. Why the midpoint? Because half the project cost occurs prior to that point and half occurs later than that. Actually, the midpoint of spending is 50-60% into the schedule, but the calculation to the midpoint of schedule is close. So, the average inflation for the project includes early contracts that have less inflation than average and also later contracts that would have more than the average inflation. Construction inflation should always be calculated from current cost to midpoint of construction, or in the case of using historical data and converting an older actual cost to a future budget, from midpoint to midpoint.
Any time a construction project is delayed or put on hold to start at some future date, construction cost inflation must be calculated and added to the previous budget to account for the unanticipated cost increase due to the delay. Of utmost importance is using appropriate cost indices and forecasting future cost growth to account for the difference in original budget and revised budget.
Besides the estimator’s need to accurately reflect future expected cost, inflation is an important aspect of the company business plan. Typically discussed in tandem with spending, inflation has an impact on tracking and forecasting company growth. All spending includes inflation, but inflation adds nothing except $ signs to the overall growth. For example, in a year when company revenues (spending) increase by 10%, if inflation is 6%, then total business growth is only 4%. To accurately calculate growth, and the need for labor to support that growth, spending must be adjusted by the amount of inflation.
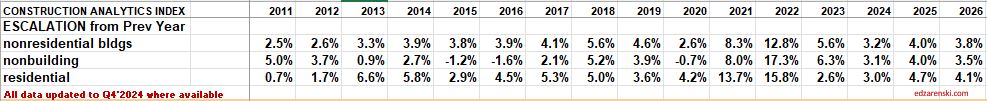
Since 2011, Nonres Bldgs inflation is 4.8%, Residential is 5.4% and Non-bldg is 3.9%. But those averages include the unusually high inflation years of 2021 and 2022. Without those two years, since 2011, average inflation for Nonres Bldgs is 3.8%, Residential is 3.8% and Non-bldg is 2.4%.
2025 Inflation Forecast, Nonres Bldgs +4.0%, Residential +4.7% and Non-bldg +4.0%.
5-15-25 2025 Inflation Forecast, Nonres Bldgs +4.4%, Residential +5.0% and Non-bldg +4.3%.
Types of Construction Inflation Indices
General construction cost indices and Input price indices that don’t track whole building final cost do not capture the full cost of inflation on construction projects.
Consumer Price Index (CPI), tracks changes in the prices paid by consumers for a representative basket of goods and services, including food, transportation, medical care, apparel, recreation, housing. The CPI index in not related at all to construction and should not be used to adjust construction pricing.
Producer Price Index (PPI) for Construction Inputs is an example of a commonly referenced construction cost index that does not represent whole building costs. The PPI tracks material cost inputs at the producer level, not prices or bids at the as-built level.
Engineering News Record Building Cost Index (ENRBCI) and RSMeans Cost Index are examples of commonly used indices that DO NOT represent whole building costs yet are widely referenced by construction firms and estimators everywhere to adjust project costs. Neither includes contractor margins.
It should be noted, there are far fewer available resources for residential inflation than for nonresidential inflation.
One of the best predictors of construction inflation is the level of activity in an area. When the activity level is low, contractors are all competing for a smaller amount of work and therefore they may reduce bids. When activity is high, there is a greater opportunity to bid on more work and bids can be higher. The level of activity has a direct impact on inflation.
To properly adjust the total cost of construction over time you must use actual final cost indices, otherwise known as selling price indices.
Selling Price is whole building actual final cost. Selling price indices track the final cost of construction, which includes, in addition to costs of labor and materials and sales/use taxes, general contractor and sub-contractor margins or overhead and profit.
Construction Analytics Building Cost Index, Turner Building Cost Index, Rider Levett Bucknall Cost Index and Mortenson Cost Index are all examples of whole building cost indices that measure final selling price (for nonresidential buildings only).
Residential inflation indices are primarily single-family homes but would also be relevant for low-rise two to three story building types. Hi-rise residential work is more closely related to nonresidential building cost indices.
Producer Price Index (PPI) Final Demand Indices are an example of construction cost indices that represent whole building costs. Final Demand PPI, or Selling Price, represents contractors bid price to client. Includes labor, material, equipment, overhead and profit. Labor includes change in wages and productivity.
PPI Final Demand Indices should not be referenced monthly. These are quarterly indices. Every three months (Jan, Apr, Jul, Oct) BLS performs an update survey to correct the PPI Final Demand indices. For more than two years, in most quarters, about 80% to 90% of the change in the index for the quarter was posted in the update month. In some quarters, growth is flipped from negative to positive. And still in other quarters the correction month doubles or halves the rate of growth. There is no way to determine how much occurred in the update month or a previous month, but the update # along with the two previous months will get too the correct end-of-qtr index.
January is an update month. PPI Final Demand for Jan index basically includes the correction for Nov and Dec. Therefore, the index should NOT be compared mo/mo. There is only one of three months that the index is known for certain to be accurate, the update month. Compare qtr/qtr, but make sure to use the defined months, the correct update month with two previous months. For ex., (Jan+Dec+Nov) / (Oct+Sep+Aug). Those are the defined quarters. (I don’t make the rules).
Refer to National Inflation Indices for comparison to several national selling price indices or various Input indices. National reference indices are useful for comparison. Few firms project index values out past the current year, therefore all future projections in these tables are by Construction Analytics.
Construction Inflation History
Post Great Recession, 2011-2020, average inflation rates:
Nonresidential buildings inflation 10-year average (2011-2020) is 3.7%. In 2020 it dropped to 2.5%, but for the six years 2014-2019 it averaged 4.4%. In 2021 it jumped to 8%, the highest since 2006-2007. In 2022 it hit 12.8%, the highest since 1980-81.
Residential 8-year average inflation for 2013-2020 is 5.0%. In 2020 it was 4.5%. In 2021 it jumped to 14% and then in 2022 reached 15.8%. the highest on record.
30-year average inflation rate for residential and nonresidential buildings is 4.1%. But when excluding deflation in recession years 2008-2010, for nonresidential buildings the long-term average is 4.7% and for residential is 4.9%.
For Non-bldg Infrastructure the 30-year average is 3.6%. When excluding deflation in the recession years 2008-2010, Non-bldg long-term average inflation is 3.9%.
All of these long term averages went up in recent years because instead of including 1991-1994, at 2%/yr, we are now including 2021-2024, at 7%/yr to 8%/yr. All long term and short term inflation rates went up.
Since 2011, Nonres Bldgs inflation is 4.8%, Residential is 5.4% and Non-bldg is 4.3%.
- Long-term construction cost inflation is normally about double consumer price index (CPI).
- In times of high construction spending growth, nonresidential construction annual inflation averages about 8%. Residential has gone as high as 10%.
- Nonresidential buildings inflation (prior to 2021-2022) averaged 3.7% since the recession bottom in 2011. Six-year 2014-2019 average is 4.4%.
- Residential buildings inflation (prior to 2021-2022) reached a post-recession high of 8.0% in 2013 but dropped to 3.5% in 2015. It has averaged 5.3% for 8 years 2013-2020.
- Although inflation is affected by labor and material costs, a large part of the change in inflation is due to change in contractors’ and suppliers’ margins.
- When construction volume increases rapidly, margins increase rapidly.
- Deflation is not likely. Only twice in 50 years have we experienced construction cost deflation, the recession years of 2009 and 2010. That was at a time when business volume went down 33% and jobs were down 30%.
Historically, when spending decreases or remains level for the year, inflation rarely (only 10% of the time) climbs above 3%. Avg inflation for all down/flat years is less than 1%. That did hold true in 2020 for both Nonres Bldgs and Non-bldg Infra. It also held true in 2023 for Residential. It did not hold true in 2021 or 2022. In 2021, spending was down for nonresidential buildings and flat for non-building. Inflation for both was over 8%.
Differences in Tracking Period
Be careful when referencing YTD growth. YTD can be the growth so far this year, that is, growth compared to December of the prior year, or it can be YTD currentyr/YTD lastyr. Neither represents the growth from the avg of the previous year, which becomes the historical value. Both are useful during the year to judge trends. The average growth for the year accounts for all the peaks and valleys within each year and and is the value carried forward into the index tables and charts.
Also, use caution when referencing Dec/Dec growth. An example of the difference between Dec/Dec tracking or year over year, and annual average tracking, is Steel Mill Products which was down 28.7% Dec22/Dec21, but the annual average for 2022 is still up 9.0% from the average 2021. In fact, the three years 20-21-22 show Dec/Dec combined inflation is +71%, but the annual averages for those same three years shows total inflation growth of 87%. Annual averages should be used to report inflation.
PPI Excludes Imports and Tariffs
When assessing or tracking the pricing effect of tariffs on construction materials, keep in mind that the Producer Price Index (PPI) does not include imports (imports are not produced in the US), so therefore, does not include tariffs. See items 4 and 24 in the FAQ provided by the Bureau of Labor Statistics. Construction PPI changes reflect pricing decisions domestic producers make on domestic products in reaction to tariffs on imported products. Tariffs have big impact on domestic prices.
BLS explanation of method and definitions
The price change we see in the PPI for construction materials reflects the domestic material prices of ALL other domestically produced materials used in the industry. While tariffs may affect only 10% of products used in the industry, the PPI shows us the domestic producers reaction applied to the other 90%.
For example: The 2018 steel tariffs of +25% applied only on imported steel, affected only 30% (the imported share) of steel used in US. However the PPI shows us that the cost of ALL DOMESTIC steel mill products (of all types) produced in the US increased avg 18% in 2018, after the steel tariffs were imposed. Prices of domestic steel receded somewhat, but the point is that tariffs caused a price increase also in domestic steel. The increase in PPI is domestic producers pricing response in reaction to tariffs. Tariffs impacted pricing decisions on all domestically produced products, not just the imported products. Consumers pay the price.
PPI Construction Materials Inputs Indices
See this post for August PPI update Construction Briefs Sept 2025
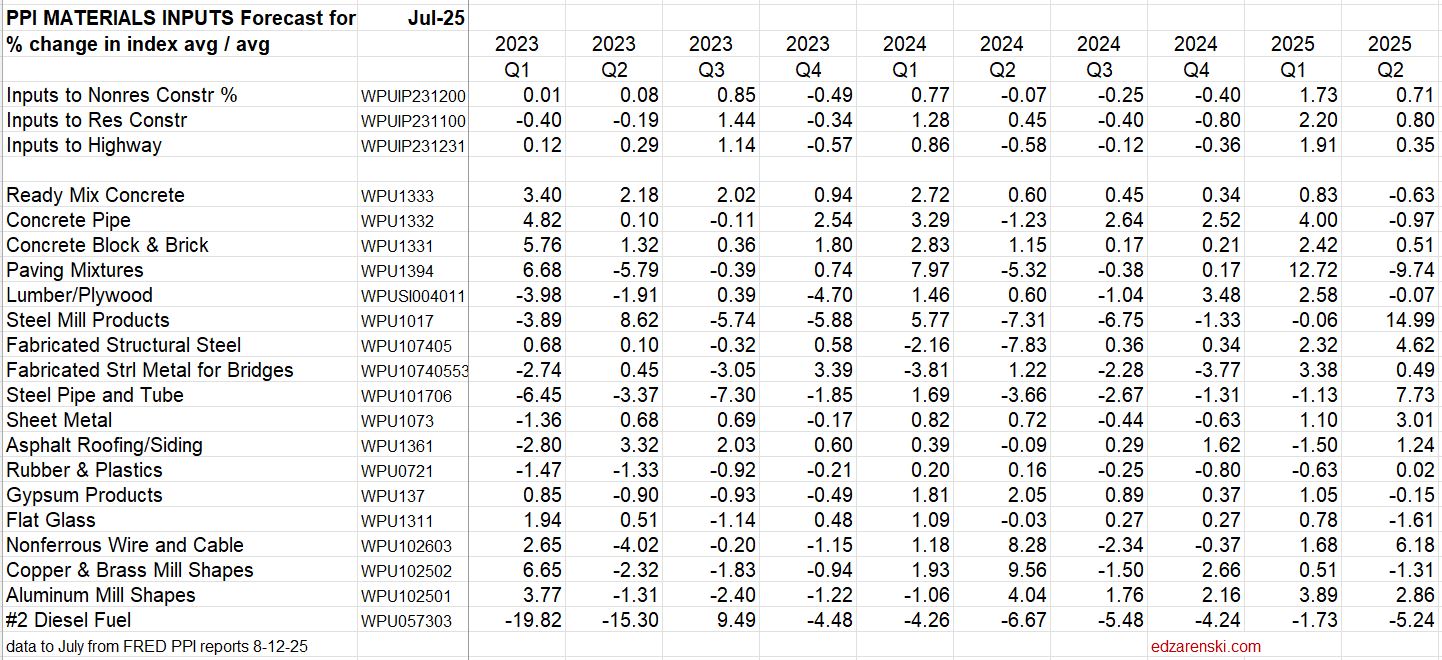
ALL PPI DATA TABLES UPDATED TO JUL 8-15-25
ALL PPI DATA UPDATED TO APR 5-15-25 PPI data INPUTS for the month of Apr: Paving Mixtures -9.5%, Steel Mill Products +5.8%, Steel Pipe & Tube +6.3%, Nonferrous Wire +3.7% YTD25/avg24: Concrete Pipe +8.5%, Paving Mixtures -8.5%, Lumber/Plywd +4.9%, Steel Mill Products +3.7%, Nonferrous Wire +3.5%, Diesel -10.8%. PPI data FINAL DEMAND Apr closes out Q1. Q1’25/Q4’24: Avg Nonres Bldgs +0.6%, School +0.4%, Healthcare +2.2% YTD25/avg24: Avg Nonres Bldgs +1.35%, School +1.4%, Office +1.6%, Healthcare +2.91%.
Inputs Table updated 2-15-25 Jan’25 Inputs are up, +0.8% to Nonres, +1.2% to Residential and 1.2% to Highway, the largest increases since Jan’24. The largest Input item increases in January are Paving Mixtures (up 14.6%), Diesel Fuel (up 3.6%), Concrete Brick, Block & Pipe (up 2.2%), Copper & Brass Shapes (up 1.9%) and Flat Glass (up 1%). Steel Pipe & Tube is down 1.3%. Both Lumber/Plywood and Fabricated Structural Steel are down 0.5% or less.


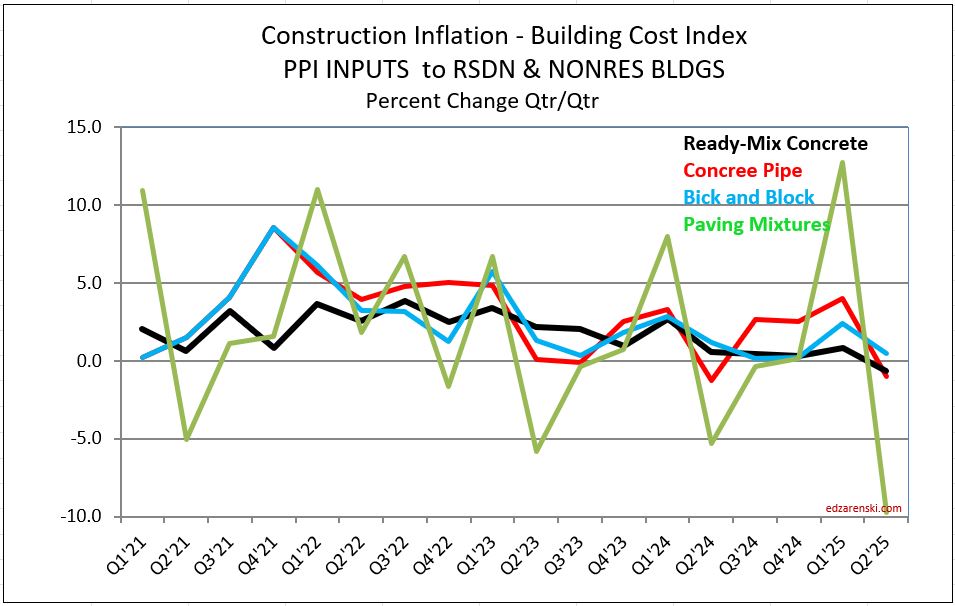

In the quarterly percent change table you can see the drop in Q3’22 and more in Q4’22, a sharp change in the rate of inflation. This shows up as expected in lower average of Inputs to Res and NonRes for 2023.
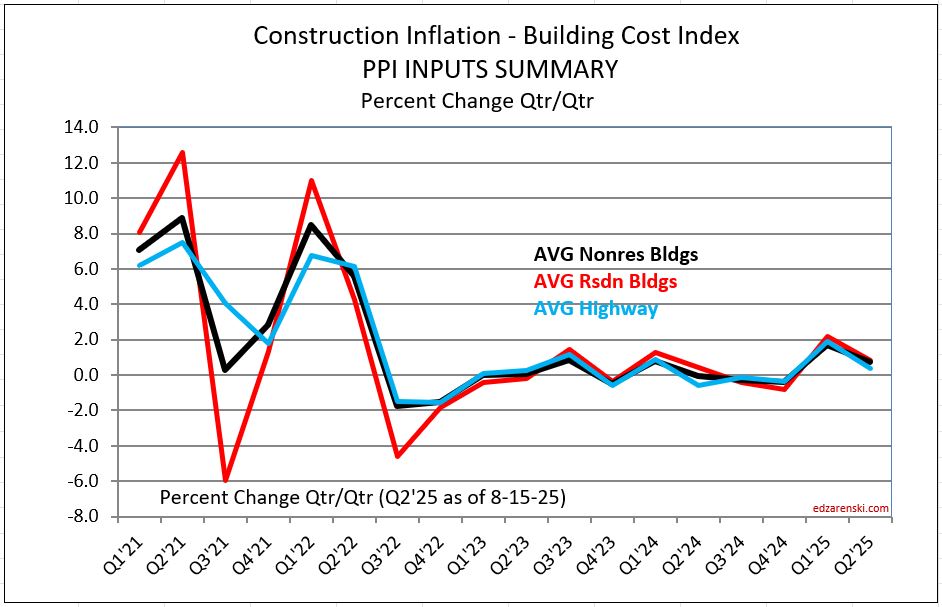
2-15-25 PPI Materials Inputs for 2024 to Residential are up 1.7%, to Nonres Bldgs are up 0.6% and to Highway are up 0.5%.
In all three of these Inputs PLOTS, the materials plots above and this Summary plot, so far Q1’25 is only Jan. It will wiggle around for 2 more months.
A General construction cost index or Input price index doesn’t track whole building final cost and does not capture the full cost of inflation in construction. Final cost indices represent total actual cost to the owner and are often higher than General indices. Producer Price Index (PPI) INPUTS to construction reflect costs at various stages of material production, generally do not represent final cost of materials to the jobsite and do not include labor, productivity or margins. PPI Final Demand indices include all costs and do represent actual final cost to the Owner.
PPI Construction Final Demand Indices
PPI Final Demand indices should not be referenced monthly. These are quarterly indices. PPI Final Demand Indices are for Nonresidential Bldgs only. Every three months (Jan, Apr, Jul, Oct) BLS performs an update survey to correct the PPI Final Demand indices for the current month and the previous two months. For more than two years, in most quarters, about 80% to 90% of the change in the index for the quarter was posted in the update month. In some quarters, growth is flipped from negative to positive in the update month. And still in other quarters the correction month doubles or halves the rate of growth. January data (released in Feb) is an update month. The PPI Final Demand for Jan. is basically the correction for Nov.+Dec.+Jan. The index should NOT be compared mo/mo. Compare qtr/qtr, but make sure to use the correct update month with two other months, (Nov+Dec+Jan)/(Aug+Sep+Oct).
Due to the nature of the PPI Final Demand Index, (2 monthly readings from model then every 3rd month correction by contractor survey), the correction month for 5 of the last 8 quarters flipped the sign of the modeled months. In 2 of the remain 3 months the correction months more than doubled the rate of change for the previous 2 months. There is no other proof needed to convince you to take care when using this index. Get it right.
2-15-25 The PPI Final Demand table below is updated to JAN 2025 data.
PPI data FINAL DEMAND Apr closes out Q1.
Q1’25/Q4’24: Avg Nonres Bldgs +0.6%, School +0.4%, Healthcare +2.2%.
YTD25/avg24: Avg Nonres Bldgs +1.35%, School +1.4%, Office +1.6%, Healthcare +2.91%
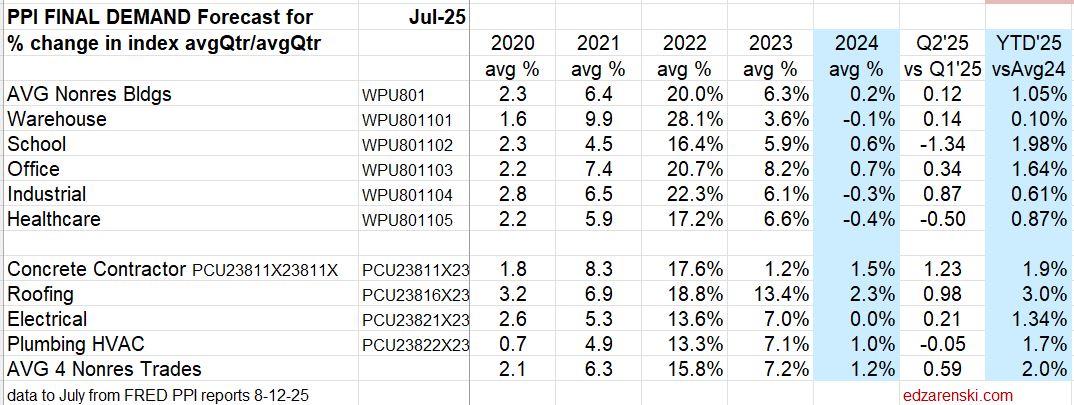
Jan is the correction month for Q4, so the Jan 2025 value closes out the 4th qtr 2024. Most bldg types and contractors are up in the 2nd half 2024 from the 1st half, but cost growth has been nearly flat. If extended, the trend leading into 2025 is for slow inflation growth. However the Roofing trades are increasing at a slightly faster rate than all others.
Due to the nature of the PPI Final Demand Index, (2 monthly readings from model then every 3rd month correction by contractor survey), it is not uncommon that the contractor survey correction month flips the sign of the modeled months for the quarter.
In 2023, for each quarter, we see two months posted positive, then a large negative value for the correction month. The negative correction is large enough in all cases to turn the entire quarter negative. Here’s an example: for the period May-Jun-Jul, Jul is the correction month. PPI values were +0.09%, +0.02%, -1.23%. The average for each of the 3mo is -0.37%, (the sum of the 3 months divided equally. The May and Jun values that were originally posted based on modeling flipped from + to – after the contractor survey value is applied to the QTR. That highlights why PPI Final Demand indices should not be referenced monthly.
However, these declines are from such a high mark at the end of 2022 (we began 2023 up 11%), that the rate as we began 2024 is still up 6% to 7% from the average in 2022.
9-5-25 Q2 Final Demand Index closed out with this July data. Both Table and Plot are updated.


SEE ALSO PPI Data Sept’24
Construction Analytics Building Cost Indices and Reference Indices
2-21-25 Current and predicted Inflation updated to Q4’24
- 2022 Rsdn Inflation 15.8%, Nonres Bldgs 12.8%, Nonbldg Infra 17.3%
- 2023 Rsdn Inflation 2.5%, Nonres Bldgs 5.6%, Nonbldg Infra 6.3%
- 2024 Rsdn Inflation 3.0%, Nonres Bldgs 3.2%, Nonbldg Infra 3.4%
Since 2011, Nonres Bldgs inflation is 4.8%, Residential is 5.4% and Non-bldg is 4.3%.
2-21-2025 Inflation Forecast, Nonres Bldgs +4.0%, Residential +4.7% and Non-bldg +4.0%. (This is a pre-tariff forecast.)
5-15-2025 Inflation Forecast, Nonres Bldgs +4.4%, Residential +5.0% and Non-bldg +4.3%. (This is a preliminary tariff forecast.)
9-3-2025 Inflation Forecast, Nonres Bldgs +4.4%, Residential +4.7% and Non-bldg +4.0%. (This is a preliminary tariff forecast.)
10-17-2025 Inflation Forecast, Nonres Bldgs +4.2%, Residential +3.8% and Non-bldg +4.0%. (This is a preliminary tariff forecast.) These October revisions are NOT yet carried into the tables and plots. Only Residential changed considerably, however, it is the most dependent on government data, which is currently not available. The biggest change is in the Census Bureau Lasperyes Index, a constant quality residential new build index, which now includes August data and both June and July were revised down slightly.
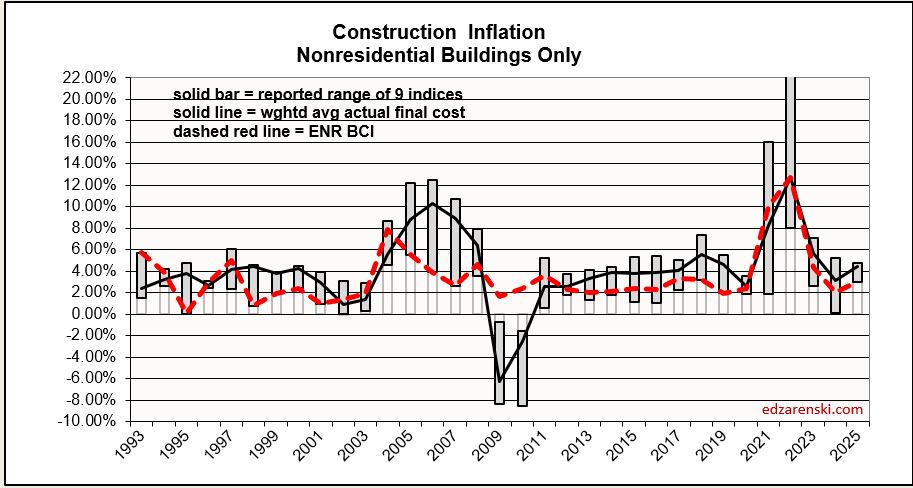
The following Construction Inflation plot (for Nonresidential Buildings only) shows three elements: 1) a solid grey bar reflecting the max and min of the 10 indices I track in my weighted average inflation index, 2) a solid black line indicating the weighted average of those 10 indices, and 3) a dotted red line showing the Engineering News Record Building Cost Index (ENR BCI). Notice the ENR BCI is almost always the lowest, or one of the lowest, indices. ENR BCI, along with R S Means Index, unlike final cost indices, do not include margins or productivity changes and in the case of ENR BCI has very limited materials and labor inputs.
Most of the tables and plots here are cumulative indexes. Construction Inflation annual percents for the three major sectors, Residential, Nonresidential Bldgs and Non-building Infrastructure, are recorded in this short table, Escalation form Prev Year. Useful to compare to last year, but you would need to mathematically do the compounding to move over several years.
Final cost indices represent total actual cost to the owner and are generally higher than general indices. Producer Price Index (PPI) INPUTS to construction reflect costs at various stages of material production, generally do not represent final cost of materials to the jobsite and do not include labor, productivity or margins. Even with that, a PPI Inputs index +20% for a material could be only a +5% final cost. PPI Final Demand indices include all costs and do represent actual final cost. The solid black line (above) represents the Construction Analytics Building Cost Index for Nonresidential Bldgs and is a final cost index.
9-3-25 Although the PPI data was all updated, as of yet it does not have a big effect on inflation. Some slight increase is built into my inflation to account for PPI increasing in the 2nd half. The inflation tables do not yet need an update. Inflation tables will be updated soon.
2-21-25 All index tables and plots updated to Q4’24. NOTE: all prior index tables were set to base year 2019=100. All these updated tables are set to base year 2024=100.
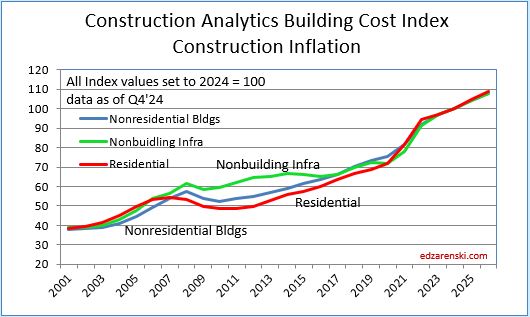
All of the Index Tables and the plot below, Construction Analytics Building Cost Index, show the cumulative inflation index, or the cumulative compounded effect of inflation for any two points in time.


How to use an index: Indexes are used to adjust costs over time for the effects of inflation. An index already compounds annual percent to prevent the error of adding annual percents. To move cost from some point in time to some other point in time, divide Index for year you want to move to by Index for year you want to move cost from, TO/FROM. Costs should be moved from/to midpoint of construction, the centroid of project cost. Indices posted here are at middle of year and can be interpolated between to get any other point in time.
The three yellow highlighted lines in the index tables are plotted here. The three major sectors, Residential, Nonresidential Buildings and Non-building Infrastructure,
This table and plot is an extension of the tables and plots above. Data is as of Q4 2023, but the table covers from 1967 to 2000. Data is pretty sparse.

Non-building Infrastructure Indices
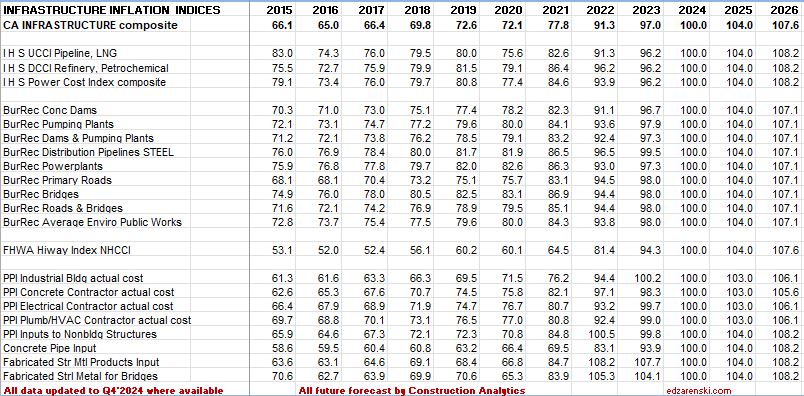

In the Index tables above, dividing the current year by the previous year will give the current year’s inflation rate. All indices are the average rate for the year.
Also, in the tables above, all reference indices data is gathered from the original source, then all are normalized to a common base, 2019 = 100. This allows us to see how different indices compare.
Comparison of Indices
This plot compares four final cost indices and three inputs cost indices. Prior to 2020 there is a lot of symmetry in the final cost group. Everything changed after that.

Previous year Construction Inflation 2024 – last updated JUL 2024 – BASE 2019=100
SEE ALSO Tariffs Create Unknown Costs to Construction
Links to Data Sources Construction Inflation >>> Links
Outlook 2025 CONSTR OUTLOOK 2025 Feb 2025
Links to Explanations of PPI Index PPI Explanation provided by AGC

Thanks for the clear explanation! As someone who’s followed construction trends a bit, I never realized how important using the right cost index is. Makes total sense that only tracking full final costs gives the full picture. Really informative post!
LikeLike