New Construction Starts, as reported by Dodge Data and Analytics, are up +13% for the total three years 2020+2021(actuals) + 2022(estm). Residential starts will be up +35%. Nonresidential Bldgs starts are at 0%. Nonbuilding starts are down -7%. This includes the forecast that has Nonresidential Bldgs and Non-Bldg starts both up +8% in 2022.
Construction Backlog leading into Jan 2022 vs Jan 2020 will be down -8%. Residential backlog will be up +34%, but Nonresidential Bldgs backlog will be down -14% and Non-Bldg backlog will be down -17%.
(Construction Analytics measures Backlog at the start of the year vs backlog at the start of the previous year. This is compared to ABC Backlog indicator, which measures current backlog compared to previous year’s revenue.)
Backlog at the beginning of the year or new starts within the year does not give an indication of what direction spending will take within the year. Backlog increases if new starts during the year is greater than spending during the year. An increase in backlog could immediately increase the level of monthly spending activity, or it could maintain a level rate of market activity, but spread over a longer duration. In this case, there is some of both in the forecast. It takes several years for all the starts in a year to be completed. Cash flow shows the spending over time.
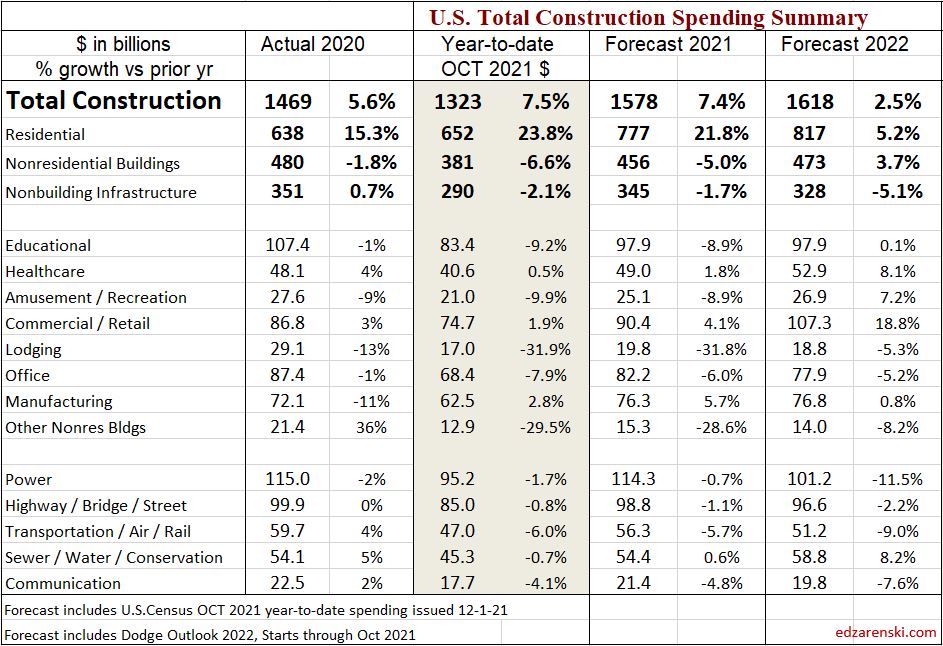
Spending for 2021, with 10 months actual in year-to-date, is forecast up +7.4%. However, that can be misleading. Residential spending for 2021 is up 22% while Nonresidential Bldgs is down -5% and Non-Bldg is down -1.7%.
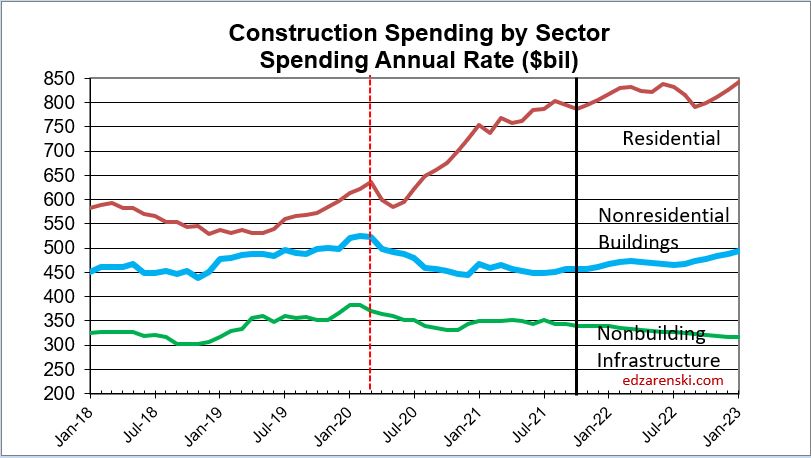
Spending includes inflation which does not add to the volume of work.
“This is the beginning of trying to work through supply chain problems…inflation will still get worse before it gets better ” Diane Swonk, Chief Economist Grant Thornton 11-12-21
My current and predicted Inflation rates:
- 2020 Residential 5%, Nonres Bldgs 4.8%, Nonbldg Infra Avg 4.5%
- 2021 Residential 14.2%, Nonres Bldgs 6.8%, Nonbldg Infra Avg 7.8%
- 2022 Residential 7%, Nonres Bldgs 4.5%, Nonbldg Infra Avg 3.7%
- There is greater chance for rates to move up than down.
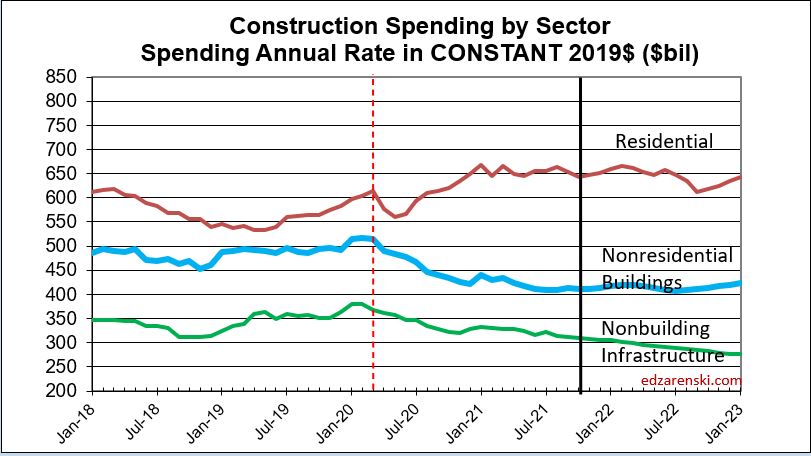
After adjusting for inflation, total volume in 2021 is down -3%. Residential volume for 2021 is up +7% while Nonresidential Bldgs volume is down -11% and Non-Bldg volume is down -8%.
Volume declines should lead to lower inflation as firms compete for fewer new projects. However, if jobs growth continues while volume declines, then productivity continues to decline and that will add to labor cost inflation.
Jobs average over the year 2021 increased +2.3%.
Spending Forecast for 2022 is expected to increase +2.5%. Residential spending for 2022 is forecast up +5%. Nonresidential Bldgs forecast is up +4%. Non-Bldg forecast is down -5%.
One important thing that happens when we find out inflation rose much faster than we would have thought, production hasn’t been as great as we thought.
When volume decreases and jobs increase, productivity is declining.
Many construction firms judge their backlog growth by the remaining estimate to complete of all jobs under contract. The problem with that, for example, is that Nonresidential Buildings spending (revenues) are expected to grow +4% in 2022, but after adjusting for inflation the actual volume of work is down about -1%. By this method, in part these firms are accounting for an increase in inflation dollars passing through their hands. Spending includes inflation, which does not add to the volume of work.
The Non-Building Infrastructure spending forecast for 2022 is more affected by a drop of -17% in starts in 2020 (2020 starts would have generated 30% of 2022 spending) than by any increase in starts in 2022 (which would generate only 15% of 2022 spending).
After adjusting for inflation, Residential volume for 2022 is forecast down -1.5% while Nonresidential Bldgs volume is forecast down -1% and Non-Bldg volume is forecast down -9%. Total volume for 2022 is forecast down -3%.
On average about 20% of new nonresidential buildings construction starts gets spent within the year started, 50% is spent in the next year and 30% is spent in future years. (For residential the spending curve is more like 70%-30%).
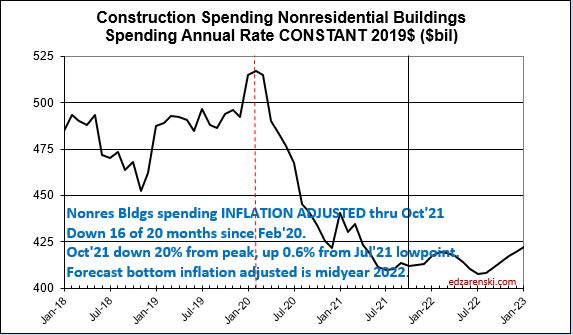
Nonresidential Buildings construction starts recorded 12 consecutive months (from April 2020 through March 2021) at 20% or more below the Q4’19-Q1’20 average of starts. Now 20 months after the onset of the pandemic, Nonres Bldgs starts have posted 16 down months and are still down 13% from Mar 2020.
In constant (inflation adjusted) dollars, as of Oct. 2021, Nonres Bldgs spending is 20% below the Feb 2020 peak. The bottom is expected in mid-2022.
If new construction starts in 2022 post an add of $100 billion in new starts for infrastructure, only about $20 billion of that would get put-in-place in 2022. The cash flow schedule for that $100 bil of new starts would extend out over 3 or 4 years. Most of that $100 bil would get spent in 2023 and 2024.
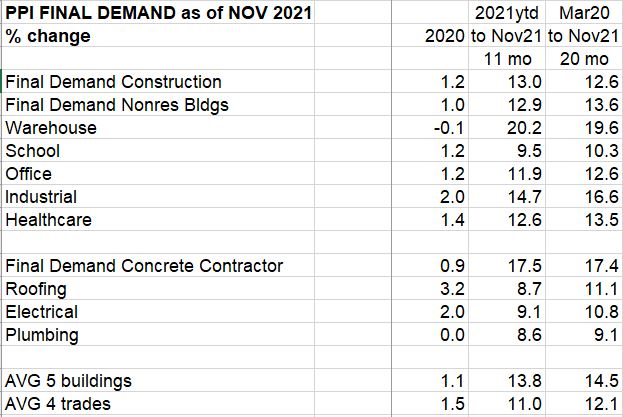
Current Final Demand pricing for Nonres Bldgs and Trades is highest on record. Prices support high inflation this year and next. Do not expect inflation to turn to deflation in 2022. The only time in 50 years that construction experienced deflation was in the period 2008 to 2011. At that time conditions were 10x worse than now.
An interesting question came up recently, related to the plot below, that prompted me to look at jobs data a little deeper. The question was, If jobs are increasing faster than volume of work (negative impact) can we tell if it’s production employees or supervisory employees? BLS reports ALL construction jobs (~7.5million) and Production jobs (~5.5million). The difference between these two data sets is supervisory employees.
Looking at the average number of construction jobs in the last 4 years, the average of 2021 jobs vs the average of 2017 jobs, production jobs increased +5%, but supervisory jobs increased +12%.
Looking at 2021 vs 2019, in the past 2 years, production jobs decreased by -1.5%, but supervisory jobs increased +1.7%. During this period spending increased +3.5%, but after adjusting for inflation, volume declined -9%.
In 2011, supervisory jobs was 24% of all construction jobs. Now it is 35%. Growth in supervisory jobs has had a greater negative impact than production jobs on the spread between jobs and volume.

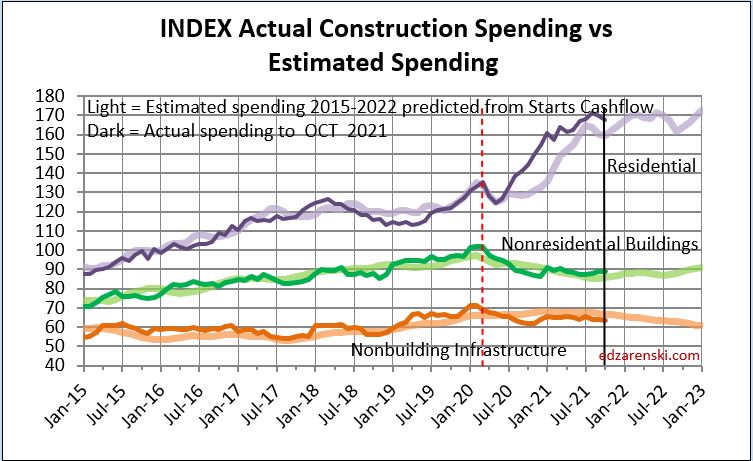
And finally, here’s one of the markers I use to check my forecast modeling, my forecasting performance tracking index. The light plot line is forecast predicted from my modeling. The dark plot line is actual construction spending. Even after any separation in the indices, the plots should move at the same slope. Almost without fail, the forecast model, estimated spending from cashflow, predicts the changes in direction of actual spending.

So interesting. Thank you so much for researching and sharing.
LikeLike