Construction Analytics updates the Construction Spending Forecast every month, usually publishing at least a Brief, every other month. The AIA Consensus solicits forecasts from 9 firms that prepare construction spending forecasts and publishes a Consensus Forecast every January and every June-July. The AIA Consensus reports only on nonresidential buildings.
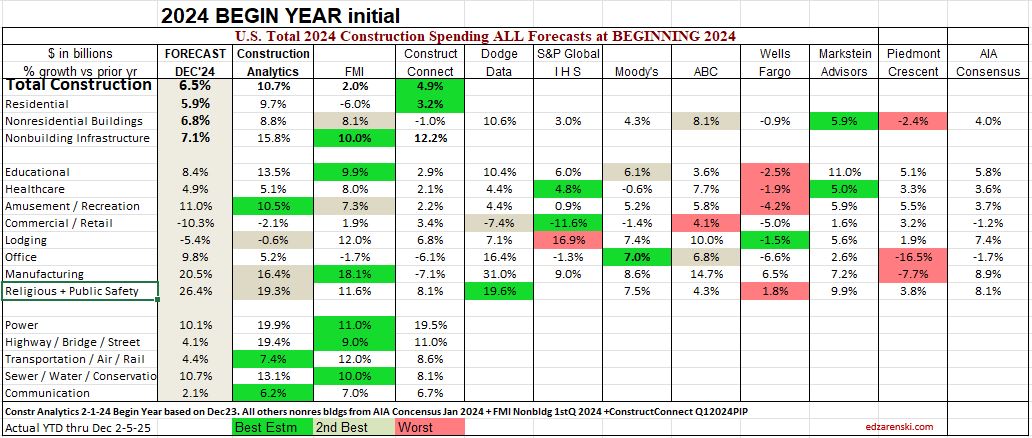
This table captures the percents growth issued by the 9 firms reporting in the AIA Consensus and the Consensus average. Included is Construction Analytics full forecast. Also included, FMI and Construct Connect also provide full forecasts. Capturing this history provides a ready template to compare “How’d we do?” at the end of the year. It’s not often that we get to look back at forecasts to see how they performed when compared to the actual results. But I’m sure you’ve been asked, “Did you ever go back and look to see how you’ve done?”
You can see in this most recent 2025 table that some of the forecasts vary widely. For instance, in the most recent forecast for 2025: Data Centers forecasts range from +17% to +42%; Manufacturing from -11% to +18%; Educational -2% to +10%; Healthcare -1% to +21%; Warehouse -9% to +12%; Lodging -7% to +22%. Very few (if any) forecasts are in agreement. That’s why it’s valuable to capture the data and compare it to actuals once all the data is in at the end of the year. The first total for every year is issued in Feb., but the final annual actual value is subject to Census revisions until July of the following year,
These are the current Jan forecasts for 2025 nonresidential Buildings spending

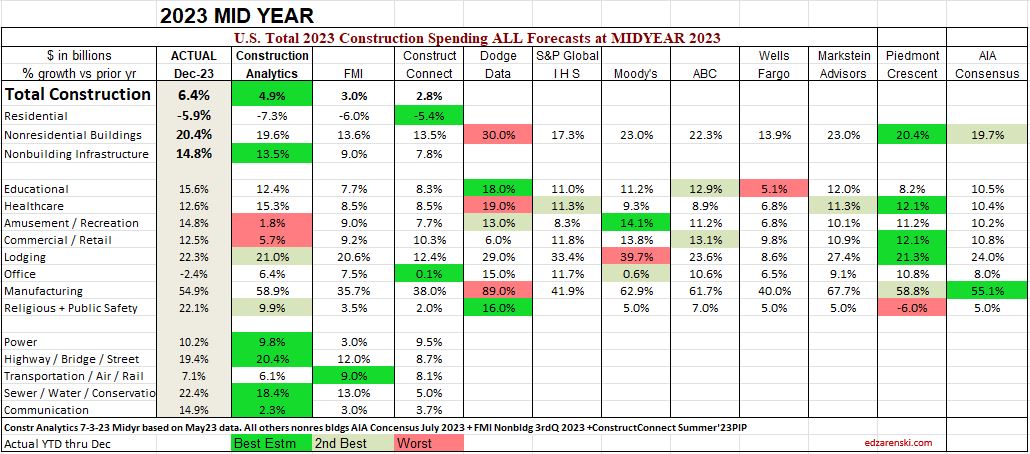
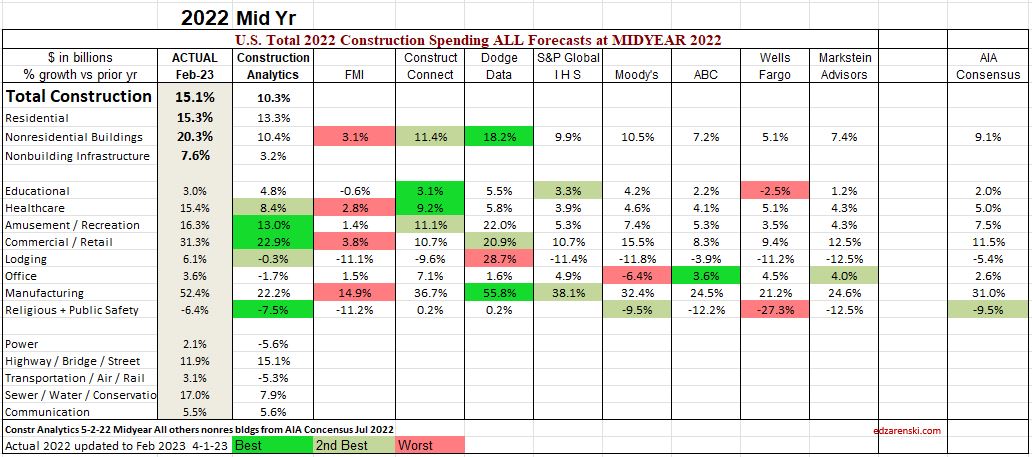
Here are some past results, looking back in chronological order. Each table summarizes the percent growth forecast issued by each forecaster. Then, the forecasts are compared to the actual value. Individual market forecasts are marked as best, 2nd best and worst forecast. Color makes it easy to see the performance at a glance. This is a simple table collecting all the forecasting data for one period into one table for ease of comparison. Nothing is changed after the forecasts are issued, except for the actual data at year-end to which it is compared, which gets revised three times through July of the following year after the annual results are posted. You will see that I’ve done better in some forecasts than others. I scored a lot of the 2nd best estimates. Other old posts on this blog show the year I absolutely bombed, 2021, I think. My column was a sea of red. You might think that the updated Midyear forecast is always an improvement from the Beginning of year forecast, but that is not always the case, as you will see. The numbers don’t lie. We post our forecasts and wish for the best. Sometimes we get the best.


The inquisitiveness in me wants to know how this shakes out, so I put a score to the results. Here’s three years of completed data with two forecasts each year, but I took out (low scoring 8pts) Piedmont, as they were not involved to provide a forecast for 2022. So, How’d we do? These six tables, two each from 2022, 2023 and 2024, are scored here. There are 8 Nonres Bldgs markets plus the Nonres Bldgs total included in the count, so there are 9 line items. I gave 3 pts for best, 2pt for 2nd and -1 for worst.
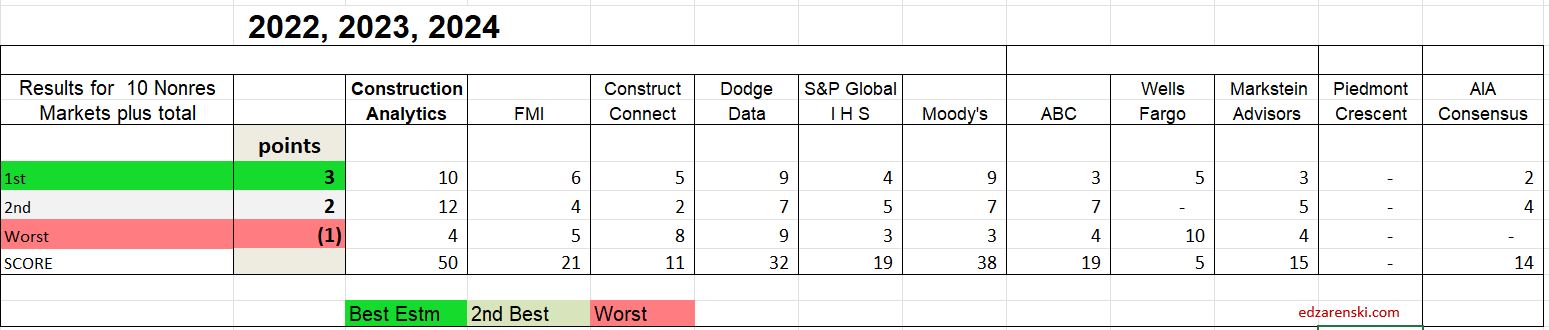
See any favorites of yours in the list of forecasters? Well, this is a small subset of their forecasting performance over recent years. What’s their score?
I summed the same sets of data back to 2020 to find if this trend, that Construction Analytics is scoring highest, is consistent. Again, I took out (low scoring 8pts) Piedmont, as they did not provide a forecast in 20, 21 or 22. The trend is similar. ABC picked up the most points (29), Markstein Advisors picked up 26, but Construction Analytics still picked up 22 points and retained the top spot.
The maximum any company can score in one forecast is 27 by scoring best on all 8 line items plus the total. The highest single forecast score in five years by any company is 17, that was by Construction analytics in the 2023 Beginning of Year forecast. Out of 11 firms across 9 forecasts in 5 years (no 2020 Beginning forecast and only 4 for Piedmont), or 94 forecasts, only 7 times has any firm scored higher than 10 out of a max 27. That might even make you think forecasting is difficult.
Sometimes, no forecast gets even close to the actual number. As an example, in the 2022 Beginning of year forecast, the average difference from forecasts to actual growth for Manufacturing was off by 40%+. The closest forecast was only within 23%. Why is that? Well, I base my forecast of construction starts. I’m sure others do too. New starts reported for a 3yr period 2020 thru 2022 averaged $50bil/year. But construction spending for the same period grew from $75bil/yr. to $125bil in 2022 and then shot up to $190bil in 2023. The starts report did not give a clear indication of what was leading into spending.

Some of the things I watch for when preparing my forecast are; What is the current rate of spending (Dec’24), compared to the year (2024) average, as we begin the new year (2025)? and What is the recent rate of growth? Does my forecast fit within the current trend? For example, as we begin 2025, the current rate of spending in Q4 2024 on Data Centers is already up 16% from the average of 2024, and it is climbing at a rate from 1%/mo to a few percent per month. That means that unless we experience some unexpected event that would cause spending to decline, we will easily increase from 16% growth to far greater by the end of 2025, or for that matter even by the end of Q1. So, the low is already established at 16% as we begin the year. All growth is an increase from there. New starts have averaged growth of 50%/yr for the last three years, so growth is established. There are a few low forecasts of 17%, 18% and 19% spending growth for the year. That would mean remaining spending growth for all of 2025 would be 1% to 3%, but that’s not realistic with new starts at 50% growth. Forecasts in the range of 20% +/- will be surpassed in the first few months of 2025. The AIA consensus 2025 forecast for Data Centers is +21.9%. I suspect that will be surpassed before Q1 is over.
There are some older posts on this blog that capture this info from earlier years. Not sure at this point what the title of the post would be to search for them. If you are so inclined, try searching for AIA or for the word Compare or Consensus. SEE Link Below. I had awful results one year.
So, I may not have prepared the best total forecast every year from 2020 thru 2024, but overall, I posted the most overall 1st or 2nd best line by line forecasts. In fact, for the Nonres Bldgs Totals (the sum of the 8 markets), out of the 9 forecasts from 2020 thru 2024, I had only 2 of the best Totals forecasts. Markstein Advisors is the only other firm that had 2 of the best totals forecasts.
I will close by saying, the data for the past 3 years or even 5 years shows that I’m providing you with the longest trend best forecast of Nonresidential Bldgs cost growth, and I’m happy to do so.

Ed,
I took a deep-dive on this data a couple of weeks ago when the AIA first released the January consensus forecast.
A couple of the data sets simply don’t make sense, particularly in the institutional category. I contacted AIA to try to talk to someone there about the forecast but got no response.
In other words, I would be hesitant to put a lot of credibility into this latest consensus forecast.
Regards,
Dale
612 803 6103
LikeLike
At AIA, you want to speak with Kermit Baker. But, I think he’s located at Harvard. See Joint Center for Housing Studies.
LikeLike
It looks like Institutional TOTAL probably still includes religious and Public Safety, which is up. AIA removed those two line items from the Consensus report with this issue.
LikeLike