PPI material inputs as of SEP’26
Nonres Bldgs UP 2.08%, Up 8/9 months in 2026. YTD’26 vs YTD’25 = 7.02%.
Residential Bldgs UP 1.97%, UP 8/9 months in ’26. YTD’26 vs YTD’25 = 6.25%
Highway UP 2.05%, Up 8/9 months in 2026. YTD’26 vs YTD’25 = 6.93%
Industrl Structures UP 1.40%, Up 8/9 mo in 2026. YTD’26 vs YTD’25 = 8.31%.
All 4 categories above revised up slightly in each of the previous 4 months
ALL 4 = largest monthly increase since March of 2022. (except Industrial Structures, which occurred last month).
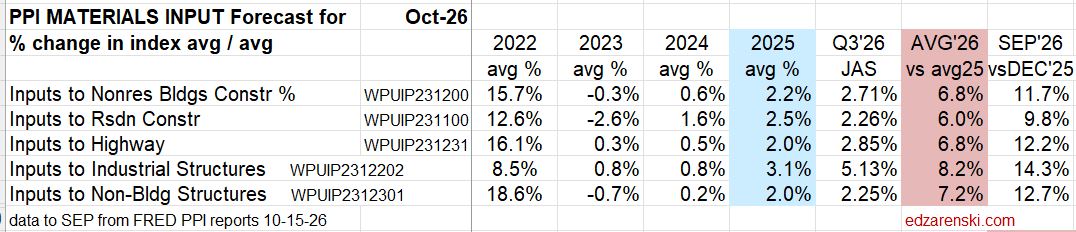
The Avg’26 vs Avg’25 is avg ytd for 2026 vs the 12mo avg of 2025, about 7%. If we maintain the status quo this is the most likely outcome for the year. The four segments I wrote about above are same ytd of each year, (9mo’26 / 9mo ’25) so the % is a little different.
Sep’26 is at the highest and we started the year at the 2025 low in Dec. Instead of comparing to last year’s average, it shows growth just in the nine 2026 months. But, it doesn’t compare to the baseline (avg’25).
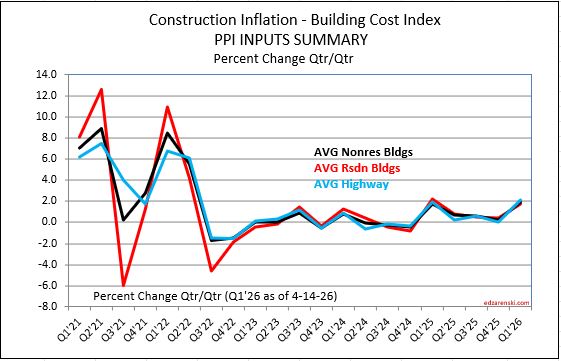
The years 21-22 were so erratic, it compresses the rest of the plot. So, here’s the historical plot back to Q1’21 and the larger scale more recent.
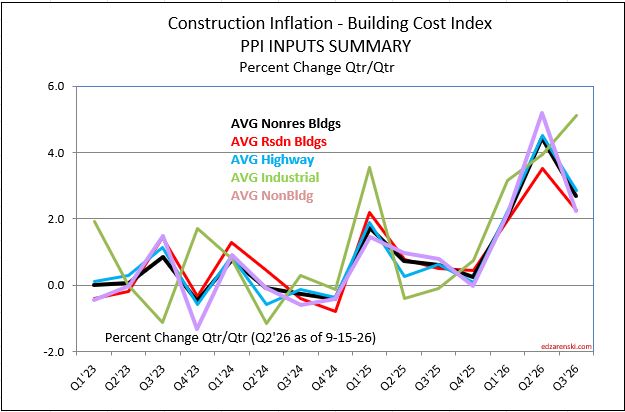
In 2026 already we have posted the fastest rate if inflation growth in several years. The table below includes Q2’26 and Q3’26, the two highest inflation growth quarters since Q2’22.
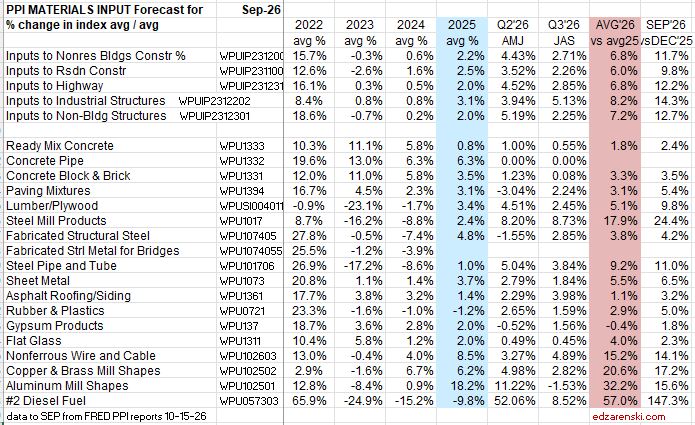
Up to this point, all the above INPUTS reference only materials. There is labor to consider as part of inflation. Wages will not increase 12%. However, over the past year jobs increased by 1.5% and the volume of work produced fell 8.5%. So effectively, that means the cost of labor increased 10%, without even taking a wage increase into account.
PPI Construction Final Demand Indices
A General construction cost index or Input price index doesn’t track whole building final cost and does not capture the full cost of inflation in construction. Final cost indices represent total actual cost to the owner and can often be higher than General indices. Producer Price Index (PPI) INPUTS to construction reflect costs at various stages of material production, generally do not represent final cost of materials to the jobsite and do not include labor, productivity or margins. PPI Final Demand indices include all costs and do represent actual final cost to the Owner.
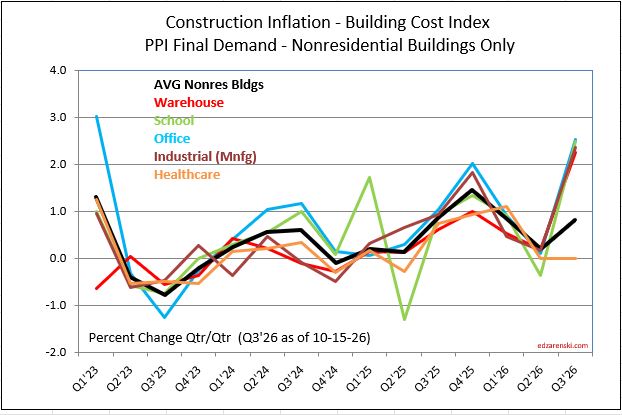
PPI Final Demand indices should not be referenced monthly. These are quarterly indices. PPI Final Demand Indices are for Nonresidential Bldgs only. Every three months (Jan, Apr, Jul, Oct) BLS performs an update survey to correct the PPI Final Demand indices for the current month and the previous two months. For more than two years, in most quarters, about 80% to 90% of the change in the index for the quarter was posted in the update month. In some quarters, growth is flipped from negative to positive in the update month. And still in other quarters the correction month doubles or halves the rate of growth.
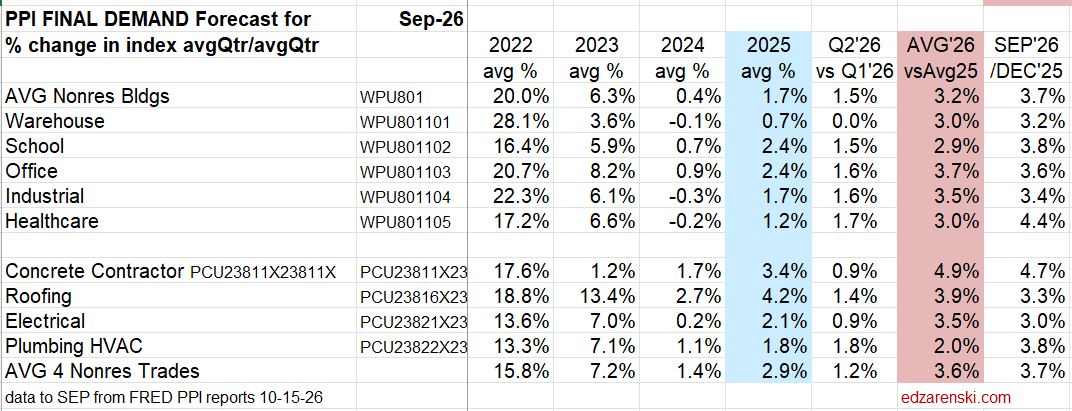
The Final Demand data represents how much of the input costs have been passed on to the consumer. Final Demand PPI (as built final cost) has not yet caught up to the increases in inputs. Last month I said, “I’d expect it to follow at least within 3 to 6 months.” Final Demand cost growth is much more restricted than input costs. Contractors may be restrained by contract limitations and cannot just increase expected final costs every month. Some added input costs will be recovered through negotiation. Some costs will be increased in subsequent bids. Also, considering the amount of new potential work is net down, contractors might not pass on all costs to be more competative.
The Final Demand index has a revision month every quarter. Oct data will revise the period Aug-Sep-Oct. So, we won’t really know the Q3avg until we get the Oct data. The revision is usually UP strong.
See Also AUG’26 PPI

