Construction Jobs / Workload Balance
11-7-17
The last time construction jobs and workload were balanced was 2005. From 2006 through early 2011, workload dropped 15% greater than the decline in jobs. In other words, compared to 2005, contractors started the post-recession period in 2011 with 15% less workload on hand compared to the number of workers kept on staff and that resulted in the period 2006-2011 posting the largest productivity decline ever recorded.

For a discussion on data plotted 2001 to 2011, see this post Jobs vs Construction Volume – Imbalances. In the 2001-2011 plot above, jobs and workload are set to zero baseline in Jan 2001. This shows all of 2001 through 2004 that jobs/workload was balanced. The gap between the red and the blue lines above is the variance from zero change in Jobs/Workload balance. By Jan 2011 there was a 15% workload deficit.
The 1st quarter of 2011 was a dramatic turning point. Both jobs and work volume began to increase. To visualize the variance since Jan 2011, the following plot resets jobs and workload to zero baseline in Jan 2011.

From Jan 2011 to Jun 2015, construction volume increased 24% in 4 1/2 years. Staffing output increased 19% in the same period. Contractors may still feel the effects from not being able to grow staff at that same pace as volume during that period. However, we did see the larger work volume increases make up 5% of the 15% workload deficit from the previous period 2006-2011, but it loses sight of the fact that after almost five years we had not recouped the entire lost work output from all the other 10% staff imbalance that still remained.
Work output is defined as jobs x hours worked. Construction volume is defined as spending minus inflation.
From Jul 2015 to Oct 2017, volume increased just over 1% but jobs output grew by almost 7%. During that two year period, new jobs created plus the change in hours worked by the entire workforce grew 6% more than workload. Jobs increased greater than construction volume increased. The plot shows most of that variance occurred in 2015.
Shifting the time periods slightly gives another impression of the data, overall not much different. In discussions about Construction skilled labor shortages, it’s important to understand, both construction spending and volume are at record growth levels and jobs, since recession, and in last 3 yrs, have matched volume growth.

Overall, in the seven-year post-recession period Jan 2011 to Oct 2017, volume increased 25% and jobs output increased 26%. There seems very little room to be calling this a jobs shortage. Of course, this does not address skills.
So here we are most of the way through 2017 and if we look back at the last 11 years, not only are jobs once again increasing faster than workload, but also in total since 2005 we still have 14% staff that would need to be absorbed by new workload to return to the previous jobs/workload productivity balance.
Maybe it’s time we stop calling this a jobs shortage and start referring to it as a productivity challenge that needs to be turned around.
For an expansion of more information on this topic see Jobs vs Construction Volume – Imbalances posted 8-8-17. Included is the 2001-2011 plot that explains all of 2001 through 2011.
Also, Feb 208 article breaking out residential and nonresidential sectors shows surplus in nonres and deficit in residential Residential Construction Jobs Shortages

Constant Dollar Construction Growth
11-2-17
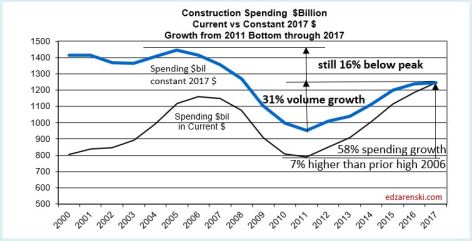
Construction spending had been chugging along very nicely from 2012 through 2016 with annual growth ranging between +6.5% and +11.0%. The average spending growth for those 5 years is 8.5%/yr. For 2017, spending growth will come in at only just over 5%.
Perhaps what may be more important is the inflation adjusted growth or constant dollar growth. Constant dollar growth measures volume. Volume growth ranged from +3.0% to +8.0% in the 5 years from 2012 through 2016. The average constant$ growth for those 5 years is 5.4%/yr. The rest of the spending growth was inflation dollars. For example: a year in which spending growth is 7% but that has 4% inflation ends up with only 3% constant$ volume growth.
From 2005 peak volume ($1,448 bil in 2017$) to the lows reached in 2011 ($954 bil), constant dollar volume dropped 34%. Since the 2011 low, volume has increased 31%. In rapid growth years volume increases between 6% to 8%/yr. In average or low growth years, constant dollar volume growth ranges closer to 2% to 3%/yr.
2017 will post the highest composite construction inflation in 11 years, 4.5%. Residential inflation has averaged 6%/yr for the last 5 years. With 2017 at 5% construction spending growth, the lowest in six years, and at the highest inflation in years, 2017 volume growth will fall to only +0.6%.
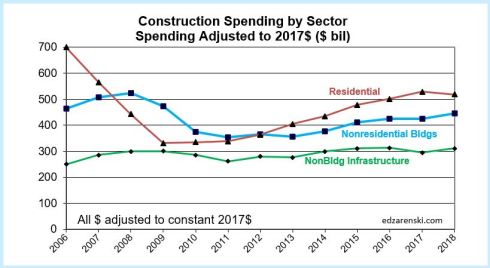
Residential, with nearly 12% spending growth in 2017, still holds onto the best volume growth in 2017 at slightly over 5%. Residential has recorded the highest volume growth in 5 of the last 6 years, the lowest coming in at +5%, averaging 8%/yr for 6 years.
Nonresidential Buildings constant dollars is down slightly for 2017, posting a volume decline of -0.2%. This was predictable since Manufacturing, after recording 90% growth from 2011 to 2015, has worked off a big backlog and dropped 15% (from an all-time high) in the last two years, most of that drop in 2017. For 2017 that drop offset $8 billion of growth from other markets. Nonresidential Buildings volume increased 20% in the previous 3 years.
Non-building Infrastructure volume is down 6% in 2017 after growing only 5% in the previous 2 years. However, the non-building infrastructure sector led all growth in 2014 at +8.5%. It should be noted that 2015 posted the all-time high for Infrastructure spending. The largest declines since then are in Environmental Public Works projects, Sewer/Water/Conservation. All three markets posted declines in new project starts in 3 or 4 of the last 4 years. Spending in 2017 is down 17% from the most recent high in 2015.
Public works spending is responsible for 80% of the dollar decline in non-building infrastructure spending since the high in 2015.
In 2018, Nonresidential Buildings and Non-building Infrastructure lead spending growth. Residential spending will slow considerably after six years of solid growth. Constant$ volume growth after inflation will climb back to +2.3% with the two nonresidential sectors over 5% and residential dropping to a volume decline.
SEE INFLATION TABLES HERE CONSTRUCTION INFLATION
These articles all relate to Constant dollars (Inflation Adjusted)
Constant Dollars – Impact of Inflation
Are We at New Peak Construction Spending?

Ahead of the Sept Construction Spending Forecast
10-25-17
On November 1, September construction spending will be released. The September spending release is always a solid turning point for the 2017 forecast. Here’s a few facts leading into the forecast which will incorporate this data and be posted soon after the 11-1-17 spending release.
2017 construction spending will come in at $1,250 billion, up 5.5% from 2016.
Largest $ contributors to growth in 2017 spending: Residential $56b, Commercial Retail $12b, Office $6b.
Largest $ declines in 2017 spending: Manufacturing -$8b, Public Works -$6b.
Total construction spending averaged 8%/yr growth last 6 yrs (2014 & 2015 at 11%). Expect 6% in 2018, 5% in 2019
Construction spending on Infrastructure leads growth for the next 3 years and it has nothing to do with an infrastructure spending bill.
Infrastructure spending in 2018 is led by Power and Transportation markets.
Most of the 2018 spending in the Power market will be generated from starts in 2016. Equally strong 2017 starts will generate most of the Power spending in 2019.
Public construction spending in 2018 will reach highest yr/yr growth rate in over 10 years powered by Educational spending.
Commercial/Retail spending in 2018 slows but most other nonresidential buildings still show strong growth, especially Office and Educational.
Residential spending slows to a crawl after more than 100% growth in last 6 years. Currently predicting only 5% to 6% growth over next 2 years.
Residential spending may change during the year because, while spending in all other markets is dependent on starting backlog, residential spending is primarily dependent on new starts within the year
Largest $ contributors to growth in 2018 spending: Power $22b, Office $15b, Educational $10b, Transportation $5b.
Largest $ declines in 2018 spending: none greater than -$2b.
Nonresidential Buildings and Infrastructure construction will both hit new all-time highs for starting backlog in 2017 and 2018. Both will see a 9% increase in spending in 2018.

Infrastructure construction spending never dropped due to the recession as much as Nonresidential Buildings or Residential.
Nonres Bldgs dropped 35% from $438bil in 2008 to $284bil in 2011.
Residential dropped 60% from $630bil in 2005 to $252bil in both 2010 and 2011.
Infrastructure declined only 8% from $274bil in 2009 to $251bil in 2011. It rebounded to $305bil in 2015, a new high.
Nonres Bldgs spending is just 3% below the previous high but residential is still 16% below 2005.
In constant$, adjusted for inflation, Nonres Bldgs peaked at $537bil in 2000 and Residential peaked at $755bil in 2005.
Nonres Bldgs is still 21% below the inflation adjusted peak. Residential is still 30% below.
Infrastructure reached an inflation adjusted peak in 2009 at $300bil. It hit a new high in 2016 at $313bil and in currently down 6% from that high. It will set a another new high in 2018.

Watch for the new 2017-2018 Spending Forecast to be posted within the week after the September data is released 11-1-17.
These other recently posted articles also have information relative to the 2017-18 forecast
Is Infrastructure Construction Spending Near All-Time Lows?
Construction Starts and Spending Trends 2017-2018

Is Infrastructure Construction Spending Near All-Time Lows?
10-10-17
Is Infrastructure construction spending near all-time lows? This question is raised because I saw comments to this affect recently posted on a major national construction professional organization twitter feed.
First, this raises several other questions:
- Exactly what construction markets are being referenced as infrastructure?
- Does this reference include public work only, or both public and private?
- Are educational and health care being included as infrastructure?
- Does this reference constant inflation adjusted spending?
The construction markets typically referred to as infrastructure, in order of largest to least volume, include; Power, Highway, Transportation, Sewage/Waste Water, Communications, Water Supply and Conservation. Sometimes also considered are Educational (3rd after Highway), Healthcare (after Transportation) and Public Safety (2nd smallest).
If only public work is included, everything changes. Most (90%+) of Power spending is private, so it represents less than 3% of public work. The largest contributors in this case are: Highway (32% of public work), Educational (25%), Transportation (11%), Sewage (8%) and Water Supply (4%). No other market is greater than 3% of public work.
And finally, is the reference to current dollars as originally spent within each year, or to constant inflation adjusted dollars, adjusting all historical expenditures to constant 2017 dollars? Any comparison to determine if real growth has occurred should be in constant dollars, in this case all adjusted to 2017.
Typical infrastructure, not including educational, healthcare or public safety, but including all public and private sector work produces this result:

However, the most likely reference is to typical public infrastructure, not including educational, healthcare or public safety. This scenario includes only the public sector work of typical infrastructure and eliminates private spending. This eliminates 90%+ of all power work, 30% of transportation and 100% of communications, in total, more than $100 billion in current dollars. This is the result:

In both instances, the lows, whether using current or constant dollars, occurred between 1993 and 2004. The highs are recent, all occurring from 2007 to 2016. 2017 spending dropped somewhat from 2016, but this is still prone to revision, which is always up.
To answer the question, Is Infrastructure construction spending near all-time lows? NO! Infrastructure construction spending is not at or even near all-time lows. Public sector infrastructure is lower than All infrastructure, but All infrastructure is not even near recent lows. It is near all-time highs!
Infrastructure construction spending in June-August dropped to the lowest since November 2014. However, this was not unexpected. Cash flow models of infrastructure starts from the last several years show monthly spending dips and peaks. Current dips in spending are being caused by uneven project closeouts from several years ago. The actual current backlog is at an all-time high and spending will follow the expected cash flow.

Infrastructure starting backlog hit a new all-time high in 2017 and will again in 2018. Public Infrastructure new starts reached all-time highs in 2013 and 2015 and are on track to go higher in 2017. 80% of infrastructure spending within the year comes from backlog at the start of the year and that backlog may be comprised of jobs one, two, three and even four years old.
Infrastructure spending in 2017, although down slightly from the all-time high reached in 2015 and nearly equaled in 2016, will reach a new high in 2018.
(This analysis does not include any spending projections from an infrastructure investment bill).
Highway spending is currently benefiting from projects that started in 2015 but that have unusually high value and long duration. They contribute spending well into 2018 beyond the duration that typical projects have ended.
Transportation Terminal starts in the first three months of 2017 were more than three times higher than any three-month period in the previous five years. However, 2017 spending is still affected by uneven starts from two to three years ago, holding down gains in the 2nd half. Transportation will show only a 1% gain in 2017 but produces double digit gains in 2018.
Infrastructure construction spending is near all-time HIGHS and has been for the last several years. That is not meant to indicate there is no need for infrastructure investment. I think the need is well established, particularly for public infrastructure. However, I’ve been writing about infrastructure for more than a year, pointing out the level of activity in this sector and the difficulty that will arise when we try to increase work volumes. The approach to adding new work and the discussions surrounding this approach should reference accurate data, and that should include an accurate representation of current workload and future ability to absorb more work.
For much more in-depth related to infrastructure construction see this post Infrastructure Spending & Jobs

So, About Those Posts “construction spending declines…”
You know those articles you’ve been seeing, “Worst year for construction spending since 2010″, well there’s some truth to that, BUT
2017 is the 6th year of the expansion. It has slowed, but… Here comes the BUT!
10-4-17 – Construction numbers are at all-time highs! Slowing or not, activity is very strong. Looking behind the headlines, here’s what we see;
Residential construction spending is slowing the most, from +11% in 2017 to only +2% in 2018 after six years averaging 13%/yr. Nonresidential buildings spending this year just kept up with the rate of inflation (4%), none-the-less, it’s at record highs. It doubles that rate of growth to 8% in 2018. Non-building infrastructure, down 2% in 2017, next year expect growth of 10%+, coming from long duration jobs.
The real performance numbers in Infrastructure are completely hidden. Spending was near flat for three years. But during that time, contrary to every other sector which experienced inflation of 15%, Non-building Infrastructure experienced deflation of 7%. (Gee, didn’t I read somewhere that activity within a sector is a primary driver of inflation?) Anyway, flat spending means volume really increased by 7% during that time. Spending by itself never tells the whole story!
There were some expected dips in spending recently, Manufacturing, Power, Highway, and there will be more in early 2018. BUT, there are also expected boosts in spending, Office, Commercial/Retail. Some of these already have matched up with the forecast, and there are more to come in 2018, Power, Transportation.
All Nonresidential Backlog is at record highs.

Buildings and Infrastructure will both hit new all-time highs for starting backlog in 2017 and again in 2018. For four years, from 2010 to 2013, all nonresidential backlog remained fairly constant. Since then, backlog for infrastructure is up 30% and for buildings it’s up 60%. (75% to 80% of nonresidential spending within the year comes from backlog at the start of the year. For residential, 70% of spending comes from new starts within the year.) Buildings will hit spending records in both 2017 and 2018. Infrastructure spending will hit a new high in 2018.
Ignoring for the moment that comparing any month to the same month last year can be grossly misleading as to the direction the markets are headed (for reasons explained in other recent posts on this blog), 2017 total spending growth is the lowest % yr/yr growth since 2011 (not 2010). Does that make it “worst”?
Spending will gain +5.6% in 2017, the least gain in six years. Last year was +6.5%, 2013 was +6.6%. The average for the last six years is +8%. So 2017 is the worst. Pretty damn good worst!

August Construction Spending 10-2-17
Data released 10-2-17
Preliminary Report August Construction Spending
August construction spending was posted today at $1.218 trillion, up 0.5% from the 1st revision to July.
- Residential spending is up 0.5% from July, up 12.3% YTD.
- Nonresidential Buildings spending is up 1.8% from July, up 4.5% YTD.
- Non-building Infrastructure is down 0.5% from July, down 3.4% YTD.
Year-to-date through August posted at $806 billion, up 4.7% from same period 2016.
What you should know – Revisions:
Since the bottom of the recession in January 2011, through June 2017 (78 months), spending vs the prior month was 1st reported down 42 times. Values were revised up 64 times, but not all months turned positive. After revisions, spending was down vs the prior month fewer than 20 times.
Monthly values are revised the next two months after initial release. Spending has been revised UP 15x in last 18 months. The average revision in following two months is +1.0%. This table shows the growth before and after revisions this year. Notice, spending was 1st reported down vs the prior month 5 times through June. After revisions spending is down only twice.

All values for the year are revised again in following May data report. The final revision has been UP 49 of the last 53 months. Average post-annual revision 2016 +2.2%; 2015 +4.3%; 2014 +4.4%. The average post-annual revision for the last 4 years is just over 3%.
Year-over-year and year-to-date comparisons of construction spending are generally understated by about 2% to 3% until the final revision of spending data is posted in May the following year.
Year-to-date construction spending through August is posted at $806 billion, up 4.7% from same period 2016. However, the post-annual revision has already been applied to all months in 2016. The same revision will not be applied to 2017 data until May 2018 data is published next year, so current YTD is always understated. Based on post-annual revisions for the last 4 years, adjustments range between +2% and +4%. The most recent six months has averaged +2.4%. So YTD 2017 spending will very likely increase and could be in the range of 6% to 8%.
Market Specific Revisions
Specific markets vary both higher and lower than the average revision. For example Power has been revised on average +10%, while Educational was revised less than 2%. Highway and Transportation revisions have averaged less than 1% over the last 18 months.
Construction Spending Revisions After 1st Release Through August Data:
Every month this year except April has been revised UP. The April data looks like such an anomaly (largest monthly decline since the recession) that I expect next May we will see April get revised up by +1% to +1.5%. July data gets revised next month and I expect to see an additional +1% to +1.5%.
- Total Construction UP 49 of last 53 months, avg 3.7%/mo.
- Total Construction UP 17 of last 19 months, avg 2.5%/mo.
- Residential revised UP 30 of last 31 months, avg 6.8%/mo.
- Residential UP 18 of 19 avg 3.6%/mo.
- Commercial UP 18 of 19 avg 5.7%
- Educational UP 13 of 19 avg 1.7%
- Power UP 19 of 19 avg 10.7%
- Commercial/Retail May +6.7%, June +3.8%, July +3.7%
- Lodging May +4.3%, June +0.2%, July +1.4%
- Educational May -0.7%, June +3.4%, July -1.8%
- Transportation May +3.5%, June +2.1%, July -1.8%
Spending Forecast
2017 construction spending is expected to reach $1,252 billion, up 5.6% from 2016. Average annual rate of spending will increase to $1,300 at year end. I wouldn’t be surprised to see future revisions to Mar-Apr-May spending smooth out that erratic period and add to total $ 2017.
In my forecast, I rely on the revision data by market to add a conservative adjustment for expected normal revisions.
My current Forecast has spending year-to-date through August up nearly 6% over 2016. Spending in the 2nd half 2017 will increase 1.5% to 2% over the 1st half 2017 and will increase more than 5% over the 2nd half 2016.
- All sectors have already hit spending lows for the year and will increase 4% to 8% over the next six months.
- Infrastructure will finish the year with totals down 2%, but the annual rate of spending could potentially increase 8% from July to year end. 2018 shows 11% growth.
- Nonresidential Buildings may finish up 5% in 2017, the sixth consecutive year of growth. For 2018 expect 8% growth.
- Residential spending will be up nearly 12% for 2017, the sixth year over 9%. Spending growth in 2018 slows to 2%.
- Backlog and the share of spending within the current year from that backlog is at an all-time high for nonresidential buildings and non-building infrastructure.
- Public work for 2017 will finish down 1.5%. By far the largest public spending declines are in Environmental Public Works, especially Sewer and Waste Disposal.
- Public spending is headed for a sizable rebound in 2018, up 9%.
- Every large Public category is forecast to show solid growth from the 4th qtr 2017 through all of 2018.
- This analysis does not include any spending projections from an infrastructure investment bill.
- Largest declines 2017; Manufacturing -11% ytd; Environmental Public Works -16% ytd.
- Largest increases 2017; Office +10% ytd; Commercial +16% ytd; Residential +13% ytd.

See this article Construction Starts and Spending Trends 2017-2018 for more on spending trends
Construction Starts and Spending Patterns
9-26-17
Construction Starts and Spending trends may not be apparent unless you look deep into the last few years of data.
Construction spending is strongly influenced by the pattern of continuing or ending cash flows from the previous two to three years of construction starts.
Current month/month, year/year or year-to-date trends in starts often do not indicate the immediate trend in spending.
Power market starts and spending provides a good example. Power starts peaked in 2015 at an all-time high, up 142% from 2014 and more than the prior two years combined. Yet Power spending was down 6% in 2015 and up only 3% in 2016. This happened because Power starts were also at an all-time high in 2012, just below the 2015 level, and those starts drove 2014 spending to an all-time high, but then tapered off in 2015. Those peak starts from 2015 will still be contributing spending for several years to come, long beyond typical jobs, and that drives up typical spending growth because it adds more than typical number of months that contribute spending.
Power starts dropped 11% in 2016 and continue to drop in 2017. Year-to-date and year over year comparisons to 2016 show Power starts down in all respects. For the 1st six months of 2017, Power starts are down four out of six months compared to same month in 2016 and year-to-date through June is down a total 20%.
Even though Power starts have been declining since the 2015 high point, Power had several periods with an exceptionally high value of new starts, some of these periods 2x to 3x the normal rate of growth and a year or two longer duration than typical; late 2014, Jan-May 2015, Feb-Jun 2016 and again in Feb-Jul 2017. When we have old, long duration jobs that are still contributing to monthly spending, spending goes up. A large share of the cash flow or monthly spending from all those exceptional starts will occur in 2018 and 2019. Those jobs will elevate Power spending 15% to 20% in 2018 and also in 2019.
- Pattern of cash flows from construction starts is indicating substantial acceleration in spending over next six months in all sectors, perhaps most notable in infrastructure.
- Infrastructure jobs from 2014 with longer than average duration will continue into 2018. These break the average balanced cycle of one month of old jobs ending for every new month of jobs starting. That will increase spending in 2018.
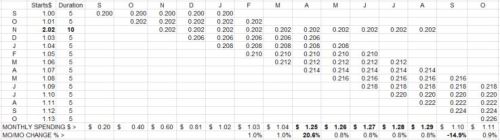
This simplified example shows what happens to monthly spending growth when a long duration job first influences spending past the typical duration and then when it ends. In the example here, starts grow at 1% per month and have a typical duration of 5 months. One month has an unusually large project start that will last for 10 months. A typical month of spending has cash flow from 5 months of starts, but the long duration project creates 6 months of cash flows for the period beyond typical duration.
Notice what happens and when it occurs. When the large project starts it has no unusual affect on spending. When it first extends beyond typical duration, it has a massive +20% growth effect on spending, even though starts had only been increasing at 1%/month for the previous 5 months. When it ends it has a similar downward effect, again, even though starts had been increasing at 1%/month.
Spending growth (or declines), both when an extra large job causes it to increase and then when the extra job ends, is almost entirely influenced by the long duration project, not by normal monthly starts growth rate.
2017 construction spending is expected to approach $1,250 billion, up 6% from 2016. Average annual rate of spending is going to increase 5% from $1,240 to $1,300 at year end. I wouldn’t be surprised to see future revisions to Mar-Apr-May spending smooth out that erratic period and add to total $ 2017.
- All sectors have already hit spending lows for the year and will increase 4% to 8% over the next six months.
- Infrastructure will finish the year with totals down 2% to 3%, but the annual rate of spending could potentially increase 8% from July to year end. 2018 shows 10% growth.
- Nonresidential Buildings are up 4% in 2017, the sixth consecutive year of growth. For 2018 expect 8% growth.
- Residential spending will be up more than 10% for 2017, the sixth year over 9%. Spending growth in 2018 slows to 5%.

2017 construction starts through August total $482 billion, down 1% compared to revised 2016. If 2017 gets revised as expected, even by only 4%, it will show +3% growth over 2016, but we won’t see that growth in the data until next year.
- Starts revisions for the period 2008-2015 averaged +5.8%/yr. For the period 2012-2015 revisions averaged +4.0%.
- The smallest revision to starts data since 2008 was +3.5%/yr. 2016 year-to-date through August revisions are +11%.
- Previous year starts are always revised upwards. Therefore, current year starts year-to-date growth is always understated.
- Starts have been increasing at an average rate of 11%/year for the last 5 years.
- After revisions, I expect 2017 will be the highest amount of new construction starts in 13 years.
Manufacturing spending was expected to fall in 2017 after peaking in 2015 from massive growth in new starts in 2014. However, a few months of exceptional 2015 starts will elevate 2018 spending and late 2016 starts will elevate 2019 spending.
Office spending, down slightly (temporarily) due to timing of completions from old jobs, is on track to reach 10% growth in 2017. Starts have been increasing since 2010 with the strongest growth period of new starts from Sept 2016 through June 2017. So, for the next 10 months we may see year/year comparisons negative, but that high volume of starts from Sept 2016 to June 2017 is going to elevate spending in 2018 and 2019.
Commercial spending early reports for June and July are both well below that predicted by starts cash flows and may be prone to substantial revisions. Commercial spending revisions have been up 17 of last 18 months an average of 6.0%/month. (10-2-17 Commercial spending was revised up by 4% for both June and July) Commercial starts have been increasing every year since 2010.
Educational has seen a slow but steady growth in new starts since 2012. Current dip in spending are not expected to continue. Cash flow from starts is indicating a steady climb in spending from now through the end of 2018.
Healthcare starts from 2015 are ending unevenly, rather than smoothly, causing temporary dips in spending. Growth resumes by Sept-Oct.
Transportation Terminal starts in the first three months of 2017 were more than three times higher than any three-month period in the previous five years. While this helped turn 2017 spending positive, 2017 is still affected by uneven starts from two to three years ago holding down gains in the 2nd half. Transportation will show only a 1% gain in 2017 but double digits gains in 2018. The high volume of 2017 starts has the most affect on 2019 spending.
Highway spending in 2018 will benefit from a scenario exactly as described above in the cash flow chart. Projects that started in 2015 but that have unusually long duration will contribute spending in 2018 beyond the duration that typical projects have ended. It is not recent new starts but old ongoing projects that will increase 2018 spending by 6%.
Public Works cash flow from starts has been indicating declines in spending since last summer. In fact, declines in public works spending (down 20% YTD in Sewage Waste Disposal) is the biggest drag on Infrastructure spending in 2017. However, now spending declines are expected to turn to growth in the 2nd half 2017 and continue growth through 2018.
(This analysis does not include any spending projections from an infrastructure investment bill).
See August Construction Spending 10-2-17 for more trends in spending.
See Starts Trends Construction Forecast Fall 2017 11-8-17 for updated trends in New Starts.
See Backlog Construction Forecast Fall 2017 11-5-17 for updated trend in Starting Backlog for 2018
Why Many Get Construction Spending Wrong
9-2-17
Construction spending for July was released yesterday, posted at $1.211 trillion, down 0.6% from an upwardly revised June. This is the sixth time in seven months of 2017 in which the initial release for monthly spending is down from the previous month. This is actually a very normal occurrence.
The 1st release of monthly spending vs the previous month has been down 15 times in the last 21 months. This may be what leads some analysts and pundits to write that construction spending is heading to recession. Nothing could be further from the truth!
For the last 21 months, in which 15 first reports showed a decline vs the previous month, 18 of the monthly values were revised up. After revisions, only five months remain down vs the previous month. Seven months are still pending further revisions, almost always up.
Construction spending is highly prone to revisions. After the 1st release it is revised each of the next two months and once again the following year. Spending has been revised UP 48 of the last 52 months, 92% of the time. The average upward revision for the last five years is +3.2%/month. In the last 52 months the upward revision averaged 3.7%.

Construction spending revisions after first release of data:
- Total Construction UP 48 of last 52 months, avg 3.7%/mo
- Total Construction UP 16 of last 18 months, avg 2.6%/mo
- Residential revised UP 29 of last 30 months, avg 7.0%/mo
- Residential UP 17 of 18 avg 3.8%/mo
- Commercial UP 17 of 18 avg 6.0%
- Educational UP 14 of 18 avg 2.2%
- Power UP 18 of 18 avg 12.0%
- Commercial/Retail May +3.9%, June +2.6%
- Lodging May +3.8%, June +1.1%
- Educational May +2.8%, June +3.6%
- Transportation May +3.6%, June +2.3%
January through May values have already been adjusted twice in these reports. June has one more revision next month and July gets revised twice. It’s quite likely both June and July values go up. All 2017 months still get one more revision next year when the May data is released (July 1). The post-annual total revision for the last 15 mo averages +2%, close to the long term average. First release values are ALWAYS being compared to previous values that have already been revised, 92% of the time UP. So first release values almost always understate performance. Since July 1st 2017, all 2016 monthly values have been revised three times so monthly releases this year starting with May have the most understated initial % comparison year-over-year because an un-adjusted release is being compared to a 3x-adjusted value.
When judging performance of monthly spending, it is reasonable to predict spending will get revised UP from the first release. Therefore, the most immediate monthly analysis you read, if based on initial release, 92% of the time is under-stating the performance of construction spending.
Construction spending forecasting not only must rely on performance year-to-date, but also on predictive analysis of how much revision there may be to current values. As an estimate, if monthly spending is initially posted as 2% down, 18/mo.averages indicate it will end up at least +2.6% higher after revisions, so would be a positive 0.6% growth month.
A few closing points:
Construction Spending 1st release for July is $1.211 trillion. Expect this to be revised up. YTD Jan-Jun revisions are UP 1.8%. Historical revisions last 5 years predict the final July value will be up 3% from the 1st release.
Construction Spending AVG 2017 Jan-Jul YTD ($1.226tr) has reached an all-time high. We’ve now posted three consecutive quarters of spending all averaging above $1.220 trillion. Spending is on track to total $1.250 trillion for 2017, up 5.5% over 2016.
Construction Spending avg YTD = $1.226tr, is up YTD 4.7% with revisions through May. Without revisions, the 1st releases would have averaged only $1.208tr, up only 3%.
Commercial Retail, Office and Residential lead 2017 construction spending gains, all over 10%. Office spending is at a record high.
After 5 months of stalled construction jobs growth, August added 28,000 jobs and put 2017 growth back on track towards 250,000 jobs. YTD is up 135,000. March thru July added only 19,000 construction jobs. Jan+Feb added 88,000, ending a six-month period, Sep16-Feb17, that added 167,000 jobs.
Harvey related jobs will be muted by jobs lost, I suspect for at least two months. There will be a period of slack records that will take some time to see the real effects of Harvey.
Further reading on this topic
June Construction Spending – What’s Up, or Down?

Jobs vs Construction Volume – Imbalances
8-8-17
From January 2001 to June 2017, jobs growth exceeded construction volume growth by 13%. The attached plots show the imbalances in growth.
Jobs growth is # of jobs x hours worked.
Volume is construction spending adjusted for inflation, or constant $.
Sometimes rapid spending growth is accompanied by higher than average inflation. This occurred in the 1990’s and again in 2005-2006. While spending seems to indicate rapid growth, much of the growth in cost is inflation and volume growth can be significantly lower, even sometimes negative, as occurred in 2005-2006. However, jobs growth during these rapid spending growth periods appears to track much more in line with spending growth. This leads to over-hiring and a loss of productivity occurs.
There are two distinct periods when jobs growth advanced more rapidly than real construction volume, 2005-2006 and mid-2015 to mid-2017. In the eight year period in between, either jobs fell faster or, after January 2011, volume increased faster. If spending growth is used to compare, then jobs growth falls far short of construction spending. But, due to inflation, spending is not the correct parameter to compare to jobs. Jobs must be compared to volume. Since 2001, the imbalance shows jobs growth has exceeded volume growth.
2001 through mid-year 2017, jobs exceeded volume growth by 13%.

2001-2004 jobs and volume growth were nearly equal.
2005-2006 jobs growth exceeded volume growth by 20%. During this period, construction spending and volume reached a peak. From late 2004 into early 2006, we experienced 20% growth in spending, the most rapid growth period on record. But that was also the period of the most rapid inflation growth on record. Residential volume peaked in early 2006 but then dropped 20% by the end of 2006. Nonresidential spending was increasing, but almost all of the growth was inflation. Nonresidential volume remained flat through 2006. Inflation was greater than spending growth, so volume declined. Although volume declined, hiring continued and jobs increased by 15%.
2007-2010 volume exceeded jobs growth by 4%. Spending decreased by 30%. Both volume and jobs were in steep decline. More jobs declined than volume, however, this period started with nearly 20% excess jobs. For January 2010 to January 2011, jobs bounced around near bottom, but volume dropped 8% more. 2010 ended with an excess of 15% jobs. January 2011 was the low-point for jobs.

2011-June 2015 volume exceeded jobs growth by 10%. Spending increased by almost 40% and inflation was relatively low at only 3%/yr. This period helped absorb more than half of the excess jobs that were created in 2005-2006 and remained after 2010. By mid-2015, jobs exceeded volume by only 7%.
June 2015-June 2017 jobs growth exceeded volume by 7%. Spending increased by 7%, but inflation was 7% over the same period. Although volume was up and down, over this two-year period through June 2017 we posted zero growth in volume. All of the increase in spending was inflation. Jobs increased 7% in two years.
For the last 5 years, 2012-2016, jobs averaged 4.5%/yr. growth Construction spending averaged 8.5%/yr. growth. Inflation, currently hovering around 4.5%, averaged about 3.5%/yr. during this period. So real volume growth was only 4% to 5%. In the first few years of the recovery, 2011-2014, the gap narrowed and volume improved over jobs, but for the last two years, jobs have been increasing faster than volume.
I do expect spending to continue at a 6% to 7% growth rate at least through 2018. But also, I expect inflation at 4% to 4.5%. If the spending forecast holds, and if jobs growth comes into balance, then that would indicate only a 2% to 3% jobs growth rate from now through 2018.
Also SEE Construction Jobs Growing Faster Than Volume 5-5-17
and Is There a Construction Jobs Shortage? 3-10-17
Here is the 11-7-17 extension of latest info Construction Jobs / Workload Balance
ARCHIVE – Construction Inflation Index Tables 2016 data
8-6-17 SEE ESCALATION / INFLATION INDICES For Current Updated Indices
10-24-16 original posted
1-27-17 updated index tables and plots
8-6-17 archived this for 1-27-17 2016 content – Linked Master Index Tables has updated data
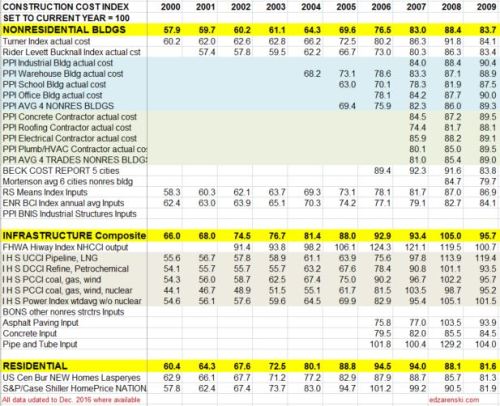
Construction Cost Indices come in many types: Final cost by specific building type; Final cost composite of buildings but still all within one major building sector; Final cost but across several major building sectors (ex., residential and nonresidential buildings); Input prices to subcontractors; Producer prices and Select market basket indices.
Residential, Nonresidential Buildings and Non-building Infrastructure Indices developed by Construction Analytics, (in BOLD CAPS), are sector specific selling price composite indices. These three indices represent whole building final cost and are plotted in Building Cost Index – Construction Inflation below and also plotted in the attached Midyear report link. They represent average or weighted average of what is considered the most representative cost indicators in each major building sector. For Non-building Infrastructure, however, in most instances it is better to use a specific index to the type of work.

Click Here for LINK to Cost Inflation Midyear Report 2016 – text on Current Inflation
All actual index values have been recorded from the source and then converted to current year 2016 = 100. That puts all the indices on the same baseline and measures everything to a recent point in time.
Not all indices cover all years. For instance the PPI nonresidential buildings indices only go back to years 2004-2007, the years in which they were created.
SEE Construction Inflation Index Tables For 2017 Tables
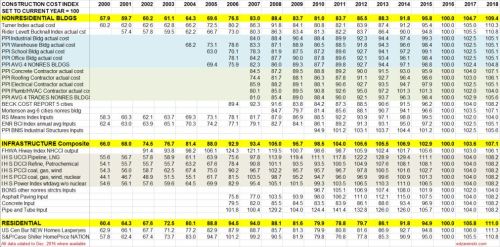
SEE BELOW FOR LARGER IMAGE
When construction is very actively growing, total construction costs typically increase more rapidly than the net cost of labor and materials. In active markets overhead and profit margins increase in response to increased demand. When construction activity is declining, construction cost increases slow or may even turn to negative, due to reductions in overhead and profit margins, even though labor and material costs may still be increasing.
Selling Price, by definition whole building actual final cost tracks the final cost of construction, which includes, in addition to costs of labor and materials and sales/use taxes, general contractor and sub-contractor overhead and profit. Selling price indices should be used to adjust project costs over time.
quoted from that article,

R S Means Index and ENR Building Cost Index (BCI) are examples of input indices. They do not measure the output price of the final cost of buildings. They measure the input prices paid by subcontractors for a fixed market basket of labor and materials used in constructing the building. These indices do not represent final cost so won’t be as accurate as selling price indices.
Turner Actual Cost Index nonresidential buildings only, final cost of building
Rider Levett Bucknall Actual Cost Index in RLB Publications nonresidential buildings only, final cost of building, selling price
IHS Power Plant Cost Indices specific infrastructure only, final cost indices
- IHS UCCI tracks construction of onshore, offshore, pipeline and LNG projects
- IHS DCCI tracks construction of refining and petrochemical construction projects
- IHS PCCI tracks construction of coal, gas, wind and nuclear power generation plants
Bureau of Labor Statistics Producer Price Index only specific PPI building indices reflect final cost of building. PPI cost of materials is price at producer level. The PPIs that constitute Table 9 measure changes in net selling prices for materials and supplies typically sold to the construction sector. Specific Building PPI Indices are Final Demand or Selling Price indices.
PPI Materials and Supply Inputs to Construction Industries
PPI Nonresidential Building Construction Sector — Contractors
PPI Nonresidential Building Types
PPI BONS Other Nonresidential Structures includes water and sewer lines and structures; oil and gas pipelines; power and communication lines and structures; highway, street, and bridge construction; and airport runway, dam, dock, tunnel, and flood control construction.
National Highway Construction Cost Index (NHCCI) final cost index, specific to highway and road work only.
S&P/Case-Shiller National Home Price Index history final cost as-sold index but includes sale of both new and existing homes, so is an indicator of price movement but should not be used solely to adjust cost of new residential construction
US Census Constant Quality (Laspeyres) Price Index SF Houses Under Construction final cost index, this index adjusts to hold the build component quality and size of a new home constant from year to year to give a more accurate comparison of real cost inflation
Beck Biannual Cost Report develops indices for only five major cities and average. The indices may be a composite of residential and nonresidential buildings. It can be used as an indicator of the direction of cost but should not be used to adjust the cost in either of these two sectors.
Mortenson Cost Index is the estimated cost of a representative nonresidential building priced in six major cities and average.
Other Indices not included here:
Consumer Price Index (CPI) issued by U.S. Gov. Bureau of Labor Statistics. Monthly data on changes in the prices paid by urban consumers for a representative basket of goods and services, including food, transportation, medical care, apparel, recreation, housing. This index in not related at all to construction and should never be used to adjust construction pricing.
Leland Saylor Cost Index Clear definition of this index could not be found, however detailed input appears to represent buildings and does reference subcontractor pricing. But it could not be determined if this is a selling price index.
Sierra West Construction Cost Index is identified as a selling price index but may be specific to California. This index may be a composite of several sectors. No online source of the index could be found, but it is published in Engineering News Record magazine in the quarterly cost report update.
Vermeulens Construction Cost Index can be found here. It is described as a bid price index, which is a selling price index, for Institutional/Commercial/Industrial projects. That would be a nonresidential buildings sector index. No data table is available, but a plot of the VCCI is available on the website. Some interpolation would be required to capture precise annual values from the plot. The site provides good information.
The Bureau of Reclamation Construction Cost Trends comprehensive indexes for about 30 different types of infrastructure work including dams, pipelines, transmission lines, tunnels, roads and bridges. 1984 to present.
Click Here for Link to Construction Cost Inflation – Midyear Report 2016
1-27-17 – Index updated to Dec. 2016 data

8-6-17 SEE Construction Inflation Index Tables For Updated 2017 Indices