So, I thought I’d clarify a few things. In a recent Oct’26 interview Kevin Hassett said: “We’re building factories like nobody’s business. We’ve got 113k…
There were no construction briefs posted on June or July. Construction Jobs vs Construction Spending.Jobs growth has been ahead of business volume growth for more…
Why the big slow down in construction jobs this Year? Is work volume on the decline? Are labor shortages to blame?
These days, the most talked about reason for slower jobs growth is the lack of experienced workers available to hire. In fact, recent surveys indicate about 70% of construction firms report difficulty finding experienced workers to fill vacant positions and the Job Openings survey has been at highs for several months. That certainly cannot be overlooked as one reason for slower jobs growth, but that is not the only reason?
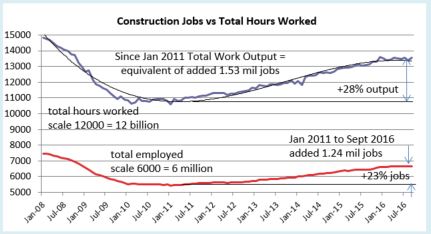
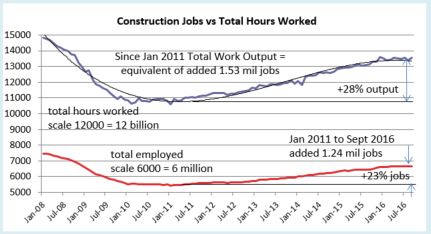
Although recent growth has slowed, even with all this talk of difficulty finding experienced construction workers, there has been very good jobs growth. For the 5 ½ year period from the low point in January 2011 to the present (August 2016) we added 1,240,000 construction jobs.
Jobs increased by 23% in 5 ½ years.
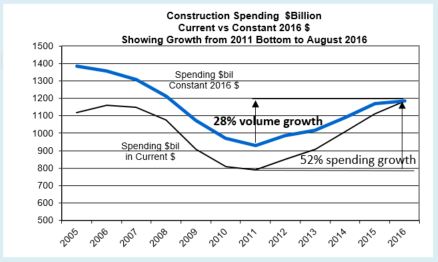
Spending growth increased 52% in that same 5 1/2 years.
Why is it that jobs don’t increase at the same rate as construction spending? Because much of that spending growth is inflation, not true volume growth. Volume is construction spending minus inflation. To get volume, convert all dollars from current $ in the year spent into constant $ by factoring out inflation.
Spending growth is not a true measure of increase in real volume.
Jobs growth should not be compared to spending growth.
Now that we have spending converted to volume, we need to adjust jobs to get real work output. The total hours worked affects the entire workforce so has a significant impact on output.
Jobs is not a true measure of work output.
Jobs x hours worked gives total work output.
Spending must be factored to remove inflation and jobs should be factored to include any change in hours worked.
In the 5 1/2 years from Jan 2011 to mid 2016, real construction volume and jobs/hours real output both increased by 28%.
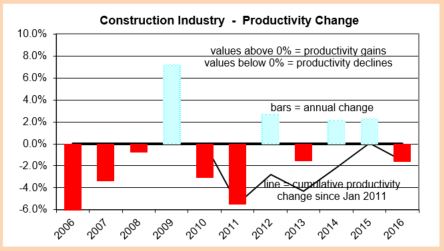
Now we see over the long term, job/hours and real volume are moving in tandem. But there are always short term periods when they do not and that causes ups and downs in productivity.
In 2014-2015, jobs/hours grew by 11%, the fastest growth for a two-year span in 10 years. Real volume of work increased by 16% producing a real net increase in productivity. But productivity had declined significantly in 2010 and 2011. It’s not unusual to see productivity balancing out over time. In part, this is due to companies balancing their total employees with their total workload.
From October 2015 through March 2016, jobs growth was exceptional. 214,000 construction jobs were added in 6 months, topping off the fastest 2 years of jobs growth in 10 years. That is the highest 6-month average growth rate in 10 years. That certainly doesn’t make it seem like there is a labor shortage. However, the jobs opening rate (JOLTS) is the highest it’s been in many years and that is a signal of difficulty in filling open positions.
For the 6-month period including Oct’15 thru Mar’16 construction gained 214,000 jobs, the fastest rate of consecutive months jobs growth in 10 years. Then, after 3 months of job losses, July, September and October show modest gains.
I would expect growth such as we’ve had for two years and then that 6 month period to be followed by a slowdown in hiring as firms try to reach a jobs/workload balance. It appears we may have experienced that slowdown. Jobs declined for four of five months from April through August. Keep in mind, this immediately follows the fastest rate of jobs growth in 10 years. But it also tracks directly to three monthly declines in spending. (I predicted this jobs slowdown in my data 9 months ago. I predicted the 1st half 2016 spending decline more than a year ago).
It is not so unusual to see jobs growth slowed for several months. It follows directly with the Q2 trend in spending and it follows what might be considered a saturation period in jobs growth. The last two years of jobs growth was the best two-year period in 10 years. It might also be indicating that after a robust 6 month hiring period there are far fewer skilled workers still available for hire. The unemployed available for hire is the lowest in 16 years.
If spending plays out as expected into year end 2016, then construction jobs may begin to grow faster in late 2016. However, availability could have a significant impact on this needed growth.
Availability already seems to be having an effect on wages. Construction wages are up 2.6% year/year, but are up 1.2% in the last quarter, so the rate of wage growth has recently accelerated. The most recent JOLTS report shows we’ve been near and now above 200,000 job openings for months. With this latest jobs report, that could indicate labor cost will continue to rise rapidly.
As wages accelerate, also important is work scheduling capacity which is affected by the number of workers on hand to get the job done. Inability to secure sufficient workforce could impact project duration and cost and adds to risk, all inflationary. That could potentially impose a limit on spending growth. It will definitely have an upward effect on construction inflation this year. If work volume accelerates, expect labor cost inflation to rise rapidly.
I publish a lot of analysis for various construction data. I also read many other articles posted by other pundits in the industry, including MSM news sources. What I would say regarding construction data is this; an informed knowledge of construction data and how it’s used helps you understand if some article you are reading is accurate or relevant.
What I try to do here is not only report on the latest significant construction data, but also explain how the data must be used to make accurate and valuable analysis.
Here’s just three examples of how news analysts get it wrong:
> Post new construction starts as if those numbers represent construction spending.
A new start this month worth $10 billion adds a huge amount to the starts this month and will most certainly drive up the mo/mo and yr/yr starts numbers. But that new project could take 24 or 36 or 48 months to complete, so we can’t discern the impact on spending until we cash flow the value of the project which gives us the spending over its complete life span. In any given month the total amount of all spending is the summation of the spending this month from all the projects still ongoing that have started in previous months. Spending next month is 95% dependent on the flow of projects that started over the last 24 or 36 months.
> Suggest that two to three months of declines in spending indicates a downturn.
One of the biggest factors that determines spending this month is the values contributed this month from all the previous starts not yet completed. In a sector such as nonresidential buildings, in which the average duration of a project might be 24 months, the amount of spending this month gets some contribution from projects that started in each of the previous 24 months. One of the greatest influences on spending in any given month is the fluctuation (which could have occurred many months ago) in the amount of starts. So sometimes when we see a monthly spending dip it has nothing to do with a current declining trend in overall spending, but might have more to do with erratic new starts up to 18-24 months ago.
Starts can be quite erratic. Although we might see annual starts climbing at a modest rate of 6% or 7% per year, within that year we might see starts increase or decline by 50% or 100% from month to month. This is normal. But what it does to spending, particularly when a very large volume of project spending (from some month in the past that had huge new starts) finishes and drops out of the current spending, it causes dramatic fluctuations from month to month. Much of what we see in month to month changes in spending was predetermined months ago by the pattern of starts.
Normal rates of new starts, if always constant in growth rate, would create a constant rate of growth in spending. Erratic rates of change in starts create erratic changes in spending when those projects come to an end.
> Compare current $ this year to any $ from years past, without taking inflation into consideration.
I recently read an article that claimed construction was back to pre-recession levels. What really was being identified in that article was that current 2016$ were back to the level of current 2006$. That’s like saying $100 today buys you the same products that $100 bought you in 2006. I bet it wouldn’t be too hard to find a few examples where that would not be true.
Comparisons of dollars over time almost always need to be made using constant dollars, that is, adjusted for inflation and all converted to the same point in time, usually today. Sure spending today is up more than 50% off the bottom and in current dollars is higher than the previous peak in 2006. But if we adjusted those 2006$ for inflation the dollars spent in 2006 would be worth much more today. Although current dollars are now higher than any time in the past, after adjusting for inflation we are still 18% below peak spending.
September data for construction put-in-place was released today. Year-to-date (YTD) spending is up 4.4% over last year. With September first data release at $1,150 bil SAAR, this seems to establish that we’ve clearly passed a forecast dip in spending that bottomed in April and May. We’ve now had 4 months of spending up from the previous quarter and all up from the same respective months in 2015.
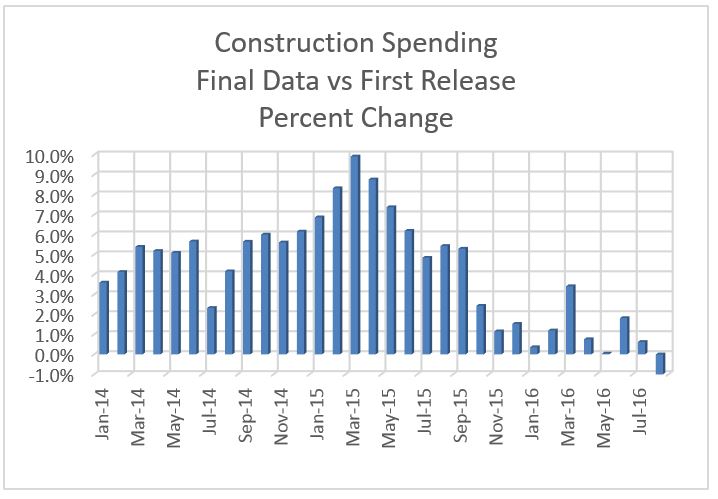
One thing that stands out in the data; so far every month in 2016 construction spending has been revised upwards after the first data release, by an average of +1.2%. Checking back to Jan 2014, all but once spending was revised up after the first number released.
For the 1st eight months of 2016, six of eight times the first comparison of spending showed a decline this month vs previous month. After revisions, the final values show only one month/month comparison was down.
June data which appeared quite low at first has now been revised up by +1.8% (+$21bil saar), with most of the June revision in nonresidential buildings. Most of the July revision was to residential spending. The last three months of construction spending on average have been revised up by +1.5% each.
So, even though the first print shows September down -0.4% from August, historical data would indicate we could expect September to get revised up, perhaps by 1%+ which would result in September finishing higher than June, July or August. Of course, there is always the chance it might get very little increase, and August could still get revised.
Residential spending is up 5.7% ytd and is on track to finish 2016 at $470bil, +6.6% over 2015. Last year, peak spending was in September, then residential spending dropped slightly in Q4 2015. This year I expect 2016 spending to peak in Q4, so we should see ytd performance get better as we approach year end. Cash flow from new starts indicate growth of 9% in 2017 spending.
Total Nonresidential spending is up 3.6% ytd, on track to finish 2016 at $700 bil, up 4.2% over 2015. Almost all the 2016 growth is in nonresidential buildings, not infrastructure.
For the 3rd quarter 2016, compared to the same quarter in 2015, nonresidential spending is up only 1%, but the spending patterns are not apparent unless we separate nonresidential buildings from non-building infrastructure.
For the 3rd quarter 2016, compared to a year ago, nonresidential buildings spending is up 7% and non-building infrastructure is down 6%.
Nonresidential Buildings spending is up 8% ytd through September, led by Office, Lodging and Commercial Retail markets. We should finish 2016 up 8% with a total at $410 billion vs. $379 billion in 2015. Total sector growth for the last three years is 35%. I’m predicting 2017 spending for Nonresidential Buildings will increase 8%, led by Educational and Office spending.
The market share percent of total nonresidential buildings for each market is:
educ=22%, mnfg=19%, comm=18%, offc=17%, hlthcr=10%, lodg=7% and amus/rec=5%.
Office construction spending 2016 growth will be 20%+, now greater than 20%/yr for three consecutive years. At 17% market share, by far it is the largest contributor to nonresidential buildings spending growth in 2016, contributing +3.7% growth.
Lodging is expected to finish 2016 up 26% and has averaged greater than 25%/yr growth for four years. But lodging has only 7% market share, so contributes only +1.8% growth to nonresidential buildings.
Commercial Retail is up 9% with 18% market share and so contributes +1.6% to overall nonresidential buildings growth. For the three-year period 2012 to 2014, commercial averaged 14% growth.
Educational spending, up 5% at 22% of the market, contributes +1.1% to overall nonresidential buildings growth in 2016. Educational spending should finish 2016 up 6%.
Manufacturing buildings present a unique situation in 2016. Manufacturing is down -2.4% ytd. At 19% market share, that reduces total nonresidential buildings growth by -0.5%. On the surface, manufacturing is lowering total nonresidential buildings growth. Although manufacturing spending is down, it’s still very high, so it’s impact should not be viewed as negative to the overall sector. Spending increased 50%+ in 2014 & 2015. Spending in 2016 will still be the 2nd highest year on record, down only slightly from 2015 but still more than 30% higher than 2014 and more than 50% higher than 2013.
Educational spending is 80% public and 20% private. In public markets educational is only up 4% ytd, but in private markets it’s up 10%. Private spending is driving total educational to $89 billion for 2016, up 6% from 2015. 2016 will be the best year since 2008. 2017 may reach 7% to 8% growth.
60% of all public work is infrastructure. Education accounts for 25% of public work. Educational is by far the largest building type in public work. All the remaining building types contribute only 2% to 4% each.
We are currently at what I expect could be the 2016 nonres bldgs spending peak, with very little gains across Jul-Aug-Sep-Oct. Nonres bldgs spending may flatten or drop for several months before resuming the climb. This drop may be in large part due to uneven starts from the end of 2014 and beginning of 2015, a period when starts were abnormally high, that are now finishing and dropping out of the monthly spending values. Usual normal growth patterns do not fill the void left when abnormally high volume of projects finish.
Nonbuilding Infrastructure spending is down 1% ytd. Cash flows from starts predicted this drop. The biggest negative drivers are Transportation, Sewage/Waste Disposal and Water Supply, each contributing more than 0.5% to the total decline. Power, the largest infrastructure market at 33% of total, is up 4% ytd so adds +1.33% to growth, tempering some of the declines. Spending in 2016 will reach $292 billion, down less than 1% from 2015. Growth resumes in Q1 2017.Although new starts in 2016 will finish down 10%, starts in 2015 were so high that 2016 will still be a good volume of new starts. Cash flows from all existing starts are predicting 2017 will be a record year for spending on infrastructure, up more than 6% from 2016.
My forecast for total spending in 2016 is $1,170 billion, up 5% from 2015. I expect 8% growth in 2017.
Can the construction industry even accommodate adding $1 trillion of new infrastructure spending over 10 years?
It takes about 5000-6000 new jobs to support $1 billion of new construction work for a year. For infrastructure the number is lower. So $100 billion per year continuous for next 10 years would support about 400,000 new jobs for 10 years. Well, that’s not how it will happen, so let’s look a little closer.
Historically the fastest rate of growth in spending takes about 3 years to increase 50%. That is for selected markets, never for the entire industry.
Infrastructure spending grew 50% in 4 years from 2004 to 2008, when that sector was half the size what it is today.
Infrastructure, about 25% of total construction spending, added spending more than $25 billion in a single year only once. The average annual growth for the past 20 years is less than $10 billion/year.
Historical growth in jobs rarely exceeds 300,000 new jobs per year. It has never averaged that rate of growth for more than a 3 year stretch. That is for the entire industry.
Spending after inflation (real volume growth) for all construction increased an average of $50 billion per year for the last 4 years. The same is expected in 2017.
Jobs increased an average of 250,000 per year for the last 4 years.
We could expect approximately the same growth in volume and jobs in 2018.
So here’s what we know. The entire construction industry has been growing on average at about $50 billion in volume and 250,000 jobs every year in recent data. Even with the addition of a new influx of infrastructure work, most of that other growth is not going to go away. But how much growth can the entire industry accommodate without bursting at the seams. Let’s make some broad assumptions to see what happens.
Let’s assume for the next 10 years the normal rate of new construction growth gets cut in half. In reality it probably wouldn’t, but we need to push some numbers to extremes to see what happens. So normal new volume, not including any boost from new federal infrastructure spending, might only grow at $25 billion per year and that would absorb 100,000-125,000 new jobs per year. That accounts for HALF of the entire industry volume growth and jobs growth. How much room does that leave for new growth or expansion in industry growth rates?
If we fill the difference with work from added new infrastructure spending, we can add $25 billion per year in new infrastructure spending and that will add about 100,000 new jobs per year. To account for how the work might be contracted out, let’s just assume in the first year we commit to $250 billion in contracts that are spread over 10 years to get to $25 billion a year in spending. In the 2nd, 3rd and 4th years we could also commit each time to another $250 billion in 10 year contracts that spread the spending out to $25 billion per year for 10 years.
By year 4, we’ve added $100 billion per year in new spending that will stretch out for the next 6 to 10 years ( note: this pushes spending $1 trillion out to 13 years). This spread of money over time, or cash flow, results in increased spending in the government infrastructure markets by 50% in 4 years, matching the best ever industry growth rates. We’ve increased jobs by 100,000 per year for 4 years to a total of 400,000 new jobs and they will all have funds to continue work for the next 6 to 10 years. All that just due to added infrastructure spending.
But let’s not forget the rest of the industry. This would push total spending growth and total industry jobs growth to the highest rates of growth on record. So this is a scenario that is unlikely to be achieved, and it’s not very likely that growth like that could be sustained for very long. It’s also not likely the rest of all the new growth in the industry is going to get cut in half to leave room for new added infrastructure work. So, it’s possible total growth over the next 4 years would be less than anticipated here. This allows for no downturn at any time in the next 10 years.
It begins to seem like it might be pretty difficult to add $1 trillion in spending to the infrastructure construction sector, which is only 1/4 of the entire industry, to be spent in the next 10 years.
When sometimes we push numbers to extremes just to see what happens, we get an unexpected picture of what might, or might not, be possible.
This post is preserved for the multitude of LINKS back to sources of cost indices and for the explanation of the difference between Input indices and Output or Final Cost Indices. For all latest indices plots and table see the latest yearly Inflation post.
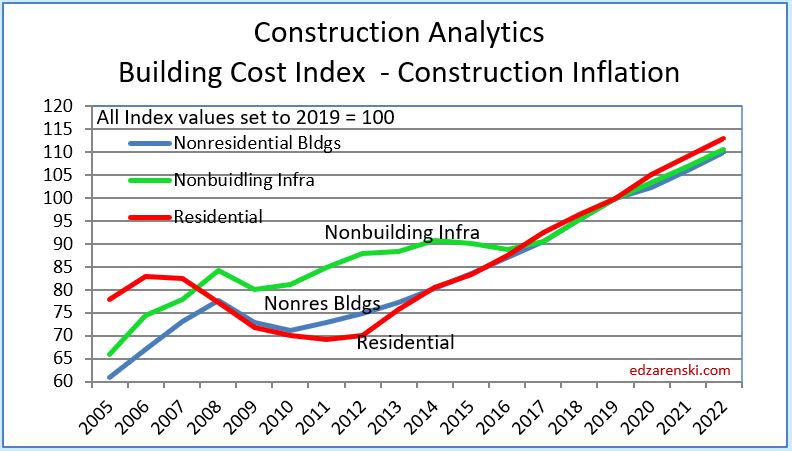
Construction Cost Indices come in many types: Final cost by specific building type; Final cost composite of buildings but still all within one major building sector; Final cost but across several major building sectors (ex., residential and nonresidential buildings); Input prices to subcontractors; Producer prices and Select market basket indices.
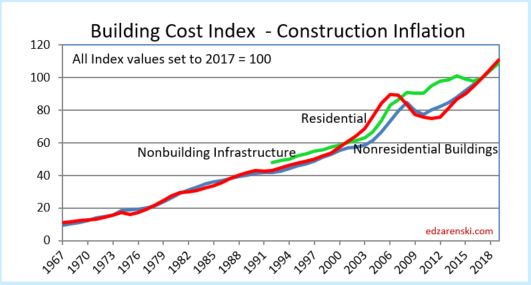
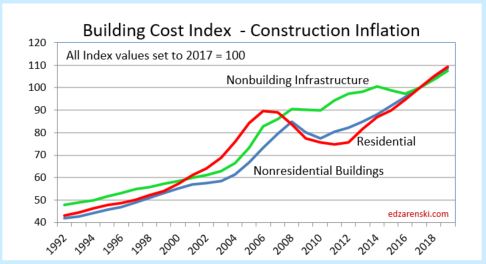
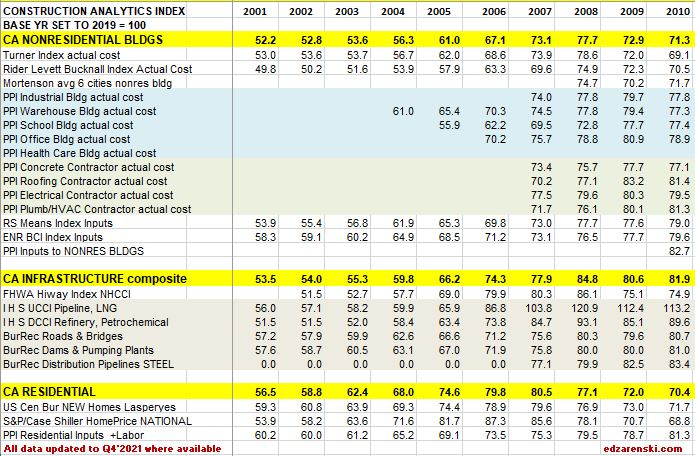
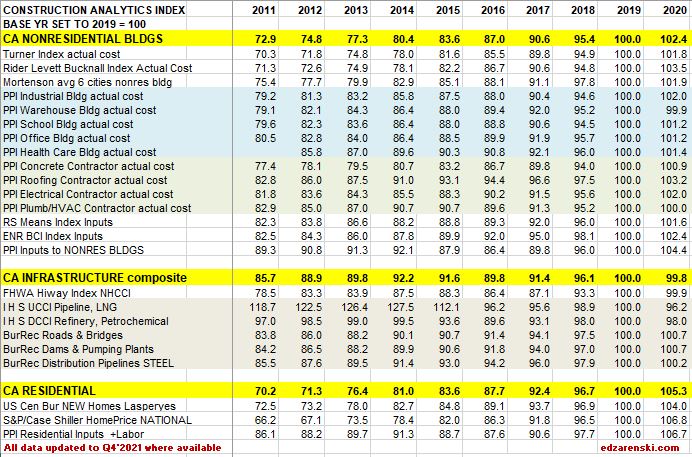
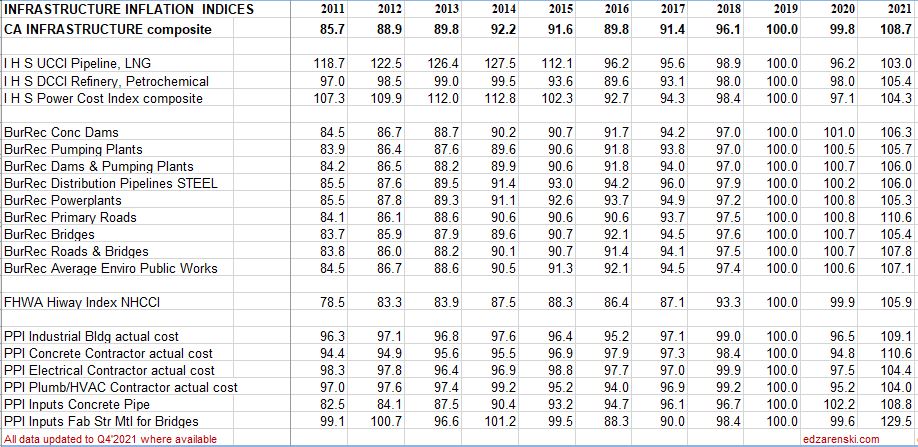
Residential, Nonresidential Buildings and Non-building Infrastructure Indices developed by Construction Analytics, (in highlighted BOLD CAPS in the tables below), are sector specific selling price (final cost) composite indices. These three indices represent whole building final cost and are plotted in Building Cost Index – Construction Inflation, see below, and also plotted in the attached Midyear report link. They represent average or weighted average of what is considered the most representative cost indicators in each major building sector. For Non-building Infrastructure, however, in most instances it is better to use a specific index to the type of work.
The following plots of Construction Analytics Building Cost Index are all the same data. Different time spans are presented for ease of use.
All actual index values have been recorded from the source and then converted to current year 2017 = 100. That puts all the indices on the same baseline and measures everything to a recent point in time, Midyear 2017.
All forward forecast values wherever not available are estimated and added by me.
Not all indices cover all years. For instance the PPI nonresidential buildings indices only go back to years 2004-2007, the years in which they were created. In most cases data is updated to include June 2019.
June 2017 data had significant changes in both PPI data and I H S data.
December 2017 data had dramatic changes in FHWA HiWay data.
SEE BELOW FOR TABLES
When construction is very actively growing, total construction costs typically increase more rapidly than the net cost of labor and materials. In active markets overhead and profit margins increase in response to increased demand. When construction activity is declining, construction cost increases slow or may even turn to negative, due to reductions in overhead and profit margins, even though labor and material costs may still be increasing.
Selling Price, by definition whole building actual final cost, tracks the final cost of construction, which includes, in addition to costs of labor and materials and sales/use taxes, general contractor and sub-contractor overhead and profit. Selling price indices should be used to adjust project costs over time.
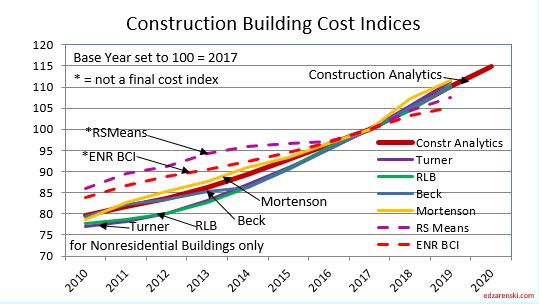
R S Means Index and ENR Building Cost Index (BCI) are examples of input indices. They do not measure the output price of the final cost of buildings. They measure the input prices paid by subcontractors for a fixed market basket of labor and materials used in constructing the building. ENR does not differentiate residential from nonresidential, however the index includes a quantity of steel so leans much more towards nonresidential buildings. RS Means is specifically nonresidential buildings only. These indices do not represent final cost so won’t be as accurate as selling price indices. RSMeans Cost Index Page RS Means subscription service provides historical cost indices for about 200 US and 10 Canadian cities. RSMeans 1960-2018 CANADA Keep in mind, neither of these indices include markup for competitive conditions. FYI, the RS Means Building Construction Cost Manual is an excellent resource to compare cost of construction between any two of hundreds of cities using location indices.
Notice in this plot how index growth is much less for ENR and RSMeans than for all other selling price final cost indices.
8-10-19 note: this 2010-2020 plot has been revised to include 2018-2020 update.
Sorry. Some links no longer active, mostly when source changes address to data or discontinues data.
Rider Levett Bucknall Actual Cost Index published in the Quarterly Cost Reports for nonresidential buildings only, represents final cost of building, selling price. Report includes cost index for 12 US cities and cost $/SF for various building types in those cities. Boston, Chicago, Denver, Honolulu, Las Vegas, Los Angeles, New York, Phoenix, Portland, San Francisco, Seattle, Washington,DC. Also includes cost index for Calgary and Toronto. RLB also publishes cost information for select cities/countries around the world, accessed through RLB Publications.
Mortenson Cost Indexis the estimated cost of a representative nonresidential building priced in seven major cities and average. Chicago, Milwaukee, Seattle, Phoenix, Denver, Portland and Minneapolis/St. Paul.
Beck Biannual Cost Report in 2017 and earlier cost reports developed indices for six major U.S. cities and Mexico, plus average. In the most recent Summer 2021 report, while Beck provides valuable information on cost ranges for 30 different types of projects, the former inflation index is absent. Beck has not published city index values since 2017. Read the report for the trend in building costs. See discussion for Atlanta, Austin, Charlotte, Dallas/Fort Worth, Denver, Tampa and Mexico
Bureau of Labor Statistics Producer Price Index only specific PPI building indices reflect final cost of building. PPI cost of materials is price at producer level. The PPIs that constitute Table 9 measure changes in net selling prices for materials and supplies typically sold to the construction sector. Specific Building PPI Indices are Final Demand or Selling Price indices.
PPI BONS Other Nonresidential Structures includes water and sewer lines and structures; oil and gas pipelines; power and communication lines and structures; highway, street, and bridge construction; and airport runway, dam, dock, tunnel, and flood control construction.
The Bureau of Reclamation Construction Cost Trends comprehensive indexes for about 30 different types of infrastructure work including dams, pipelines, transmission lines, tunnels, roads and bridges. 1984 to present.
IHS UCCI tracks construction of onshore, offshore, pipeline and LNG projects
IHS DCCI tracks construction of refining and petrochemical construction projects
IHS PCCI tracks construction of coal, gas, wind and nuclear power generation plants
S&P/Case-Shiller National Home Price Index history final cost as-sold index but includes sale of both new and existing homes, so is an indicator of price movement but should not be used solely to adjust cost of new residential construction
TBDconsultants San Francisco Bay Area total bid index (final cost).
Other Indices not included here:
CoreLogic Home Price Index HPI for single-family detached or attached homes monthly 1976-2019. This is a new home and existing home sales price index.
Consumer Price Index (CPI) issued by U.S. Gov. Bureau of Labor Statistics. Monthly data on changes in the prices paid by urban consumers for a representative basket of goods and services, including food, transportation, medical care, apparel, recreation, housing. This index in not related at all to construction and should not be used to adjust construction pricing.
Jones Lang LaSalle Construction Outlook Report National Construction Cost Index is the Engineering News Record Building Cost Index (ENRBCI), a previously discussed inputs index. The report provides some useful commentary.
Sierra West Construction Cost Index is identified as a selling price index with input from 16-20 U.S. cities, however it states, “The Sierra West CCCI plays a major role in planning future construction projects throughout California.” This index may be a composite of several sectors. The link provided points to the description of the index, but not the index itself. No online source of the index could be found, but it is published in Engineering News Record magazine in the quarterly cost report update.
Leland Saylor Cost Index Clear definition of this index could not be found, however detailed input appears to represent buildings and does reference subcontractor pricing. But it could not be determined if this is a selling price index. A review of website info indicates almost all the work is performed in California, so this index may be regional to that area. Updated Index Page
DGS California Construction Cost Index CCCI The California Department of General Services CCCI is developed directly from ENR BCI. The index is the average of the ENR BCI for Los Angeles and San Francisco, so serves neither region accurately. Based on a narrow market basket of goods and limited labor used in construction of nonresidential buildings, and based in part on national average pricing, it is an incomplete inputs index, not a final cost index.
Vermeulens Construction Cost Indexcan be found here. It is described as a bid price index, which is a selling price index, for Institutional/Commercial/Industrial projects. That would be a nonresidential buildings sector index. No data table is available, but a plot of the VCCI is available on the website. Some interpolation would be required to capture precise annual values from the plot. The site provides good information.
CALTRANS Highway Cost Index Trade bids for various components of work and materials, published by California Dept of Transportation including earthwork, paving and structural concrete. Includes Highway Index back to 1972, quarterly from 2012.
Colorado DOT Construction Cost Index 2002-2019 Trade bids for various components of work published by Colorado Dept of Transportation including earthwork, paving and structural concrete.
2-12-18 – Index update includes revisions to historic Infrastructure data
1-26-21 The tables below, from 2011 to 2020 and from 2015 thru 2023, updates 2020 data and provides 2021-2023 forecast.
NOTE, these tables are based on 2019=100. Nonresidential inflation, after hitting 5% in both 2018 and 2019, and after holding above 4% for the six years 2014-2019, is forecast to increase only 2.5% in 2020, but then 3.8% in 2021 and hold near that level the next few years. Forecast residential inflation for the next three years is level at 3.8%. It was only 3.6% for 2019 but averaged 5.5%/yr since 2013 and returned to 5.1% in 2020.
11-10-21 Follow the link at the bottom to 2021 Inflation
The Tables below 2001 to 2010 and 2011-2020 are updated to Q4 2021 with any revisions to past years posted on source websites.
The Table below 2015 to 2023 is updated to Q4 2021
How to use an index: Indexes are used to adjust costs over time for the affects of inflation. To move cost from some point in time to some other point in time, divide Index for year you want to move to by Index for year you want to move cost from. Example : What is cost inflation for a building with a midpoint in 2022, for a similar nonresidential building whose midpoint of construction was 2016? Divide Index for 2022 by index for 2016 = 110.4/87.0 = 1.27. Cost of building with midpoint in 2016 x 1.27 = cost of same building with midpoint in 2022. Costs should be moved from/to midpoint of construction. Indices posted here are at middle of year and can be interpolated between to get any other point in time.
All forward forecast values, whenever not available, are estimated by Construction Analytics.
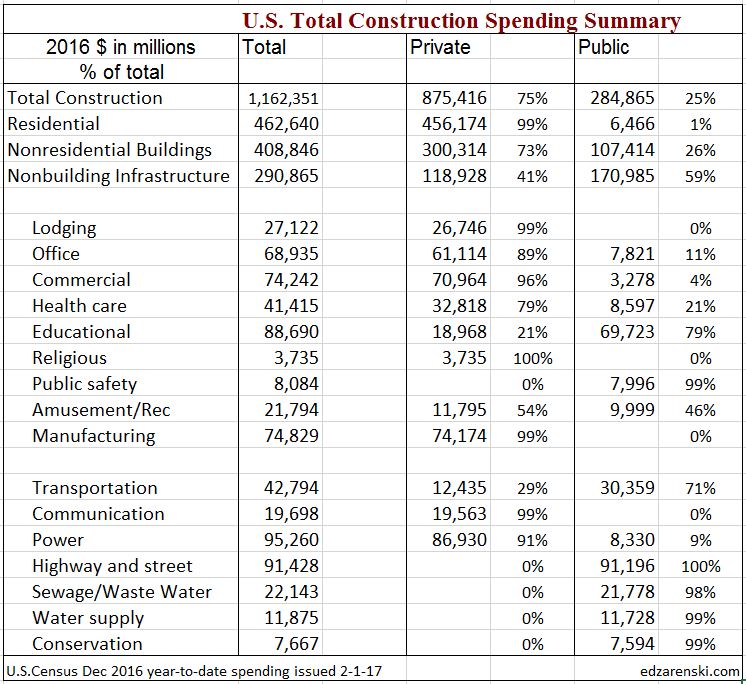
updated 2-16-17 edited to include 2016 year-end total$ public vs private
The two largest components of Public Construction Spending, by far, are Highway/Bridge/Street and Educational Buildings. These two markets have more impact on the magnitude of public spending than any other markets. All of Highway ($90bil) is public spending. About 80% ($70bil out of $88bil) of Educational buildings is public spending. Together they add up to 55% of all public construction spending.
The next three largest public markets in order are: 70% of Transportation ($30/$42bil); all of Sewage/Wastewater ($22bil) and all of Water Supply ($12bil). These three markets account for only about 22% of public spending. Eight remaining markets, none larger than 3.5% of the total public sector, combined make up ~20% of total public spending. Five of those eight, Office, Health care, Public Safety, Amusement and Power, each account for $8 to $10bil and each is 3% to 3.5% of Public work.
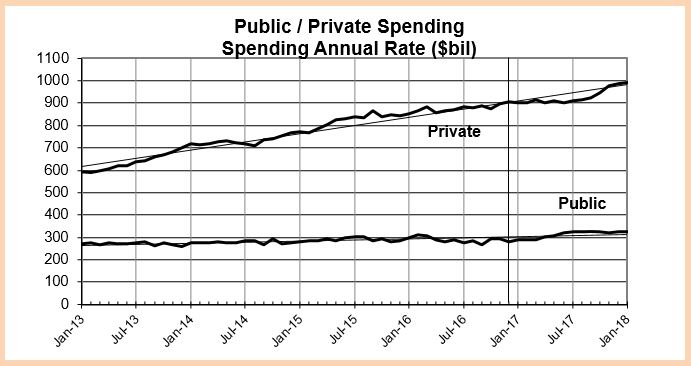
Public Construction Spending average for the first six months of 2016 was the highest since 2010 and is up 10% from the Q4’13-Q1’14 low point.
Public spending finished 2016 down 0.8% from 2015, but that is down from a near six-year high, so spending is still strong. It is still -9% below its 2009 peak.
The biggest mover to total public spending this year is educational spending. Public educational spending in 2016 is up 4.7%. Because it represents 25% of all public spending, it has a net impact of moving total public spending up +1.2%, greater impact than any other market.
Public commercial spending is up 24% but has only a 1% market share of public work so moves public spending by only +0.24%. Power is down -20% but at a share of only 3% moves public spending by only -0.6%. Public components of office, public safety, sewage/waste disposal and water supply are all down by a combined -7%. At a combined market share of 18% that nets a -1.26% reduction in total public spending.
Public spending peaked in 2009 when Educational buildings spending was at its highest. Highway spending has been at or near its peak for the last 16 months but that, with current educational spending, which is still more than 20% below its peak, has not been enough to carry public spending to new highs.
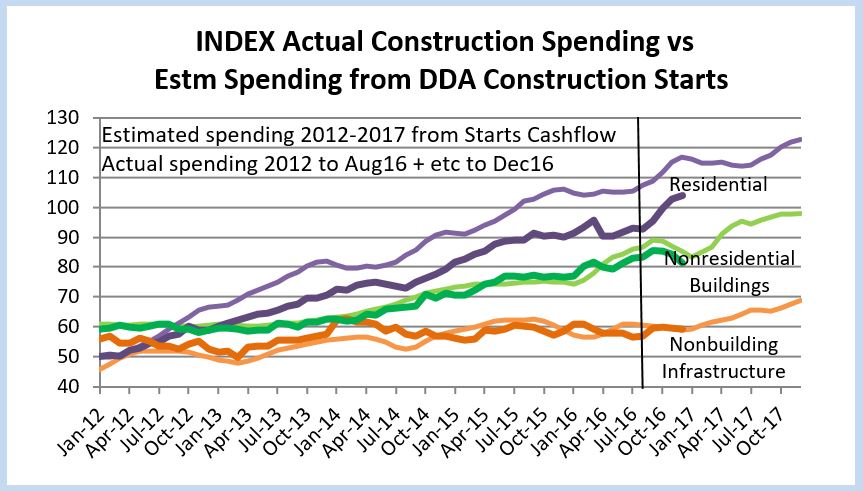
Expected spending predicted from new construction starts gives a much better picture for 2017.
Highway/Bridge/Street starts in 2015 finished just shy of a 6-year high (in 2013) but 2016 was down 13% from 2015. On average 2015+2016 starts are still 5% higher than 2014. Highway projects are long duration, so very good starts from the end of 2014 and the beginning of 2015 will still contribute strong spending well into 2017. Highway spending is expected to finish up slightly over 2016.
Educational new starts in 2016 finished the year up 11%, posting a 4th consecutive annual increase and educational spending for 2017 should finish up 10%.
Transportation spending in 2017 should increase 6%.
Overall, total public construction spending in 2017 is predicted to grow by 8% to 9%, the first substantial growth since 2007, reaching new highs in the 2nd half. Educational spending will take the lead in 2017 public work. Historically, public spending increases by less than 10% per year.
The six Nonresidential Buildings markets, Office (+30% YTD), Lodging (+50%), Educational (+10%), Healthcare (+20%), Commercial Retail (+15%) and Amusement/Recreation (+15%) make up 80% of all nonresidential buildings spending and account for combined growth of 16.5% in YTD new starts. Office and Lodging in 2016 will reach the 5th consecutive annual increase. Educational Markets, Commercial Retail and Amusement/Recreation will each record the 4th consecutive annual increase in total value of new starts. Spending combined for these six markets peaked in 2008 and dropped 37% to a bottom in 2012. For the last 3 years spending growth has ranged between 9%/yr and 12%/yr. For 2017, expect spending growth of 8%.
Manufacturing makes up 18% of nonresidential building market share. New starts 2016 YTD are down 54% from 2015. However, in 2014 and 2015 this market posted the fastest growth of any market in a decade and posted the two highest years on record for this market. It is currently settling back to a normal growth range. In 2014 starts increased 90%. In 2015 spending increased 33% to the highest ever recorded for manufacturing buildings. Spending will be down 2% to 3% in 2016 and down another 13% more in 2017, but 2017 will still be the 3rd highest year of spending on record.
Non-building Infrastructure starts will be down nearly 10% in 2016 but were up 25% in 2015. Power and Highway/Bridge/Street make up 2/3rds of non-building infrastructure spending. In 2015, Power starts increased 150% to an all-time high and Highway/Bridge/Street finished just shy of a 6-year high. It is not unexpected that starts in these markets will be down for 2016. The volume of monthly spending from projects started in 2014 and 2015 in this sector will contribute to spending for several years to come. Spending in 2017 will be the highest ever in this sector, up 7% from 2016.
Residential starts are having the best year since 2005-2006. Residential starts bottomed in 2009 and are now in the 7th consecutive year of growth. Although new starts will increase only about 7%-8% for 2016, that follows 4 years of growth averaging more than 20%/year. Spending peaked in 2005-2006 and dropped 60% to a low in 2009-2010. Spending has bounced 90% off the bottom in large part due to 17%/year average growth in 2013-2014-2015. Both starts and spending slowed in 2016 but still expect 7% to 8% spending growth in both 2016 and 2017.
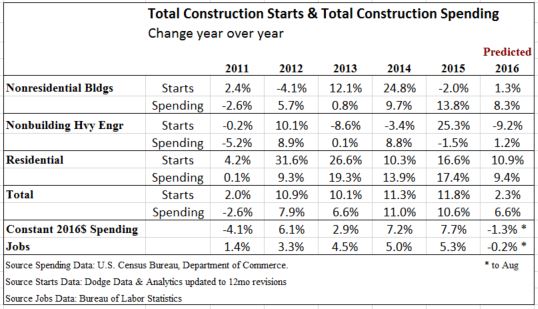
Starts are recorded in full in the month a project starts but the total project budget gets spent over a long duration, so the effects on spending are spread over the next 2 to 3 years. Total starts are Up 10%/yr to 12%/yr for the last 4 years. The current forecast for 2016 is growth of only 3.5%, but that now leads us to a very important factor that must be considered when using starts data to predict future spending.
There is a major factor that keeps new starts in the current year from appearing as good as they should. Dodge Data continually revises starts. In every monthly release, the previous month is revised AND the last year’s year-to-date is revised. Dodge does incorporate other (usually minor) revisions at a later date, but the “12 month” revision to the previous year-to-date values captures a large part of all revisions.
So this September report includes revisions to the total 2015 YTD values through September 2015. None of the 2016 values yet include that equivalent “12 month” revision and won’t until next year. But the current year YTD not-yet-revised values are being compared to the previous year YTD revised values which has the affect of making current year growth appear lower than it should.
In the last 10 years the YTD revisions have never been down. Usually, most of the revisions occur to nonresidential buildings, about 5% to 6% per year, with only a 2% to 3% revision each to infrastructure and residential.
For total nonresidential buildings, so far year-to-date 2015 values through September have been revised UP by 9%. So while the 2016 year-to-date nonresidential buildings value this month is noted as down 2% compared to last year, much of the reason it is down is because 2015 values have had revisions applied that increase the 2015 base by 9%. We won’t get those equivalent “12 month” revisions applied to 2016 values until next year. When all the revisions are in, new starts for nonresidential buildings (typically revised up by 5% to 6%) in 2016 are on track to equal or exceed 2015 and perhaps record the third consecutive year of over $220 billion. We are within easy striking distance of the all-time high for nonresidential buildings starts reached in 2007!
For residential starts, if 2016 values get revised up next year by only 2%-3%, then 2016 will have grown by nearly 10% over 2015. Unless we experience a severe downward trend in new residential starts, which is NOT predicted, 2016 will post an all-time high for new residential starts.
(Year-to-date by market and month/month values by market are not published.)
Headline comparisons we read are often what happened this month versus last month or year-to-date versus last year. For comparisons to construction spending and jobs it is perhaps beneficial to look at recent and longer term trends. Here I will discuss construction jobs growth versus spending growth and highlight some of the pitfalls when comparing these values for productivity.
The most talked about reason for slower jobs growth is the lack of experienced workers available to hire. In fact, recent surveys indicate about 70% of construction firms report difficulty finding experienced workers to fill vacant positions. That certainly cannot be overlooked as one reason for slower jobs growth, but that is not the only reason?
Even with all this talk of difficulty finding experienced construction workers, there has been very good jobs growth. For the 5 ½ year period from the bottom in January 2011 to the present (August 2016) we added 1,240,000 construction jobs.
Jobs increased by 23% in 5 ½ years with peak growth in 2014 and 2015.
For the two years 2014+2015 we added 650,000 jobs, the largest number of new jobs in two years since 2004+2005.
In 2014-2015, jobs expanded by 11%, the highest number of jobs in a two-year span since 2004-2005 and the fastest two-year percent growth since 1998-1999. Peak growth was 6.1% in 2014 with slower growth in 2015. I expect even slower growth in 2016.
For the 6-month period including Oct’15 thru Mar’16 construction gained 214,000 jobs, the fastest rate of consecutive months jobs growth in 10 years. Then, after 3 months of losses, July shows a modest gain.
Jobs growth from October 2015 through March 2016 was exceptional, 214,000 construction jobs added in 6 months, topping off the fastest 2 years of jobs growth in 10 years. That is the highest 6-month average growth rate in 10 years. That certainly doesn’t make it seem like there is a labor shortage. However, it is important to note, the jobs opening rate (JOLTS) is the highest it’s been in many years and that is a signal of difficulty in filling open positions.
I would expect growth like that to be followed by a slowdown in hiring as firms try to reach a jobs/workload balance, after such a robust period of jobs growth. It appears we may have experienced that slowdown. Jobs have been down four of the last six months and up most recently.
Q2’16 jobs declined all 3 months. Keep in mind, this immediately follows the fastest rate of jobs growth in 10 years. But it also tracks directly to three monthly declines in spending. (I predicted this jobs slowdown in my data 9 months ago. I predicted the 1st half 2016 spending decline more than a year ago).
It is not so unusual to see jobs growth slowed in the 2nd quarter. It follows directly with the Q2 trend in spending and it follows what might be considered a saturation period in jobs growth. The last two years of jobs growth was the best two-year period in 10 years. It might also be indicating that after a robust 6 month hiring period there are far fewer skilled workers still available for hire. The unemployed available for hire is the lowest in 16 years.
Construction spending hit bottom at the same time as jobs, the 1st quarter 2011. For the same 5 ½ year period, Jan 2011 to Aug 2016, construction spending increased 52%, far more than jobs growth. For 2014+2015, spending increased close to 11% per year, the fastest spending growth in more than 10 years.
For the same 6-months, Oct’15 thru Mar’16, Q4’15 spending was flat but by the end of Q1’16 spending had increased more than 4% in 6 months, to an annual rate of +8%.
2nd quarter 2016 spending came in 2% below 1st quarter.
Total 1st half spending finished 7.2% above the 1st half 2015.
Although spending slowed in the 2nd quarter this year, in part it’s because the 1st quarter was so strong. They combined for a strong 1st half up 7.2% over last year.
Why is it that jobs don’t increase at the same rate as construction spending? Because much of that spending growth is just inflation, not true volume growth. Volume is construction spending minus inflation. To get volume we need to convert all dollars from current $ in the year spent into constant $ by factoring out inflation.
Jobs growth should not be compared to spending growth.
Spending increased 52% from Jan/Feb 2011 to Jul/Aug 2016.
After adjusting for inflation from Q1 2011 to Q3 2016, we find that construction volume increased by 28% in 5 ½ years.
So, it looks like volume (+28%) still increased much more than jobs (+23%) in the same period and this would indicate increasing productivity. But this still is not the whole picture. Jobs need to be adjusted.
Jobs needs to take into consideration the hours worked.
Before the dramatic decline in jobs from 2007 through 2010, hours worked ranged between 37hrs/wk and 38hrs/wk. But by 2015, and into 2016, hours worked has been consistently over 39hrs/wk. So not only did the workforce grow by 1.24 million jobs (+23%), but also the entire 7.0 million work force is working about 4% more hours/week. This must be considered to get net jobs, or work output.
After adjusting for hours worked from Q1 2011 to Q3 2016, we find that net jobs growth increased by 28% in 5 ½ years.
Since Q1 2011 the constant $ value of construction spending increased by 28%.
Since Q1 2011 Jobs/hours worked output also increased by 28%.
Since Jan 2011, volume increased 28% and workforce output increased 28%, for a net productivity balance, but in 2011 we had a significant productivity loss and a smaller loss in 2013. The huge 2011 productivity loss is probably in part explained by the resumption of hiring after historic job cuts, particularly in 2009 when the work force was cut 16% but, while spending declined by 16%, work volume declined only 11%, which may have overshot the balance mark. That helps account for the huge productivity gain in 2009, but also leads to the losses in 2010 and 2011.
From Jan 2014 to Dec 2015 volume increased by 15% and workforce output increased by only 10.5%. Total hours worked compared to total constant value of spending shows productivity increased for those two years. Historically, we should not expect to see productivity growth continue for a third year and as of August it is down year-to-date.
I expected to see a turn-around in jobs growth in the 2nd half of 2016, and so far, for the 3-month period July-Sept we’ve added 34,000 jobs. That’s starting out perhaps a little slower than I thought. For much of 2014 and 2015 volume growth was exceeding jobs growth, but for 10 months from August 2015 through May 2016, volume growth mostly stalled and jobs growth, which just had 6 months of record high growth, exceeded volume growth by 3%. Only in the last few months has volume growth begun to outpace jobs growth again. But I suspect it is this slow down in real volume growth that has led to slow jobs growth. This leads me to think if spending plays out as expected into year end 2016, then construction jobs may begin to grow faster in late 2016. However, availability could have a significant impact on this needed growth.
Availability already seems to be having an effect on wages. Construction wages are up 2.6% year/year, but are up 1.2% in the last quarter, so the rate of wage growth has recently accelerated. The most recent JOLTS report shows we’ve been near and now above 200,000 job openings for months. With this latest jobs report, that could indicate labor cost will continue to rise rapidly.
As wages accelerate, also important is work scheduling capacity which is affected by the number of workers on hand to get the job done. Inability to secure sufficient workforce could impact project duration and cost and adds to risk, all inflationary. That could potentially impose a limit on spending growth. It will definitely have an upward effect on construction inflation this year.
For all of 2016 and 2017, I predict construction spending will increase about 15%, BUT after inflation construction volume will increase only about 6% to 7%, most of that in 2017. For all of 2016 and 2017, I predict jobs will grow by 350,000 to 450,000, only about 5% to 6%.
For the 6 month period including Oct’15 thru Mar’16 construction gained 214,000 jobs, the fastest rate of growth in 10 years. Then, after 3 months of losses, July shows a modest gain.
During that same period Q4’15 spending was flat but by the end of Q1’16 spending had increased more than 4% in 6 months, or at an annual rate of 8% to 9%.
Even though some upward revision is expected for June spending, total Q2’16 spending will still be down 2% to 3% from Q1.
Q2’16 jobs declined all 3 months, keeping in mind this immediately follows the fastest rate of growth in 10 years. But it also tracks directly to three monthly declines in spending.
June spending did get revised up by 1.85% and 2nd qtr spending came in 2.05% less than 1st qtr. However total 1st half spending finished 7.2% above the 1st half 2015. August spending looks low at 1st print but we can expect that to be revised up by 1% to 2%. Historically, the 1st release of construction spending gets revised up 90% of the time. So it looks like spending bounced off of the April-May low point.
The 2nd quarter jobs slowdown coincided with the 2nd quarter spending dip.
From my blog post 8-6-16 Construction Jobs – Is July a Turning Point?
It is not so unusual to see jobs growth slowed in these last few months. It follows directly with the Q2 trend in spending and it follows what might be considered a saturation period in jobs growth. The last two years growth was the best two-year period in 10 years. It might also be indicating that after a robust 6 month hiring period there are far fewer skilled workers still available for hire. The unemployed available for hire is the lowest in 16 years.
We got modest growth in July that I hope to see continue for the 2nd half 2016. I expect spending to experience strong growth in the 2nd half and jobs growth should follow closely, perhaps adding 125,000 to 150,000 more jobs. However, although I do expect both spending and jobs growth, jobs could be somewhat restrained by lack of available skilled workers.
Comment 10-7-16
Construction Jobs growth from October 2015 through March 2016 was exceptional, 214,000 construction jobs added in 6 months, topping off the fastest 2 years of jobs growth in 10 years. Growth like that can only be followed by a slowdown in hiring until companies reach a jobs/workload balance, and it appears we may have experienced that slowdown. Jobs have been down four of the last six months. I expected to see a turn-around in the 2nd half, and so far, for the 3 month period July-Sept we’ve added 34,000 jobs. That’s starting out perhaps a little slower than I thought. For much of 2014 and 2015 volume growth was exceeding jobs growth, but for 10 months from August 2015 through May 2015, volume growth stalled and jobs growth exceeded volume growth by 3%. Only in the last few months has volume growth begun to outpace jobs growth again. I predicted at least 125,000 new jobs in the 2nd half, so we would need to add 90,000 to 100,000 more before year-end. But, there could be skilled labor constraints and the Aug and Sept numbers are still subject to revision. And we still have 3 months to go.
A common headline we see when Census releases monthly figures for Total Construction Spending is “Spending Unexpectedly Declines Mo/Mo.” Here’s why that is almost always misleading. Construction spending gets revised, UP, usually. So, the first number released is generally low.
U S Census report for August Construction Spending released October 3 posts August at a seasonally adjusted annual rate (SAAR) of spending at $1.142 billion, down 0.7% from July and this reduces the year-to-date (YTD) spending from +5.6% last month to now only +4.9% higher than the same 8 months of 2015.
Construction Spending for Nonresidential Buildings Aug vs July UP 0.4%, 6th monthly increase this year. YTD is UP 8.2% from 2015.
Construction Spending for Nonbuilding Infrastructure Aug vs July DOWN 2.2%, 5th monthly decline this year. YTD is DOWN 0.4%.
Construction Spending for Residential Aug vs July DOWN 0.2%, Only 2nd monthly decline this year. YTD is UP 6.2%.
Comparisons using the first print of data almost always reflect a lower mo/mo or yr/yr growth rate than the final actual result because the first print “unadjusted value” is being compared to previous month or last year “adjusted values.” Construction spending, from 1st release to last revision of data, has been revised upward every month since August 2013. That would indicate the first reports of an “unexpected decline” almost always get revised up in following months.
The latest spending release is pending revision for the next two months and then the whole year gets one (usually final) revision in the middle of next year. Sometimes there is a second annual revision the following year.
Total construction spending, from 1st release to last revision of data, has been revised upward in the last 32 months by an average of +2.3%/month. However, the average revisions for the last 12 months have averaged only +1.3%/month. Sometimes the 1st revision is down then the 2nd up. Downward revision is rare. The very strong historical trend is for upward revisions after the first release of monthly data.
Some examples of revisions:
Total construction spending over the last 12 months has been revised UP 10 of 12 times. The average of all revisions is +1.3%/month. Monthly revisions have ranged from -0.5% up to +3.4%.
Office spending has been revised UP 4 of 7 times in 2016. The average revision is nearly flat but revisions have ranged from -3% to +6.5%.
Commercial spending has been revised UP 4 of 7 times in 2016. The average revision is +1.1%/month. Revisions have ranged from -1.5% up to as high as +8% for a particular month.
Residential spending has been revised UP 6 of 7 mo in 2016. The average revision is 2.1%/month. Monthly revisions have ranged from -1.6% to +7.5%
Power Infrastructure has been revised UP 6 of 7 times in 2016. The average revision is +4.7%/month. Revisions have been as high as 9% for a particular month.
For 2016, final data won’t be published until July 2017, but so far through July, monthly revisions have reversed 4 out of 5 initial mo/mo declines to increases.
For all of 2013, 2014 and 2015, the average month/month growth rates increased from an initial reading of +0.14% to a final reading of +0.76%.
For all of 2014 and 2015, the average year/year growth rates increased from an initial reading of +8.1% to a final reading of +10.8%.