Publicly Funded Construction
2-28-18
- What types of construction might get funded by Infrastructure stimulus?
- How big is the Infrastructure construction market?
- What share of Infrastructure is Public work?
- What other types of work are publicly funded?
- How much new stimulus work can be added to current backlog?
- Total all construction spending in 2017 will be about $1.240 trillion.
- Infrastructure = $300 billion, 25% of all construction spending.
- Infrastructure is about 60% public, 40% private. In 2005 it was 70% public.
- Public Infrastructure = $170 billion. Private Infrastructure = $130 billion.
- Power and Communications are privately funded infrastructure.
- Nonresidential Buildings is 25% public (mostly institutional), 75% private.
- Educational, Healthcare and Public Safety are Public Nonres Institutional Bldgs
- Public Commercial construction is not included.
- Public Institutional = $100 billion, mostly Education ($70b).
Total Public Infra + Institu = $270 billion, 23% of total construction spending.
The potential target markets for an infrastructure stimulus plan could range from the $170 billion public civil infrastructure market up to a total $270 billion market that includes public institutional work. All of these types of projects may not get funded. Then again, Communications, which is 99% private and not included here, has been considered to receive some stimulus funding (rural broadband).

Total All Construction spending, all public + private construction, has average growth of $50 billion/year. Adding $100 billion of spending in a single year, from all sources public and private, is the maximum level of growth for the entire construction industry.
Public Infrastructure + Institutional average growth is $12 billion/year. It has never exceeded $30 billion in growth in a single year.
Public Infrastructure best growth (highest for at least 3 consecutive years, and in almost all cases was from 2005-2007) over the last 15 years, averages 10%/year. For Sewer, Water, Conservation and Communications that’s equivalent to adding only $1 bil to $2 bil per year. For Transportation it’s $4 bil/yr and for Highway it’s $8 bil/yr. For Public Institutional, Educational it’s $8 bil/yr. and other institutional about $2 bil/yr. If all these could hit best ever averages at the same time then Infrastructure spending would grow $25-$30 billion/year.
Spending growth from work already in record backlog for public infrastructure + institutional is predicted to increase by $10-$20 billion/yr. in each of next several years. Transportation alone for the next two years is increasing by more than $10 billion/year. Adding $15-$20 billion/year more in spending for an infrastructure expansion plan would push total public work well above record levels, at least for the next three years. That is probably not sustainable.
Public infrastructure and institutional, only 23% of the entire industry, can probably only absorb another $10 billion of new growth per year on top of the predicted growth. That would push growth to $20-$25 billion/year, near record growth in each of the next three years.
For every $10 billion a year in added infrastructure spending, that also means adding about 40,000 new construction jobs per year.
Average post-recession growth in public infrastructure + institutional jobs is about 35,000 jobs per yr. Max growth was 50,000 jobs/yr. Historical maximum jobs growth would seem to limit spending growth to a total of about $15 billion/year. That is the amount of spending already predicted from work in backlog, without adding any more work from an infrastructure stimulus plan.
Because the potential markets to which stimulus might be applied are relatively small in comparison to all construction, and because those markets identified are already at record backlog, both historical maximum spending growth and jobs growth identify potential limits on infrastructure stimulus growth. Those limits are much lower than generally thought.
This article has more on the same topic Down the Infrastructure Rabbit Hole 2-16-18
Read more Details Behind The Headlines – Infrastructure 3-23-17

PPI Construction Materials Inputs Index
2-20-18 original post
Feb 2019 Tables and Plots updated to end of 2018
Here’s the link to the June 2019 data
Here’s a link to the AGC APRIL 2020 summary report.
Producer Price Index of Materials Inputs to Construction. The 1st two plots are PPI Final Costs which includes all overhead and profit as sold. All other plots are PPI Input costs. Changes in PPI Input costs at the producer level may not reflect changes in actual pricing to contractors or changes in final cost as installed to building owner. Input Costs do not reflect retail markup or mark down and do not reflect overhead and profit markups that may change according to market activity.
PPI for Construction Inputs IS NOT a direct indicator of construction inflation. It does not represent selling price, the final cost of materials put-in-place which includes cost of labor, overhead and profit. See below link to description of Ovhd&Profit.
Cautions When Using PPI Inputs to Construction!
PPI Inputs and Inflation not only can vary widely but also may not even move in the same direction. See the above link for a table comparing PPI% vs Inflation%.


PPI Nonresidential Building Types
PPI Nonresidential Building Construction Sector — Contractors
Specific Building and Contractor PPI Indices are Final Demand or Selling Price indices. They are plotted above.
Bureau of Labor Statistics Producer Price Index measures PPI cost of materials price at producer level. The PPIs that constitute Table 9 of the BLS PPI Report measure changes in net prices for materials and supplies typically sold to the construction sector, but do not represent the final cost installed. They are known as PPI Inputs. They are plotted below.
PPI Materials and Supply INPUTS to Construction Industries
Here’s a brief summary of some of the PPI statistics tracked here:
- One year (2018) change
- biggest increases > Steel Pipe and Tube 21%, Fabricated Steel for Bridges 15%, Ornamental Metals 12%, Fab Structural Steel for Buildings 12%
- biggest declines > Copper and Brass shapes -6%, Lumber and Plywood -4%
- PPI Final cost of buildings and Trades up 4% to 6%
- Final cost of buildings posted largest increases since 2008.
- Final cost of trades (except for Roofing) posted largest increases since 2009.
- Steel Products posted largest increases since 2008
- Lumber and Plywood, which had risen dramatically (+30%) earlier in the year, now down 4% from Dec ’17
- Two year (2017+2018) changes
- biggest increases > Diesel fuel 45%, Steel Pipe &Tube 31%, Aluminum Shapes 16%, Fabricated Structural Metal for Buildings 16%, Ornamental metals 16%
- no declines over a two year period
Most stable pricing over last 5 years, these items did not change by more than 5%/yr in any given year during the last 5 years and net the smallest total change for 5 years: Concrete Brick and Block, Concrete Pipe, Ready-Mix Concrete, Plastic Products, Insulation, Fabricated Steel Plate, Sand/Gravel/Crushed Stone.


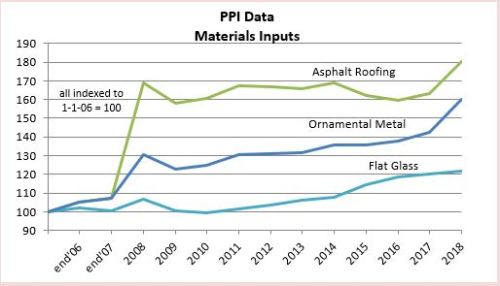

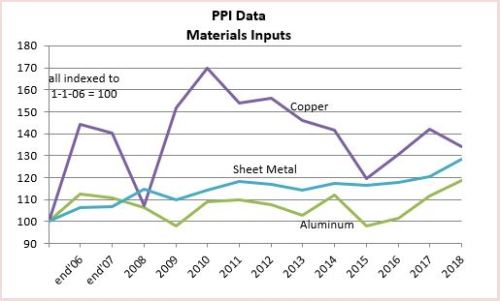
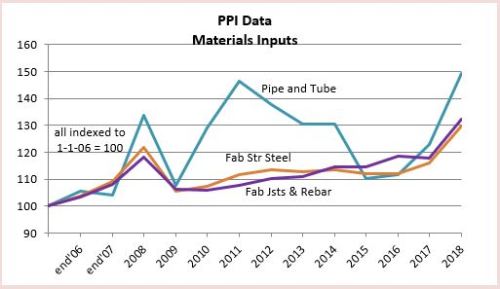
The Materials Inputs indices plots above are generated by indexing the December to December percent changes in the table below. Data updated to include Dec 2018 published January 2019.



Each month, @AGCofA @KenSimonson puts out tables and explanation of recent changes in producer price indexes and employment cost indexes for construction materials inputs, and building types and subcontractor final demand cost. Best source available. Watch this AGC page for monthly updates to the PPI
Here’s the link to the June 2019 data

Down the Infrastructure Rabbit Hole
2-16-18
Down the Infrastructure Rabbit Hole. A twitter thread on construction capacity.
The infrastructure sector is only 25% of all construction spending, with the largest share being the Power market. Power accounts for 33% of all infrastructure spending. Highway represents 30% and Transportation about 15%. However, Power is 80% private, Transportation 30% private.
Only 60% of all Infrastructure spending is publicly funded. Highway is about half of all publicly funded Infrastructure construction. That public subset of work in the last 25 years has grown by $20 billion/year only once and averages growth of less than $10 billion/year.
Most public work is Infrastructure or public works projects, about 60%, but some public work is nonresidential buildings, about 40%. Public Safety is 100% public. Educational projects are 80% public. Amusement/Recreation Facilities (i.e.’ Convention Centers, Stadiums) is 50% public. Healthcare is 20% public.
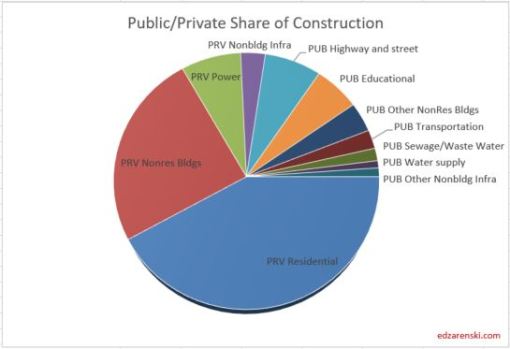
The two largest markets contributing to public spending are Highway/Bridge (32%) and Educational (26%), together accounting for nearly 60% of all public construction spending. At #3, Transportation is only about 10% of public spending.
Sewage/Waste Water and Water Supply add up to another 10% of the market. All other markets combined, Conservation and all other various nonresidential buildings, none more than 4% of the total, account for less than 20% of public spending.
It is rare that Nonbuilding Public Infrastructure construction spending increases by more than $10 billion in a year. Once, only once, it increased by an average of $10 billion/year for three years. Excluding recession, average annual growth is $4 billion/year.
It is rare for Total All Public Infrastructure to increase by $20 billion in a year. It has done so only ever twice. Excluding the two worst recession years, the average annual growth since 2001 is $7 billion/year.
For every $10 billion a year in added infrastructure spending, that also means adding about 40,000 to 50,000 new construction jobs per year.
Infrastructure construction spending is near all-time highs and has been for the last several years. Public spending is 10% ($30bil) below all-time highs, the largest deficits coming from Educational, Sewage/Waste Water and Water Supply.
Either an infrastructure spending plan is used to create new work or it becomes a funding source to pay for work already planned, in which case it does not increase spending or jobs projections.
As proposed, states and municipalities would be required to come up with 80% of the funding for any new infrastructure project to qualify for 20% of funding from the federal government, potentially shifting the bond funding tax burden to states.
Alternatively, states could solicit private partnership funding, in which case what would normally be considered public assets could become privately controlled assets. This raises a whole new list of issues for discussion, not engaged here.
Infrastructure currently has the highest amount of work in backlog in history. Public work is at its 2nd highest starting backlog only to 2008. Starting backlog accounts for 80% of spending in the current year and 60% of spending in the following year.
Current levels of backlog and predicted new starts gives a projection that Public Nonbuilding Infrastructure spending will reach an all-time high in 2018 and again in 2019.
Total All Public Infrastructure in 2018 also reaches an all-time current$ spending high. However, in constant$, inflation adjusted, volume of work is still well below previous peak.
The non-building infrastructure construction sector does not have the capacity to increase spending over and above existing planned (booked and projected new starts) work by another $10 billion/year, nor does it have the capacity to add an additional 40,000 jobs per year.
Total All Public Infrastructure construction, including public works and Nonresidential public buildings, already has a growth projection near historic capacity. It cannot double that volume by another $10-$20 billion/year and add an additional 40,000 – 80,000 jobs per year.
Below is the timeline of my articles series on Infrastructure. Some of the numbers have changed slightly over the past year, but not enough to change the premise of the articles.
2-28-18 Publicly Funded Construction
2017/12/03 spending-summary-construction-forecast-fall-2017
2017/11/11 backlog-construction-forecast-fall-2017
2017/10/10 is-infrastructure-construction-spending-near-all-time-lows
2017/03/23 behind-the-headlines-infrastructure-spending-&-jobs
2017/03/06 calls-for-infrastructure-problematic
2017/03/05 infrastructure-public-spending
Inflation in Construction 2019. What Should You Carry?
1-28-20 See the latest post Construction Inflation 2020
8-26-19 go to this article for Added links to sources for international construction inflation rates
1-14-20 added new index table covering 2015-2023 at Index Table Link – see link to Tables below
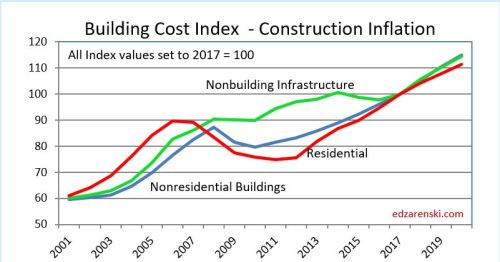
This table updates 2018 and 2019 data and 2020-2023 forecast. Nonresidential inflation, after hitting 5% in both 2018 and 2019, is forecast for the next three years to fall from 4.4% to 3.8%, lower than the 4.5% avg for the last 4yrs. Forecast residential inflation for the next three years is level at 3.8%. It was only 3.6% for 2019 but averaged 5.5%/yr since 2013.
When construction is very actively growing, total construction costs typically increase more rapidly than the net cost of labor and materials. In active markets overhead and profit margins increase in response to increased demand. These costs are captured only in Selling Price, or final cost indices.
General construction cost indices and Input price indices that don’t track whole building final cost do not capture the full cost of inflation on construction projects.
To properly adjust the cost of construction over time you must use actual final cost indices, otherwise known as selling price indices.
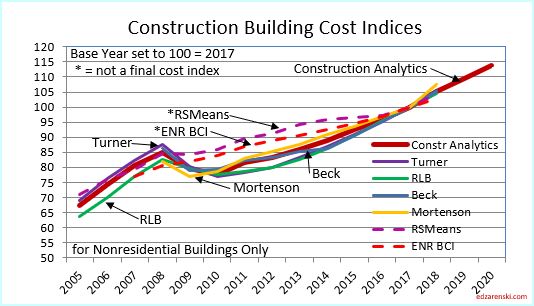
ENRBCI and RSMeans input indices are examples of commonly used indices that DO NOT represent whole building costs, yet are widely used to adjust project costs. An estimator can get into trouble adjusting project costs if not using appropriate indices. This plot of cost indices for nonresidential buildings shows how input indices did not drop during the 2008-2010 recession while all other final cost indices did drop.
CPI, the Consumer Price Index, tracks changes in the prices paid by urban consumers for a representative basket of goods and services, including food, transportation, medical care, apparel, recreation, housing. The CPI is not related at all to construction and should not be used to adjust construction pricing. Historically, Construction Inflation is about double the CPI, but for the last 5 years construction inflation averages 3x the CPI.
Producer Price Index (PPI) Material Inputs (which exclude labor) to new construction increased +4% in 2018 after a downward trend from +5% in 2011 led to decreased cost of -3% in 2015, the only negative cost for inputs in the past 20 years. Input costs to nonresidential structures in 2017+2018 average +4.3%, the highest in seven years. Infrastructure and industrial inputs were the highest, near 5%. But material inputs accounts for only a portion of the final cost of constructed buildings.
Materials price input costs in 2019 slowed to an annual rate of less than 1%.
Labor input is currently experiencing cost increases. When there is a shortage of labor, contractors may pay a premium to keep their workers. Unemployment in construction is the lowest on record. The JOLTS ( Job Openings and Labor Turnover Survey) is at or near all-time highs. A tight labor market will keep labor costs climbing at the fastest rate in years.
Click Here for Link to a 20-year Table of 25 Indices
Inflation can have a dramatic impact on the accuracy of a construction budget. Usually budgets are prepared from known current costs. If a budget is being developed for a project whose midpoint of construction costs is two years in the future, you must carry an appropriate inflation factor to represent the expected cost of the building at that time.
The level of construction activity has a direct influence on labor and material demand and margins and therefore on construction inflation. Nonresidential Buildings and Non-building Infrastructure backlog are both at all-time highs. 75% to 80% of all nonresidential spending within the year comes from starting backlog.
Although nonresidential buildings new starts are up only 5% the last three years, spending from backlog in 2020 is up 20% in three years and reaches an all-time high.
Most spending for residential comes from new starts. Residential new starts in Q1-2018 reached a 12 year high. Spending from new starts in 2019 fell 6% but is up 6% for 2020. Spending from new starts in 2020 is back to the level posted in 2017 and 2018.
2020 starting backlog is up 5.5% across all sectors. However, while a few markets will outperform in 2020 (transportation, public works, office), predicted cash flow (spending) from backlog is up only 1% to 2%.
Although many contractors report shortages due to labor demand, labor growth may slow due to a forecast 2019-2020 construction volume decline. But, we might see a labor decline lag spending/volume decline.
Expect 2019 escalation in almost all cases to finish at or lower than 2018.
Residential construction inflation in 2019 was only 3.6%. However, the average inflation for six years from 2013 to 2018 was 5.5%. It peaked at 8% in 2013, but dropped to 4.3% in 2018 and only 3.6% in 2019. Residential construction volume in 2019 dropped 8%, the largest volume decline in 10 years. Typically, large declines in volume are accompanied by declines in inflation. Forecast residential inflation for the next three years is level at 3.8%.
Note 8-2-19: Residential inflation for the 1st half of 2019 has come in at only 3.5%.
A word about Hi-Rise Residential. Probably all of the core and shell and a large percent of interiors cost of a hi-rise residential building would remain the same whether the building was for residential or nonresidential use. This type of construction is totally dis-similar to low-rise residential, which in large part is stick-built single family homes. Therefore, use the residential cost index for single family but a more appropriate index to use for hi-rise residential construction is the nonresidential buildings cost index.
Nonresidential inflation, after hitting 5% in both 2018 and 2019, is forecast for the next three years to fall from 4.4% to 3.8%, lower than the 4.5% average for the last 4 years. Spending needs to grow at a minimum of 4.4%/yr. just to stay ahead of construction inflation, otherwise volume is declining. Spending slowed dramatically in 2019. However, new starts in 2018 and 2019 boosted backlog and 2020 spending will post the strongest gains in four years.
Material tariffs in 2018 and 2019 are already incorporated into inflation. Adjust for any new tariffs impact.
In another article on this blog, (see steel cost increase), I calculated the 25% tariff on steel would cost nonresidential buildings 1%. Some Infrastructure could be much more, i.e., bridges 4-5%. Residential impact would be small. A 25% increase in mill steel could add 0.65% to final cost of building just for the structure. It adds 1.0% for all steel in a building. If your building is not a steel structure, steel still potentially adds 0.35%.
Note 8-2-19: Nonresidential Buildings inflation for the 1st half of 2019 as tracked by most national selling price indices has come in at just over 5%.
Reliable nonresidential buildings selling price indexes have been over 4% since 2015. Some have averaged over 5% for the last four years. Construction Analytics forecast (line) for 2019 is currently 5.1%. This may move higher due to the impact of September 2019 tariffs which are not yet reflected in any indices.

Non-building infrastructure indices are so unique to the type of work that individual specific infrastructure indices must be used to adjust cost of work. The FHWA highway index increased 17% from 2010 to 2014, stayed flat from 2015-2017, then increased 15% in 2018-2019. The IHS Pipeline and LNG indices increased 4% in 2019 but are still down 18% since 2014. Coal, gas, and wind power generation indices have gone up only 5% since 2014. Refineries and petrochemical facilities dropped 10% from 2014 to 2016 but regained all of that by 2019. BurRec inflation for pumping plants and pipelines has averaged 2.5%/yr since 2011 and 3%/yr the last 3 years.
Anticipate 3% to 4% inflation for 2019 with the potential to go higher in rapidly expanding Infrastructure markets, such as pipeline or highway.
This link refers to Infrastructure Indices.
Watch for unexpected impacts from tariffs. Steel tariff could potentially add 5% to bridges. Also impacted, power industry, pipeline, towers, transportation.
- Long term construction cost inflation is normally about double consumer price inflation (CPI).
- Since 1993 but taking out 2 worst years of recession (-8% to -10% total for 2009-2010), the 20-year average inflation is 4.2%.
- Average long term (30 years) construction cost inflation is 3.5% even with any/all recession years included.
- In times of rapid construction spending growth, construction inflation averages about 8%.
- Nonresidential buildings inflation has average 3.7% since the recession bottom in 2011. It has averaged 4.2% for the last 4 years.
- Residential buildings inflation reached a post recession high of 8.0% in 2013 but dropped to 3.4% in 2015. It has averaged 5.8% for the last 5 years.
- Although inflation is affected by labor and material costs, a large part of the change in inflation is due to change in contractors/suppliers margins.
- When construction volume increases rapidly, margins increase rapidly.
- Construction inflation can be very different from one major sector to the other and can vary from one market to another. It can even vary considerably from one material to another.
The two links below point to comprehensive coverage of the topic inflation and are recommended reading.
Click Here for Link to a 20-year Table of 25 Indices
Click Here for Cost Inflation Commentary – text on Current Inflation

2018 Construction Outlook Articles Index
Articles Detailing 2018 Construction Outlook
Links will open in a new tab
These links point to articles here on this blog that summarize end-of-year data for 2017 and present projections for 2018.

Most Recently Published
July Construction Starts Fall but 3moAvg at New High
Construction Spending June 2018 8-1-18
June Construction Starts Reach New Highs 7-25-18
Construction JOLTS – What’s wrong with this picture? 7-10-18
Construction Spending 2016-2017 Revisions 7-1-18
New Construction Starts May 2018 Near All-Time High 6-24-18
Construction Spending April 2018 – 6-1-18
Notes on March 2018 Construction Spending 5-2-18
Construction Activity Notes 4-25-18
2018 Construction Spending Forecast – Nonresidential Bldgs 3-28-18
2018 Construction Spending Forecast – Mar 2018
Construction Economics Brief Notes 3-10-18
Construction Spending is Back 3-9-18
Publicly Funded Construction 2-28-18
PPI Materials Input Index 2-20-18
Down the Infrastructure Rabbit Hole 2-16-18
Inflation in Construction 2018 – What Should You Carry? 2-15-18
Residential Construction Jobs Shortages 2-3-18
2018 Construction Spending – Briefs 1-26-18
Cautions When Using PPI Inputs to Construction! 1-15-18
Indicators To Watch For 2018 Construction Spending? 1-10-18
Spending Summary 2018 Construction Forecast Fall 2017 12-3-17
Backlog 2018 Construction Forecast Fall 2017 11-10-17
Starts Trends 2018 Construction Forecast Fall 2017 11-8-17
In What Category is That Construction Cost? 11-15-17
Construction Jobs / Workload Balance 11-7-17
Constant Dollar Construction Growth 11-2-17
Is Infrastructure Construction Spending Near All-Time Lows? 10-10-17
Summary
2018 Construction Spending Forecast – Mar 2018
2018 Construction Spending – Briefs 1-26-18
Spending Summary 2018 Construction Forecast Fall 2017 12-3-17
Construction Spending is Back 3-9-18
2017 Results
2018 Construction Spending Forecast – Mar 2018
Spending Summary 2018 Construction Forecast Fall 2017 12-3-17
2018 Starting Backlog & New Starts
2018 Construction Spending – Briefs 1-24-18
Backlog 2018 Construction Forecast Fall 2017 11-10-17
Starts Trends 2018 Construction Forecast Fall 2017 11-8-17
Construction Starts and Spending Patterns 9-26-17
2018 Spending Forecast
2018 Construction Spending Forecast – Mar 2018
2018 Construction Spending – Briefs 1-26-18
So, About Those Posts “construction spending declines…” 10-4-17
Construction Spending Almost Always Revised UP 5-1-17
Nonresidential Buildings
2018 Construction Spending Forecast – Nonresidential Bldgs 3-28-18
2018 Construction Spending Forecast – Mar 2018
2018 Construction Spending – Briefs 1-24-18
Nonres Bldgs Construction Spending Midyear 2017 Forecast 7-24-17
Residential
2018 Construction Spending Forecast – Mar 2018
Residential Construction Jobs Shortages 2-3-18
Infrastructure Outlook
2018 Construction Spending Forecast – Mar 2018
Down the Infrastructure Rabbit Hole 2-16-18
2018 Construction Spending – Briefs 1-24-18
Is Infrastructure Construction Spending Near All-Time Lows? 10-10-17
Infrastructure – Ramping Up to Add $1 trillion 1-30-17
Calls for Infrastructure Problematic 1-12-17
Public Construction
2018 Construction Spending Forecast – Mar 2018
Publicly Funded Construction 2-28-18
Spending Summary 2018 Construction Forecast Fall 2017 12-3-17
Infrastructure & Public Construction Spending 3-5-17
Materials
PPI Materials Input Index 2-20-18
Jobs
Residential Construction Jobs Shortages 2-3-18
Construction Jobs / Workload Balance 11-2-17
Construction Jobs Growing Faster Than Volume 5-5-17
Inflation
Inflation in Construction 2018 – What Should You Carry? 2-15-18
Constant Dollar Construction Growth 11-2-17
Construction Inflation Index Tables UPDATED 2-12-18
Construction Cost Inflation – Commentary updated 2-13-18
US Historical Construction Cost Indices 1800s to 1957
US Historical Construction Cost Indices 1800s to 1957
Historical Cost Indices Dating Back to 1800s
See pages 379-386 for indices
See page 387 for start of Housing
Chapter on Housing Historical Data
U S Census Historical Construction Spending Annual totals 1964-2002 USE Table 1

Residential Construction Jobs Shortages
2-3-18
During the period including 2011 through 2017, we had record construction spending, up 50% in 5 years, moderate inflation reaching as high as 4.6% but averaging 3.8%, record construction volume growth (spending minus inflation), up 30% in 5 years and the the 2nd highest rate of jobs growth ever recorded.
Residential spending was up 90% in 5 years, but real residential volume up only 50%. Residential inflation, at 6%/year, was much higher than all construction. Jobs increased only 33%.
Construction added 1,339,000 jobs in the last 5 years. The only time in history that exceeded jobs growth like that was the period 1993-1999 with the highest 5-year growth ever of 1,483,000 jobs. That same 93-99 period had the previous highest spending and volume growth. 2004-2008 would have reached those lofty highs but the residential recession started in 2006 and by 2008 spending had already dropped 50%, offsetting the highest years of nonresidential growth ever posted.
The point made here is the period 2011-2017 shows spending and jobs at or near record growth. Although 2017 slowed, there is no widespread slowdown in volume or jobs growth.
This 2011-2017 plot of Construction Jobs Growth vs Construction Volume Growth seems to show there is no jobs shortage. In fact it shows jobs are growing slightly faster than volume. But that just does not sit well with survey data from contractors complaining of jobs shortages. So how is that explained?
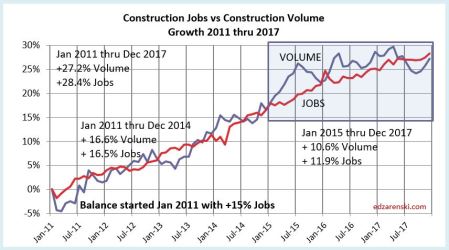
There have been cries from some quarters, including this blog, that the answer lies in declining productivity. There seems to be plenty of workers, but it now takes more workers to do the same job that took fewer in the past. As we will see, that is part of the answer, but doesn’t explain why some contractors need to fill vacant positions. To find data that might answer that question about a jobs shortage we must dig a little deeper.
The total jobs vs volume picture masks what is going on in the three major sectors, Residential, Nonresidential Buildings and Non-Building Infrastructure. A breakout of jobs and volume growth by sector helps identify the imbalances and helps explain construction worker shortages. It shows the residential sector at a jobs deficit.
7 years 2011-2017 – % Jobs growth vs % Volume growth
- Totals All Construction Jobs +31%, Volume +30%
- Nonres Bldgs Jobs +27%, Volume +19%
- Nonbldg Hvy Engr Jobs +21%, Volume +12%
- Residential Jobs +40%, Volume +54%
The totals show jobs and volume almost equal, data that supports the 2011-2017 totals plot above and what we would expect in a balanced market. But severe imbalances show up by sector. Both nonresidential sectors show jobs growth far outpaced volume growth. Residential stands out with a huge deficit, with jobs way below volume growth.
Just looking at 2017 growth shows the most recent imbalances.
2017 % jobs growth vs % volume growth
- Totals All Construction Jobs +3.4% Volume -0.8%
- Nonres Bldgs Jobs +3.3% Volume -1.6%
- Nonbldg Hvy Engr Jobs +1.7% Volume -6.0%
- Residential Jobs +3.5% Volume +4.2%
Census recently released initial construction spending for 2017, totaling $1.230 trillion, up only 3.8% from 2016. What is somewhat disconcerting is that 2017 construction spending initial reports growth of 3.8% do not even match the total inflation growth of 4.6% for 2017, indicating a -0.8% volume decline. However, as does always occur, I’m expecting upward revisions (estimated +2%) to 2017$ construction spending on 7-1-18. If we don’t get an upward revision, then 2017 will go down as the largest productivity decline since recession. Even if we do get +2% upward revision to 2017$ spending, 2017 volume would be revised up to +1.2% and jobs growth will still exceed volume growth.
Let’s look a little deeper at the data within the sectors. Each chart is set to zero at Jan 2011 so we can see the change from that point, the low point of the recession, until today. At the bottom of each chart is shown a Balance at start. That represents the cumulative surplus or deficit of jobs growth compared to volume growth for the previous 10 years prior to Jan 2011. If there are no changes in productivity, or no surplus or deficit to counteract, then jobs should grow at the same pace as volume.
There are slight differences between the data in the three sector charts and the total construction chart. The sector charts use annual avg data and the totals chart uses actual monthly data.
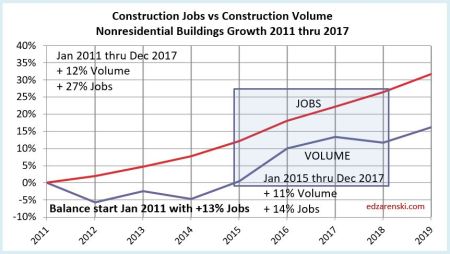

Nonresidential Buildings and Non-building Infrastructure, over seven years and the most recent three years, show jobs increasing far more rapidly than volume. Nonresidential Buildings started 2011 with a surplus of jobs after the recession, but Infrastructure started 2011 with a substantial deficit of jobs. Only in this last year did Infrastructure jobs reach long-term balance with work volume.
Nonresidential Buildings started 2011 with a 13% surplus of jobs and more than doubled it in the seven years following. I’ve suggested before it could be that a part of this surplus is due to companies hiring to meet revenue growth, and not inflation adjusted volume. Although nonresidential spending actually increased 43%, volume since 2010 has increased only 12%. Since 2010 there has been 30% nonresidential buildings inflation, which adds zero to volume growth and zero need for new jobs. A 43% increase in spending could lead companies to erroneously act to staff up to meet spending, or revenue, more than needed for the 12% volume increase.
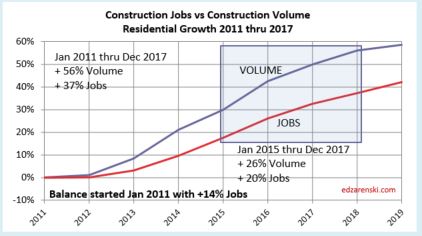
This plot for residential work shows from 2011 to the end of 2017, we’ve experienced a 20% growth deficit in jobs. How many residential jobs does this 20% growth deficit represent? From Jan 2011 through Dec 2017, residential jobs increased from approximately 2,000,000 to 2,700,000. So the base on which the % growth increased over that time is calculated on 2,000,000. An additional 20% growth would be a maximum of 400,000 more jobs needed to offset the seven year deficit. But what about the imbalances that existed when we started the period?
During the residential recession from just 2005 through 2010, residential volume declined by 55%, but jobs were reduced by only 38%. For the entire period 2001-2010, total volume of work declined by 14% more than jobs were reduced. Some of the surplus jobs get absorbed into workforce productivity losses and some remain available to increase workload. It’s impossible to tell how much of that labor force would be available to absorb future work, so for purposes of this analysis an estimate of at least 5% seems not unreasonable. That would mean for 2011-2017, instead of a need for an additional 20% more jobs, the need could be reduced by 5% or 100,000 jobs.
This analysis shows a current deficit of 300,000 to 400,000 residential construction jobs. While it does also show nonresidential buildings jobs far exceed the workload and there are more than enough surplus jobs to offset the residential deficit, there would be several questions of how transferable jobs might be between sectors.
- Are there highly technical specialty jobs in Nonresidential Buildings that would not be transferable to Residential?
- What is the incidence of specialty workers engaging in work across sectors? i.e., job is counted in one sector but working in another sector.
- What has been the impact of losing immigrants from the construction workforce?
- Is the ratio of immigrant workers in Residential much higher than Nonresidential?
- Is the pay more attractive in Nonresidential construction?
- What, if any, percentage of the Residential workforce is not being counted? Day labor?
One thing is known for certain, high-rise multifamily residential buildings may often be built by a firm that is classified primarily as a nonresidential commercial builder. Therefore, some jobs that are counted as nonresidential are really residential jobs.
I think most of these would have a more negative impact on Residential jobs. However, there is some possibility that the overall deficit may not be quite as high as available data show (points 2 and 6). And there is always the possibility that we’ve crossed a threshold that has led to new gains in productivity, although to some extent, the stark differences between Residential and Nonresidential Buildings data might counter that proposition.
These two following report references both document that there is a large unaccounted for shadow workforce in construction. This workforce is probably mostly residential.
NAHB’s HousingEconomics.com “Immigrant Workers in the Construction Labor Force”
and these more recent reports adds volumes of data on immigrant labor
NAHB’s Jan 2018 Report on Immigrant Labor in Construction
Pew – U.S. Unauthorized Immigrant Total Dips to Lowest Level in a Decade NOV 2018
Unemployment and productivity includes only jobs counted in the official U.S. Census Bureau of Labor Statistics (BLS) jobs report. Both these reports document a large, unaccounted for shadow workforce in construction. By some accounts, 40% or more of the construction workforce in California and Texas are immigrant workers. Immigrants may comprise between 14% and 22% of the total construction workforce. It is not clear how many within that total may or may not be included in the U.S. Census BLS jobs report. However, the totals are significant enough that they would alter some of the results commonly reported.
The best way to see the implications that the available data do show is to look at productivity. The simplest presentation of productivity measures the total volume of work completed divided by the number of workers needed to put the volume of work in place, or $Put-in-Place per worker. In this case, $ spending is adjusted for inflation to get a measure of constant $ volume, and jobs are adjusted for hours worked.
As the Residential jobs deficit increases vs workload, this plot shows that $PIP is increasing. That makes sense. The workload continues to increase and the jobs growth is lagging, so the $PIP per worker goes up. For Nonresidential Buildings, the rate of hiring is exceeding the rate of new volume and therefore the $PIP is declining.
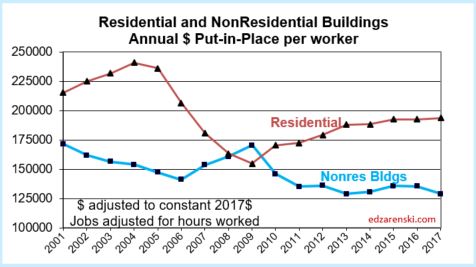
In boom times, residential construction adds between 150,000 and 170,000 jobs per year and has only twice since 1993 added 200,000 jobs per year. In the most recent several years expansion, residential has reached a high of 156,000 jobs in one year but has averaged 130,000 per year over 5 years. So it’s pretty unlikely that we are about to start adding residential construction jobs at a continuous rate of 200,000+ jobs per year.
If residential jobs growth were to increase by 50,000 jobs per year over and above current average growth, it would take 6 to 8 years to wipe out the jobs deficit in residential construction.
This problem is not going away anytime soon.
For more history on jobs growth see Is There a Construction Jobs Shortage?
For more on the imbalances of Res and Nonres jobs see A Harder Pill To Swallow!
For some hypotheses as to why nonresidential imbalances continue to increase see Construction Spending May 2017 – Behind The Headlines
2018 Construction Spending – Briefs
1-26-18 updated 3-5-18
Dodge Data posted December construction starts on 1-25-18, showing total starts increased 3% from 2016. However, this compares unadjusted 2017 starts to upwardly revised 2016 starts. Starts are always revised upward in the following year. I expect revisions will show 2017 starts increased by more than 6% over 2016. January starts, released 2-22-18 dropped 2% from December, but Residential starts hit the highest SAAR$ in 11 years and total starts SAAR$ went over $725 billion for 6th time in the last year and the only times since 2007.
Total starting backlog for 2018, currently at an all-time high, has increased on average 10%/year the last three years. 80% of all Nonresidential spending within the year will be generated from projects in starting backlog.
Total All 2018 construction spending is projected to increase 8% to $1.330 trillion.

Spending measured in current 2018$ will reach an all-time high, however, measured more appropriately in constant inflation adjusted dollars, will still come in 14% below the 2005 high. When comparing inflation adjusted constant dollars, 2018 spending is still lower than all years from 1998 through 2007.
In constant inflation adjusted dollars, which more closely reflects volume, 2018 Infrastructure spending will reach a new high but nonresidential buildings is still 4-5 years away from a new high and residential spending is 6-8 years from a new high.
Read more about Constant Dollar Construction Growth
Non-building Infrastructure starts in 2017 are down 2%. However, we can expect post-year revisions to infrastructure starts. I expect, when all revisions are posted, that 2017 will show infrastructure starts increased a few percent from 2016. Starts peaked in 2015 and are still near that high-point. 2018 starting backlog is the highest ever, up 10%+ each of the last 3 years. Spending reached an all-time high in 2015 and stayed within 0.3% of that high for 2016. Although 2017 shows a spending drop of 3.6%, spending is also prone to large upward revisions, particularly in Power, the largest market in Infrastructure. Starting backlog is up 25% in the last two years. Spending for 2018 is projected to increase 8% to an all-time high.
Transportation terminals 2017 new starts jumped 120%. Rail project starts increased more than 100%. Starting backlog for all transportation work, including terminals, runways, rail and dock work is the highest ever, up 80% from 2017, up 100% in the last two years. Spending has been within few % of the 2015 all-time high for 4 years. Spending is projected to increase 20-25%/year for the next two years.
Power plant new starts are down for the 2nd year but had hit an all-time high in 2015, up nearly 150% from 2014. Pipeline starts were up more than 125% in each of the past two years. Starting backlog for all power projects has nearly doubled in the last three years. Spending is projected to increase 5% and 7% in 2018 and 2019.
Highway spending is not projected to change by much, up only 2% in 2018, but it has been within a few percent of the all-time high for the last three years. Backlog from new starts has increased on average 6%/year for the last four years.

Nonresidential Buildings new construction starts in 2017 are up 7%. When all revisions are in, I expect that to climb over to 10%. Total starts for the last 6 months are 10% higher than any time since 2007. Starts are up 60% in four years. 2018 starting backlog is the highest ever, 10% above 2008, up 15% from 2017. Spending for 2018 is projected to increase 8% to 9%.
Office new starts hit an all-time high in 2016 and just missed surpassing that mark in 2017. Starts increased on average 22%/year from 2013 through 2016, but 2017 starts dropped 2%. Starting backlog increased dramatically during that 2013-2016 growth period and backlog is up 50% in the last two years. Spending followed with three years of growth over 20%/year from 2014 through 2016. The 3% spending growth currently recorded for 2017 is an unexplained anomaly. All other data indicates 2017 spending should have followed the pattern set in 2014-2016. Spending in 2018 is forecast to climb 8% and 2019 could increase 12%.
Educational new starts hit an eight year high in 2016 and increased another 6% in 2017. Total new construction starts for the last 6 months are 13% higher than any other 6-month total since 2008. Starting backlog has increased 10%/year for the last three years. The last three years we’ve seen spending increases of 6%, 5% and 3%. For 2018, spending is projected to increase 14%, the strongest growth since 2007.
Healthcare starts jumped 13% in 2016, the first significant increase in nearly 10 years. 2017 starts maintained even level with 2016. Coming into 2018, starting backlog is up 16% over the past two years, a sign for slow moderate growth. 2017 is the first time in 5 years Healthcare spending increased, up 4.3%. For 2018, spending is projected to increase 4%.
Manufacturing posted several very large project starts in 2017, increasing total starts 20% over 2016. This increased starting backlog 8% for 2018. Although still well below the banner years of 2015 and 2016, spending is projected to increase 12% in 2018 and 10% in 2019.
Amusement/Recreation new starts increased only 5% in 2017, but that follows a 30% increase in 2016, to reach a new high in 2017. New construction starts for the last 6 months is the highest 6-month total new starts ever recorded, 1/3rd higher than any time in last 10 years. This will help drive Amuse/Rec spending to double digit growth next two years. Starting backlog has doubled from 2014 to 2018. Spending increased only 5% in 2017 but spending is up 40% in the last 3 years, also reaching a new high in 2017. Spending is forecast to increase 20% for 2018 and 15% in 2019.
This spending category includes sports stadiums which by some accounts may fall 40% in 2018, but that is hard to envision, considering the record new starts over the last 6 months. Sports stadiums is 1/3rd of Amuse/Rec so that would lower my forecast by about 10%. I’m sticking with my forecast.
Lodging experienced six consecutive years of massive growth in starts and spending after losing 75% of its pre-recession market. Starts grew 30%/year from 2011 through 2016. In 2017 starts posted a decline of 5%. Spending averaged 25% growth from 2012 through 2016, but posted only 7% growth in 2017. Backlog is still up slightly to start 2018. Spending is projected to come in at 8% growth for 2018. But backlog drops off 15% for 2019 and spending is expected to follow suit.
Commercial construction is being supported by new starts for warehouse construction which have increased seven consecutive years. In 2010 warehouse construction was only 20% of this market. From 2010, stores grew 50% to a peak in 2015, but warehouses grew 500% to peak in 2017 and are now 50% of the total market. Warehouses are increasing and stores are declining. In 2018, warehouses will make up 60% of the market. Total commercial starts for 2018 will remain equal to 2017 and 2016. The years of big backlog growth occurred from 2012 to 2017. Backlog remains constant from 2017 to 2018 and declines slightly in 2019. After 6 years of spending growth averaging more than 12%/year, spending will increase by only 4% in 2018 and 1% in 2019.
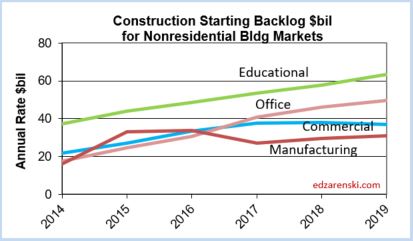
Public share of new construction starts are up only 10% in 3 years. But due to long duration job types, 2018 starting backlog is up 30% in the last 3 years. In 2018, 40% of all spending comes from jobs that started before 2017. Leading 2018 spending growth are Educational and Transportation with a combined total forecast 20% growth. Expect 2018 public spending to increase 6% to 8%, the best growth in 10 years.
Residential spending is more dependent on new starts within the most recent 12 months than on backlog from previous starts. New construction starts for January 2018 are the highest in 11 years. Total starts for the last 6 months are the highest since 2006. Residential starts in 2018 are projected to increase 7% over 2017, almost all of that coming from new single family starts. Residential spending in 2018 is projected to increase only 6% after five years of increases over 10%.
See also
In What Category is That Construction Cost? explains where some specific costs are carried, which may vary between sources. Take particular note of Transportation, Office and Commercial.
Starts Trends Construction Forecast Fall 2017 for a much more thorough handling of the starts forecast.
Indicators To Watch For 2018 Construction Spending?
Spending Summary Construction Forecast Fall 2017
Cautions When Using PPI Inputs to Construction!
The Producer Price Index (PPI) for material inputs to construction gives us an indication whether costs for material inputs are going up or down. The PPI tracks producers’ cost to produce the product and supply finished products to retailers or contractors. However, that is far from the total cost from the contractor.
A good example is steel. The producer price for steel from the mill might be $750/ton for long beams and columns. The only increases captured at the producer level might be the changes in cost for raw material, energy to manufacture and the producers labor and markup. But the structural steel contractor is then responsible for delivery to shop, detailing, shop fabrication, transport to construction site, load and unload, cranes and welding equipment needed to install, installation crews and finally overhead and profit accounting for at least eight more points of potential cost change. Finally the steel subcontractor must then assess the market conditions, whether tight or favorable to higher profits, to adjust the bid price or selling price. The final cost of steel installed could be $3000/ton.
The PPI for Construction Inputs IS NOT a final indicator of construction inflation. It is an input to construction inflation. It does not represent the selling price, nor does it give any indication of the trend, up or down, of selling price.
In 2009 PPI for inputs was flat but construction inflation, as measured by final cost of buildings, was down 8% to 10%. In 2010, the PPI for construction inputs was up 5.3% but the selling price was flat. Construction inflation, based on several decades of trends, is approximately double consumer inflation. However, from mid-2009 to late 2012, that long-term trend did not hold up. During that period, PPI ranged from 0% to +6.8%, but construction inflation/deflation ranged from -10% to +2.3%, lower than PPI for all four years, something which seldom occurs. Construction inflation/deflation was primarily influenced by depressed bid margins, which had been driven lower due to diminished work volume.
The following table shows the differences between the PPI Inputs from 2011 to 2017 and the actual inflation for the major construction sectors. This table shows clearly that PPI Inputs and Inflation not only can vary widely but also may not even move in the same direction.
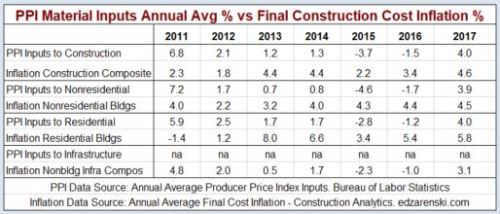
The PPI tables published by the Bureau of Labor Statistics do include several line items that represent Final Trades Cost or Whole Building Cost. Those PPI items don’t give us any details about the producer price or retail price of the materials used, but they do include all of the contractors costs incurred, including markups, on the final product delivered to the consumer, the building owner. I would note however that those line items in the PPI almost always show lower inflation than final Selling Price inflation indices developed separately from the PPI. Follow this link to table of inflation values which includes the PPI final cost for trades and buildings.
Construction Managers responsible for working with the client to manage project cost, part of which includes preparing a full building cost estimate, should not rely on PPI values as an indication of inflation. Selling price inflation indices are more appropriate indices to use to adjust project costs.
It is always important to carry the proper value for cost inflation. Whether adjusting the cost of a recently built project to predict what it might cost to build a similar project in the near future, or answering a client question, “What will it cost if I delay my project start?”, the proper value for inflation (which differs by sector and differs every year) can make or break your estimate.
Contractors responsible for a particular building material, although the PPI Inputs will not track market conditions sale prices from producer to the contractor, can get some indication of whether material prices are rising or falling. Contractors should be aware of PPI trends to interpret the data throughout the year.
PPI TRENDS HELP TO INTERPRET THE DATA
- 60% of the time, the highest increase of the year in the PPI is in the first quarter.
- 75% of the time, two-thirds of the annual increase occured in the first six months.
- In 25 years, the highest increase for the year has never been in Q4.
- 60% of the time, the lowest increase of the year in the PPI is in Q4.
- 50% of the time, Q4 is negative, yet in 25 years the PPI was negative only four times.
So when you see monthly news reports from the industry exclaiming, “PPI is up strong for Q1” or “PPI dropped in the 4th Qtr.” it helps to have an understanding that this may not be unusual at all and instead may be the norm.
PPI Construction Materials Inputs Index