Construction Spending April Data
6-1-2016
Total Construction Spending year-to-date is up 8.7% over Jan-Apr 2015. Spending declined in April 1.8% below March. Every major sector declined from a March value that was revised upward by +1.6% to the highest monthly spending since 2007.
Often the month to month change does not reflect the long term trend. For example, for February and March combined spending was up 3%, a trend if carried out for the full year would indicate annual growth of 18%, a level never achieved. So a decline in April is not too unusual. Including April, three of the last five months were up. The 3 month avg is up 1.8% from the previous 3 months, at its highest since mid 2007 when spending was still near the 2006 peak.
Residential spending for April is down 1.5% by Census SAAR, but that is after a strong March. Year-to-date Jan-Apr compared to 2015 is up 9.1%. The current 3 month average is at its highest since the 2nd half of 2007 and is up 3.5% over the previous 3 months.
Total Nonresidential spending for April is down 2.1% from March by Census SAAR, but that is after a March that came in just 2% below peak pre-recession spending measured in the 1st quarter of 2008. Year-to-date Jan-Apr compared to 2015 is up 8.5%. The current 3 month average is at its highest since the Q1 2009, which was still near the pre-recession peak, and is up 2.8% over the previous 3 months.
Nonresidential Buildings spending year-to-date is up 9.8% over 2015. The current 3 month average is at its highest since Mar-Apr-May 2009 and is up 3.5% over the previous 3 months. Spending on Nonres Bldgs peaked in 2008 and remained near that peak until March 2009. We are on track to regain peak spending by Q3 this year.
- Commercial and Office construction spending are both 5% ahead of year-to-date predicted. If both finish the remaining months of 2016 as predicted, then expect 2016 growth of +9% and +16%.
- Lodging construction spending 5% ahead of year-to-date predicted. If finishes as predicted, expect 2016 +25%.
- Manufacturing construction spending 5% below year-to-date predicted. If finishes as predicted, expect 2016 only +3%.
- Power construction spending 10% above year-to-date predicted. If finishes as predicted, expect 2016 down only -3%.
Nonbuilding Infrastructure spending year-to-date is up 6.5% over 2015. The current 3 month average is up only 1.4% over the previous 3 months. However, spending on nonbuilding infrastructure has been tracking near all-time highs for most of 2014 and 2015. It peaked in early 2014 and again in mid 2015. We may exceed both those peaks in the next 4 months.
Construction Starts lead spending. Starts data is from Dodge Data & Analytics. Early 2015 had elevated levels of new starts in every sector. Although the level of starts has declined since then, the long term trend is still up, so that means the rate of increase in spending may slow, but not decline. I see no indication at this time to expect a decline in long term spending. I previously predicted spending would temporarily slow or drop in early 2016 and I think we have seen that. At this time, I still expect total spending in 2016 to exceed 10% growth. Strong data needed to verify 2016 total spending prediction will be available when we get June spending (August 1 release). At that time we will have a much better indication of what to expect for all of 2016.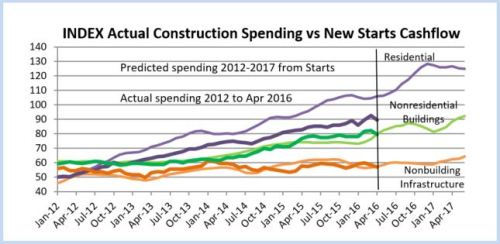

Trump’s Wall
5-22-16 updated 1-7-19
Trump’s Wall
Recently I received a call from a major national news source. They asked for help understanding what it would take to build “Trump’s Wall.” I’m an estimator, so I provided some realistic analysis of what it would take.
The border with Mexico is almost 2000 miles long. There is already about 700 miles of fence. This analysis makes an assumption it would be necessary to build only 1000 miles of wall. Also, this estimate is based on the type of wall you see along highways, precast concrete sound and site barrier wall. In reality it would need to be significantly more robust than the typical highway sound-barrier wall, and I’ve taken that into consideration in my estimate. So here goes.
(9-1-16 >>In some other recent articles I’ve read they have suggested a 40 foot high concrete wall. Well, I don’t think you can build a 40 foot high unsupported concrete wall (no bracing at sides) without getting into extremely massive volumes of materials. Such a high concrete wall would need to be much thicker at the base than at the top and the foundation to prevent overturning would need to be massive. Typical rule of thumb for foundation to prevent overturning is the foundation needs to be ~40% as wide as the height of the wall. The volume of concrete would be 4x to 5x what I’ve estimated for the wall I’ve defined here and the excavation, back fill and formwork would add considerable time to complete. Order of Magnitude I guess 40 to 50 million cubic yards of concrete for wall and foundation. I would roughly guess such a massive poured concrete foundation and wall, if it could even be built, would cost THREE TO FOUR TIMES what I’ve estimated here and would require substantially more labor and might take twice as long or more to build.)
This estimate is based on 8″ thick precast heavily reinforced concrete wall panels set between steel columns 12’0 on center. Even if the concrete could be chipped away, the reinforcing bars would prevent passage. Columns are set in 6’0 dia. x 10’0 deep column foundations. Between column foundations under the wall is a continuous footing to help resist overturning of the wall. The wall extends 25 feet above grade and 5 feet below grade. Bottom of concrete footing under the wall is 7’0 feet below grade. Bottom of column foundations is 15’0 below grade. The wall would be much higher than the approximate 12′ shown in the representative photo.
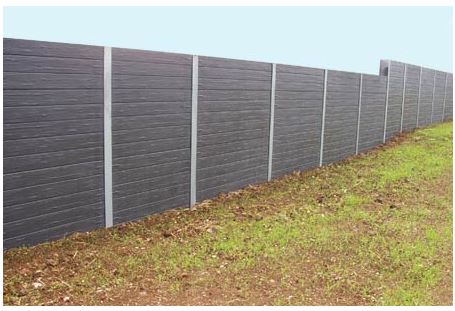
The foundations included here are based on up-sizing components from a known design for a 15′ high prison un-climbable open-mesh fence. Even with an open mesh fence design, to overcome wind load, column footings were 2″0″ dia x 8’0″ deep concrete post foundations set every 8′ apart. This solid wall 25′ high would have enormously greater wind loads and it is the foundation that must be designed to prevent overturning.
Just to get quickly to the end, I calculated the final cost of a 25′ high precast wall, foundations, excavation and access roads in the vicinity of $25 billion (in 2016 $), $10 million per mile or slightly less than $2,000 per lineal foot of wall. I’m fairly certain this estimate is somewhat low and the actual cost due to the many unknowns would be higher. At the end I’ve pointed out some of the issues that could generate unknown costs.
One huge factor is inflation. Historical average construction inflation is greater than 4%/year. If a $25 billion wall takes 10+ years to build, the total cost over time assuming the historical average construction inflation would be $30 billion.
This is a summary of some of the results from the concrete wall estimate.
Materials
200 million square feet of precast concrete panels = 5.2 million cubic yards of concrete
5 million cubic yards of cast-in-place concrete foundations
Total cement to make the 10.2 million cubic yards of concrete = 2% of annual US cement production.
1.5 million tons of steel = 1.5% of annual US steel production.
25 million cubic yards of excavation required.
6 million cubic yards of that excavated earth must be hauled away and disposed since that volume will be replaced underground with concrete. That’s more than enough to completely fill the Superdome. Or, it’s enough to build a 20 foot wide earthen embankment 20 feet high and 100 miles long.
Delivering the Materials
250,000 truckloads of precast wall panels,
500,000 truckloads of ready mix concrete
50,000 truckloads of steel
200,000 truckloads to haul away excess excavated earth.
This is far from a complete list of materials, because in addition to building the wall, in some places you first need to build a road. Assume about 500 miles of road. You can’t get 1,000,000 truckloads of 30-40 tons each, cranes, excavators and auger drills to a construction site without at least building a compacted gravel road to get there.
Adds 2 million cubic yards of stone for construction equipment road.
Adds 100,000 truckloads of stone
Labor
It takes 5000 to 6000 workers to build $1 billion worth of construction in 1 year.
$25 billion x avg 5500 = 135,000 man-years, or 135,000 workers if it is to be built in 1 year. Or it would take 10,000 full-time workers 13.5 years to build this concrete wall.
If 1,000 men worked on the wall 5 days a week 8 hours a day, it would take 135 years to build it. Therefore, I made the assumption the project would be broken into 50 segments each 20 miles long and looked at two scenarios. What labor would be required to build it in 10 years or 4 years?
4 years: That will require 700 men AT EACH of 50 SEGMENTS concurrently to complete the wall in 4 years. That’s 35,000 men working for 4 years. That is 35,000 trades-worker jobs which does not include Architect, Engineering, Testing and General Contractors management personnel.
1,100,000 truckloads at 50 locations over 4 years is = 20 deliveries per day of 30 to 40 tons each at each of the 50 locations. That works out to 40 truck bypasses per day coming and going, so 30 ton trucks go by (some community) every 12 minutes at every one of 50 locations every workday for 4 years. It is very likely that heavy truck traffic will destroy many if not all the town roads used to access the 50 construction sites. The cost to repair/replace those existing roads is NOT included here, but I suspect it would be in the hundreds of millions.
The 4 year scenario is quite unlikely from just about every standpoint. Labor availability, engineering studies and site preparation of 50 (or more) job sites, mobilization of 35,000 men to 50 job sites, product supply, frequency of deliveries, overcrowding of job site. In reality, 700 men at a job site is probably far more than can be managed. In this scenario the number of job sites would need to be increased, probably to more like 150 to 200 individual job sites. While all aspects seem to limit this choice as viable, it is probably labor and material availability that would have the greatest impact.
10 years: To build the wall in 10 years would require 13,500 workers, or about 250 workers AT EACH of 50 SEGMENTS concurrently to complete the wall in 10 years. That’s 13,500 workers working for 10 years. That is 13,500 trades-worker jobs including General Contractors management personnel but not including Architect, Engineering, Testing, Manufacturing and Delivery.
1,100,000 truckloads at 50 locations over 10 years is = 8 deliveries per day of 30 to 40 tons each at each of the 50 locations. That works out to 16 truck bypasses per day coming and going, so 30 ton trucks go by (some community) every 30 minutes at every one of 50 locations every workday for 10 years. The same heavy truck traffic will destroy many if not all the town roads used to access the 50 construction sites, it just takes longer. The cost to repair/replace those existing roads is NOT included here.
The 10 year scenario is certainly not impossible. Labor availability and mobilization issues are reduced as are product supply and frequency of deliveries.
NOTE 1-7-19 New review of proposed steel barrier changes some materials and has a moderate overall affect on total cost, manpower and time to complete. In question is size of steel section that could withstand installation 25′ to 30′ tall unsupported. For a steel barrier estimate I used tube steel hollow structural sections (HSS) 8x8x3/8 set with 6″ spaces between. The summary from the estimate revises precast panels to 3 million tons of steel. The remainder of the summary is still valid. It changes a little. Total cost came in near $24 billion versus the original estimate for precast concrete wall at $25 billion. However if design would require a heavier section 8x8x1/2 then cost jumps to $29 billion. If design requires concrete filled tubes cost would go up by about $750 million. If 8×8 tubes are rotated 45 degrees, spacing can be reduced and open spaces between tubes can be reduced, steel cost would go down by about $1 billion. Foundation cost may or may not be reduced (by as much as $2 billion), but foundation design to prevent wall overturning is more dependent on wind load than on the weight of the steel above. In any case foundations are massive and still calculate out to about 5-6 million cubic yards of concrete and proximity of concrete batch plants to construction zones could be a major issue. Keep in mind none of this cost includes land acquisition, inflation, housing workers, change orders or building new plants to support job sites with materials.
Best case scenario, at the low end of cost at $22 billion, it would take 10,000 men 11 years to build 1000 miles of steel fence barrier. It is likely that the low end estimate is much to optimistic, citing some issues outlined below.

A word about HSS steel tubes. US annual production for Hollow Structural Sections in 2016 was 1.6 million tons per year. That annual demand does not go away if 3 million tons of tube steel is needed for a wall. Over a period of 10 years, at 0.3 million tons/year, steel needed for a wall would be 20%/year of tube steel production. To prevent shortages, production capacity must increase or that extra tube steel must be imported. The US imports about half of all the steel pipe and tube is uses in a year from South Korea, but most of that is oil industry pipe. Manufacturing mills typically cannot increase capacity by 20% in a year. So, this extra demand for tube steel would either cause shortages or increase imports.
Energy cost just to produce 3 mil tons of steel is enough to power 500,000 homes for 1 year. Energy to produce both steel and concrete probably more than doubles that number.
The money spent is enough to build 70,000 new homes or 500 new high schools.
Gasoline just for all truck deliveries is near 5 million gallons.
The concrete and steel materials gross to 2% of annual US cement production and 1.5% of annual US steel production (for a precast wall), but that represents close to 3% of steel used in construction. (The revised steel barrier reduces precast but increases the steel to 4% of US steel production. It represents 200% of annual tube steel production). About half of all US steel goes into your refrigerators, cars, etc., the other half goes into construction. The materials demand has far more affect than you might think on disrupting normal construction flow. Since it is all localized in one area of the country, the far southwest border, it could potentially represent 20% and 30% of the construction materials capacity in that area of the country, straining the capacity in that area and disrupting the normal volume of construction there for years. This would be detrimental to the rest of the construction industry growth in that area for that period.
This does not address the fact that manufacturing facilities to produce and fabricate the steel and deliver concrete needed at each of the 50 work sites ideally should be spread along this 1000-mile corridor, which is very unlikely. In fact, I suspect it more likely that some locations will not be in close proximity to a materials source, the result either driving cost up or extending duration beyond 4 years, or both. It could require building process plants along the path, for instance, ready-mix concrete batch plants and steel fabrication yards.
The time necessary for land acquisition, design, permitting, environmental study, mass material procurement, construction process planning and mobilization would be many months before construction begins. Although labor availability and the number of sites determines construction duration, 4 years would be a reasonable estimate for construction ONLY IF the 35,000 trades-workers needed can be mobilized simultaneously to 50 job sites, but that is not likely. The 4 years of construction starts when planning, design and permitting are complete. That might take 6 to 12 months.
Construction is experiencing what may be the tightest labor market in over 20 years. Since there are few if any available workers to shift to these new job site locations, we would need to assume much of this work is supported by creating nearly 35,000 new jobs. I looked at the Bureau of Labor Statistics Jobs for metropolitan areas within 100 miles of the border. Several serious problems arise.
In this localized area of the country, along a 1000 mile long 100 mile wide strip, 35,000 construction jobs could potentially be 12% to 15% and possibly as much as 20% expansion of the construction workforce. The maximum 30 yr historical rate of annual construction workforce expansion is 6% nationwide. Normal annual jobs growth is 3% to 4%/year. If one project were absorbing all of the jobs growth in an entire region, there would be no workers available in that region for any other construction activity growth for several years. That’s a major disruption to the local economies of several states.
Such an expansion would be extremely difficult to implement that quickly. The mobilization of 35,000 workers could take a very long time from initial ramping up to full employment, therefore extending the duration to complete the job. Many of these workers could be inexperienced adding further to the project duration. So reaching completion of this work with 35,000 workers would probably take much longer than 4 years. Adding time for planning and more time for ramping up labor, it could be 6 years.
Ramping up then down will soften the blow as the jobs begin to disappear at project completion. It could be pretty hard to generate enough new volume of work to keep all those men working. It will take new volume of $5 billion to $6 billion a year to keep all these workers working.
There’s a great deal to consider about the demand on the workforce to build a border wall, or fence. Let’s look just at Texas. In Texas, there are a total of 775,000 construction workers, the 2nd largest construction workforce in the country next to California. But checking all the major metropolitan statistical areas within 200 miles of the border there are only about 100,000 construction workers. Only about 20% of those workers conduct business in earthwork, concrete and steel, the trades required to build this fence. That’s only 20,000 workers available within 200 miles of the border.
Furthermore, the Texas/Mexico border is 1,250 miles long. If 20,000 workers were spread out evenly along the border (which is most certainly not the case), within any 200 mile stretch and within 200 miles inland, there would be only 3,200 available workers. In some well-populated areas there might be double that, approximately 6,000 workers, but in the less populated areas, there are far less than 3,000 workers within 200 miles of a proposed work zone.
Now let’s assume we need enough workers to build 100 miles of steel fence, somewhere within a 200-mile length and near a well populated area. That’s $2.5 billion of fence. We know that it takes about 5,000 workers a year (5,000 worker-years) to put-in-place $1 billion of construction. So, we need to fill 12,500 worker-years or job-years. That could be 12,500 jobs for 1 year or 1,000 jobs for 12.5 years. How many jobs get filled determines how long it will take to build 100 miles of fence. Well, there are nowhere near enough workers to fill 12,500 jobs to build 100 miles of fence in one year along many sections of the border. In the best case, most of 6,000 workers need to be accommodated with living quarters somewhere along a 200-mile stretch and 12,500 work/years divided by 6,000 available workers means it would take a little over 2 years to build 100 miles of fence.
So, 100 miles of fence would take over 2 years to build, ONLY IF this project could absorb every single available worker in these trades within 200 miles for a period of two years. At the same time, for that 2-year period, there would be no available workers in sitework, concrete and steel trades anywhere else within 200 miles to fill all other normal workload. In less populated areas with only half as many workers available, it would take twice as long, or more.
This brief analysis of cost and constructability does not begin to address issues such as, how would a wall be built anywhere along the 1,000 miles of the Rio Grande river, the border between Texas and Mexico, the 4th largest river in the United States. Assuming such a wall must be built on US soil, a wall would then completely cut off river access from the United States? Or, how would a wall be built through the hundreds of miles of national parks and national wildlife refuges along the border without disrupting natural wildlife migration flow? And, how would it be designed along its 1,000 mile corridor to accommodate drainage across a solid impervious barrier? It seems impractical or at the very least massively environmentally disruptive.
You can see, the logistics would be enormous, impediments loom, adjacent communities would be adversely impacted, the cost is probably far more than the $25 billion estimated and it seems highly unlikely this could ever be completed during the course of a single president’s term.
1st Quarter 2016 Construction Spending and Forecast
5-2-16 March construction spending was released today. Spending is UP 9.1% year-to-date vs 2015 http://www.census.gov/construction/c30/pdf/release.pdf
Year-to-date gains are led by nonresidential buildings up 11.3%, followed by non-building infrastructure up 8.6% and residential up 7.5%.
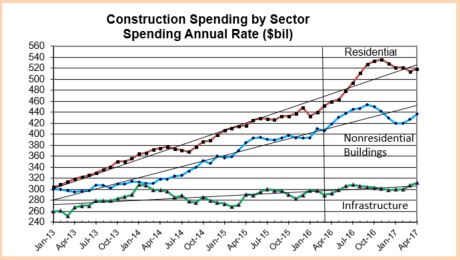
This plot, Construction Spending By Sector, shows actual spending (SAAR) through March 2016 and projected spending to April 2017.
The biggest percentage growth year-to-date gain is multifamily housing ,up +31%, although Residential combined is up only 7.5%. Other growth, Lodging +30%, Office +22% and Highway +21%.
- Residential year-to-date spending:
- $ volume changes; SF +11.2%, MF +31%, Reno -7.3%.
- Market share; SF 55%, MF 16%, Reno 29%.
The biggest $ volume gain through March is Residential +$6.4b, which includes a decline in renovation work. Single Family is up +$5.0b and Multifamily is up +$3.4B. Office +$2.6b, Highway +$2.5b and Educational +$2.1b. Although lodging is up 30%, its market share is small and its $ volume is up only $1.3b.
Residential spending has completely recovered from a 4% decline in January. Projected growth of 20% from now through the 4th quarter will help residential spending reach a total 15% growth for 2016.
Nonresidential buildings spending climbed 4% in the last two months from the stalled range that remained nearly flat from May 2015 through January 2016. Growth may peak this year in the 3rd quarter before dropping into year end, but may still reach a total 12% growth for 2016.
Infrastructure spending has meandered along the $300 billion mark since last May and is expected to stay there through 2016. Expect only slight growth of 4% in infrastructure spending in 2016, contributed mostly by Highway and Street.
All sectors may experience a decline in spending before year end, but all are expected to return to growth leading into 2017.
Total construction spending in 2016 should reach $1.220 trillion, up 11% from 2015. 2014 through 2016 will be the strongest 3-year growth on record in both percentage gain (+34%) and $ volume gain (+$314 billion). Only 2003-04-05 comes close.
Later, a comparison of inflation adjusted (constant) dollars. The results will be different. I’m estimating particularly high rates of inflation, so inflation reduces the gain in real constant volume from the spending projections by a lot in 2016.
Construction Spending vs Dodge Starts vs New Housing Unit Starts
Read my last few blogs and all of this is detailed, but this is worth a look.
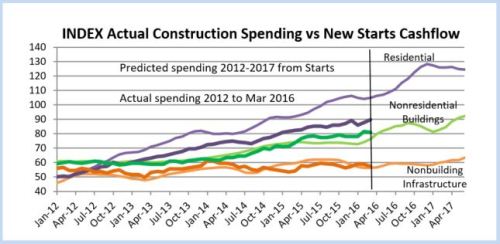
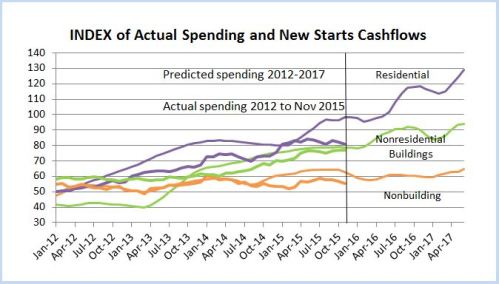
Dodge Data Construction Starts cash flowed shows a predicted spending pattern.
Actual spending is shown to compare to the prediction.
For another residential input we have new housing starts. Here I’ve spread activity out from start to completion like a cash flow to get monthly activity. History compares to actual spending and future compares to Dodge New Starts cash flow.
The time flow of activity generated by housing starts is much more important than the monthly starts themselves. It prompts us to look at a much longer term trend of housing starts than just whether they have moved up of down in the last month or quarter.
Modeling for nonresidential buildings and non-building infrastructure appears more accurate than residential. It looks like my prediction of cash flow from Dodge residential starts needs to move 2-4 months to the left.
5-4-16 The cash flow plot for residential has been revised to use a different duration for SF vs MF vs Reno.
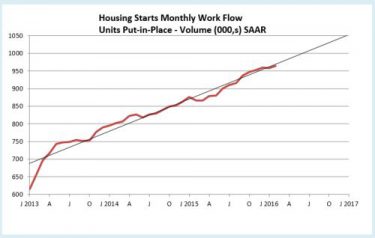

Residential Work Flow From Housing Starts
Housing starts can be erratic. It’s not unusual to see monthly housing starts fluctuate up or down by 10%, sometimes 20%. But what affect does this have on the flow of housing work? Not as much as you might think.
Although housing starts is in units, not dollars, we can create a “cash flow” to see how the new starts generate activity over future months. To see the flow of work I’ve created a simple time flow of starts to show the activity generated for new housing starts.
About 2/3rds of housing starts are single family units. These might have a construction duration ranging from 6 to 9 months. The remaining 1/3rd of starts are multifamily units. Those could have construction duration of anywhere from 8 months to 16 months and in some cases longer. For this simple analysis I’ve used a work flow duration of 2/3rds at 7 months and 1/3rd at 17 months. Varying the duration longer or shorter by a few months will not have a big effect on the outcome. It changes the slope of the growth rate but does not change the consistency of the growth pattern.
A time flow of housing starts shows growth rates of; 2013 +13%; 2014 +10%; 2015+12%. Actual construction spending shows growth of 2013 +19%; 2014 +14%; 2015+13%.

The chart above, “Housing Starts Monthly and Trend” shows the actual monthly starts values and a three month moving average. Monthly starts periodically peak and dip erratically. Look at February 2015, the biggest dip in 5 years. The 1st quarter 2015 was down 7% qtr/qtr. But then notice it took less than 4 months for starts to come right back to the trend line and the trend remained intact. 2015 finished up 11%. This is how the monthly housing starts (# of units) data goes.
The “Work Flow” chart plots the actual work load out over time from the month the work started to completion. The total work flow in any given month is the sum of the work contributed from starts in previous months that have yet to be completed. Residential work flow has averaged +12% for the last 3 years. In 2015, growth was 14%. The very steep climb in early 2013 activity reflects work generated from the 28% rise in new starts in 2012, the largest % increase in new starts in 30 years.
Starts in any given month have only a small % impact on the slope of change in every succeeding month until completion. This is the same concept as cash flow. Construction spending in any given month is the sum of all the ongoing projects from all previous months.
This next plot shows the same workflow, only Not Seasonally Adjusted, so it shows the winter dips in activity and the steeper rate of growth during the more productive months. Although the average slope of growth is similar to the SAAR plot, this shows the real total work activity in any given month varies from that shown by the SAAR plot. However, it is not erratic like the starts plot, it is smooth and repetitive year after year.

It would take a dramatic change in housing starts to significantly alter the progress of work flow and it would need to be a sustained change in starts. If a 20% decline is offset by an corresponding increase in the following month or months, then the future months of work flow will show little affect from the decline.
Construction Expectations 2016
4-6-16
What should we expect in 2016 for construction spending, jobs and cost?
Nonresidential buildings starts (as reported by Dodge Data & Analytics) were well above average from March 2014 through May 2015 but since then have been below average. It takes about 24 to 30 months for nonresidential building starts to reach completion. The effect of below average starts will kick in at the end of this year after strong spending growth.
Non-building infrastructure starts jumped 50% above average from November 2014 to peak in February 2015, then settled back to average in July of 2015. Those very strong starts in early 2015 will be spread out over 4 to 6 years so will not cause spending to spike. They will help support a slow steady increase in spending over the next two years.
Residential starts averaged near 20%/yr growth for 3 years but dropped below average for the entire 2nd half of 2015. That late 2015 dip in starts may not slow residential spending too much until the end of 2016. Overall, the data shows another repeat year of growth similar to the last three years.

2015 Construction spending finished the year up 10.6% over 2014. After 3 years of growth averaging 9%/year, 2016 total construction spending could climb 11% above 2015, the largest percent gain in over 10 years. Any construction spending slowdown is temporary, baked in from old uneven starts causing uneven cashflow, soon to be ending. By the 2nd quarter 2017 all sectors return to positive growth for strong spending in 2017.
Nonresidential buildings construction spending went from zero growth in 2013 to 9% in 2014 and took off to hit 17% growth in 2015. Nonres bldgs spending could reach 12% growth in 2016 and 7% in 2017.
Infrastructure spending will increase a little in 2016 but we won’t see a sizable increase of 8% until 2017.
Residential spending averaged over 15%/year for the last 3 years and could go over 15% growth in 2016, combining for the best four years of spending growth since 2002-2005.
Don’t be mislead by news that construction spending is close to reaching the previous highs. That may be true of spending, but spending is not the measure of expansion in the construction industry. The measure of expansion is volume, spending minus inflation.
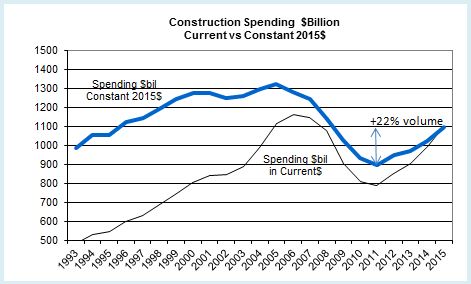
Construction spending is up nearly 40% off the 2011 lows and within 5% of the 2006 highs. But after adjusting for inflation, volume is up only 22% from the 2011 lows and is still 17% below 2005 peak volume. We still have a long way to go. While spending is predicted to reach over 11% growth in 2016 and may do the same in 2017, volume will increase only 5% to 6% each year. The rest is due to inflation.
March 2016 construction jobs increase 37,000 from February and although up and down, have averaged 37,000 jobs per month for the last 6 months. That is the highest 6 month average growth rate in 10 years. That certainly doesn’t make it seem like there is a labor shortage. However, it is important to note, the jobs opening rate (JOLTS) is the highest it’s been in many years and that is a signal of difficulty in filling open positions.
To support the expected 2016 volume growth we need an average 25,000 new jobs per month in 2016, 300,000 new jobs, reaching a three-year gain of nearly 1 million jobs for the period 2014-2016, the highest three-year total jobs growth since 1997-1999. The labor force hasn’t expanded this fast in over 16 years. That can have some undesirable consequences. Rapid jobs growth may result in accelerating wages and lost productivity, compounding the cost to labor.
4-6-16
If we get a construction jobs slowdown in the next few months, it’s not all due to labor shortages and not being able to find people. Construction volume has been growing faster than jobs for more than a year. It means productivity in 2015 is up after several down years. But, while we’ve recorded consecutive years of productivity declines many times, we have not had two consecutive years of productivity gains in the last 22 years. So historically we should expect a decline, not gains this year.
Material input costs to construction are down over the last year, but that accounts for only a portion of the final cost of constructed buildings. The cost of new residential construction is up 5% to 6% in the last year. Several nonresidential building cost indexes are indicating construction inflation between 4% and 5%. The Turner non-residential bldg cost index for 2015 is 4.6%. The 1st qtr 2016 is up 1.15% from the 4th quarter 2015. The Rider Levitt Bucknall nonresidential building 2015 cost index is 4.8% and the Beck Cost Report has 5.0% for 2015. I recommend an average 5.5% cost inflation in 2016 for residential and nonresidential buildings. Non-building infrastructure costs are unique to each individual infrastructure market, so average building cost indices should not be used for infrastructure.

What Drives Construction Spending?
3-23-16
New construction starts drive construction spending. For all the discussion regarding the monthly rise and fall of spending, most of the spending in any given month is already predetermined since two thirds of all construction spending in the next 12 months comes from projects that were started prior to today. This is commonly referred to as backlog.
The pattern of spending does not follow the pattern of new starts which can fluctuate dramatically. It follows the pattern developed by the cashflow from all previous starts. Data for new construction starts is sourced from Dodge Data & Analytics. Cash flow is developed independently. Here’s a much simplified example of cashflow: a new $20 million project start is to be completed in 20 months, therefore we expect this project to generate $1 million of spending every month for the next 20 months.
This plot is an Index, so the ratios of starts and actual spending show the relative volume of each of these three major sectors as compared to each other.

Nonresidential buildings new construction starts were elevated for 16 out of the last 24 months. Starts were strong from February through July of 2015. A slowdown occurred in the second half of 2015 but the last four months have been gaining slowly. It looks like the backlog of elevated starts will keep spending rising at least until the end of 2016 before we see a slight dip in spending.
75% of all nonresidential building spending in 2016 comes from projects that were started between early 2014 and the end of 2015. Each month, new starts generate only 4%-5% of monthly spending. As we start the new year, backlog accounts for 95% of January spending. We know a lot about spending within the next few months, but what we have in backlog for December at the beginning of the year from previous starts accounts for only 50% of December activity. We will add about 4-5% more to December backlog from new starts each month this year.
Five out of six times in the last 18 months that nonbuilding infrastructure new construction starts jumped 25% to 50% above the running average it was due to massive new starts in the power sector. Some of these projects are worth several billions of dollars. While this causes new starts to fluctuate wildly, these projects sometimes take four to five years from beginning to completion, so the cash flow is spread out over a very long period, therefore spending does not experience the same magnitude of monthly change as starts.
80% of all nonbuilding spending in 2016 comes from projects that started from mid-2013 through the end of 2015. New starts each month generate only about 3% of monthly spending.
The average of residential starts for the last three months is higher than any time since 2007 when residential starts were already on the decline by 24% from the previous year. The volume of residential starts predicts that spending should be higher than it is currently. This could mean that some starts have been delayed. Or, it could be because residential starts have the shortest duration, they may be the most difficult to predict spending from starts.
55% of all residential building spending in 2016 comes from projects that started between late 2014 and the end of 2015. New starts each month generate almost 10% of monthly spending.
(6-5-16) RE: a discussion related to a decline in nonresidential permits suggests nonresidential spending will decline. Yes, but at what rate? Permits are directly related to new construction starts. Since every month of new starts has an impact of only 4-5% on nonres spending in every following month for the next 20-25 months, then a 10% drop in permits in a single month would cause only a 0.4% to 0.5% reduction in spending in each of the following 20-25 months. It would take a prolonged trend of declining permits and therefore declining new starts to really see a dramatic decline in spending, and then the greatest effect would be well out into the future.

Construction Volume Vs Construction Spending
Construction volume is not the same as construction spending.

Spending is the number nearly everyone follows. Volume is spending minus inflation.
Two years that show the greatest differences between spending and volume highlight the affect of inflation. In 2004 and 2005 total construction spending grew by 11% and 12.5%, but after inflation, volume grew by only 3% and 2%. In the most recent year, construction spending in 2015 grew by 10.5% but total construction volume grew by only 7.5%.
For the four years 2012 through 2015 construction spending grew by 35% but after inflation volume grew by 21%. Inflation accounts for 14% of spending growth.
Annual construction inflation varies for residential, nonresidential buildings and nonresidential infrastructure, and it varies sometimes so widely that each should be used only to adjust that specific group. Since 1993, long-term annual construction inflation for buildings has been 3.5% per year, even when including the recessionary period 2007-2011. During rapid growth periods, inflation averages more than 8% per year.
Historical average volume growth over the last 22 years is grossly distorted by the recession. Volume declined in 8 of those 22 years. In the worst three years of the recession, 2008, 2009 and 2010, volume declined by 28%. If we take out those three years the typical growth period averages are more apparent. The historical average volume growth in construction with recession data removed and after adjusting for inflation is 2% per year for 19 years.
Adjusting for inflation is changing current dollars to constant dollars.
Current dollars = dollars are reported in the value of the year reported, 2008 = 2008$, 2015 = 2015$. News reports almost always refer to current dollars and therefore do not account for the influence of inflation.
Constant dollars = all dollars adjusted to represent dollars in the year of comparison. This adjusts for inflation so 2008$ (and all other years) are converted to equivalent 2015$.
It’s not too hard to understand why we need to look at constant dollars when you think of it in terms of building a house. For example, a 2,500 sf house built in 2001 may have cost $250,000 then to build. Today to build that exact same house may cost $400,000. The house is no different, so volume remains the same. The only thing that changed is inflation. With respect to constant dollars for the same volume, $250,000 in 2001 dollars would be equal to $400,000 in 2015 dollars.
The common comparison is to look at growth in construction spending from year to year. What that does not tell us is how much of the spending growth is inflation and how much is a real increase in construction volume.
Constant dollars makes a huge difference in the analysis. Adjusting all previous years of spending allows us to compare changes in volume growth from year to year. This plot of total construction dollars shows current dollars would indicate we are now only 7% below the previous high and we’ve had growth of 37% from the recession low. Constant dollars, adjusting for inflation, shows volume is still 17% below the previous cycle high and we’ve had growth of only 22% since the recession lows.
Construction Volume Growing Faster Than Jobs, and That’s a Good Thing.
2-24-16
The most talked about reason for slower jobs growth is the lack of experienced workers available to hire. In fact, recent surveys indicate about 80% of construction firms report difficulty finding experienced workers to fill vacant positions. That certainly cannot be overlooked as one reason for slower jobs growth, but is that the only reason?
Even with all this talk of difficulty finding experienced construction workers, there is a lot of hiring going on. For the 5 year period 2011-2015 we added 1,100,000 construction jobs with the peak growth rate in 2014 at 6.1%. Jobs increased by 20% in 5 years.
For the two years 2014 + 2015 we added 650,000 jobs, the largest number of jobs in two years since 2004 + 2005. In that two years, jobs expanded by 11%, the fastest percent growth since 1998-1999, the fastest pace in 17 years. But peak growth was in 2014 with slower growth in 2015. I expect even slower growth in 2016.
Construction spending hit bottom at the same time as jobs, the 1st quarter 2011. For the same 5 year period 2011-2015 construction spending increased far more than jobs growth. Why is it that jobs don’t increase at the same rate a construction spending? Because much of that spending growth is just inflation. When describing a shortfall of construction workers, jobs growth should not be compared to spending growth. After adjusting for inflation from Q1 2011 to Q4 2015, we find that construction volume increased by 22% in 5 years.
Now it looks like over 5 years jobs seem to be growing nearly the same as construction volume. It even looks like productivity increased, but that’s still not the whole picture.
Real work output growth is total jobs adjusted by the hours worked each year. From 2011 to 2015 construction hours worked increased by 3.6% from near the lowest on record to the highest ever recorded. The reason this has such a huge effect is hours worked gets applied on all 6.5 million jobs, not just the new jobs added. So, a workforce that grew by 20% worked 3.6% longer hours showing that net total work output actually increased 24.3%.
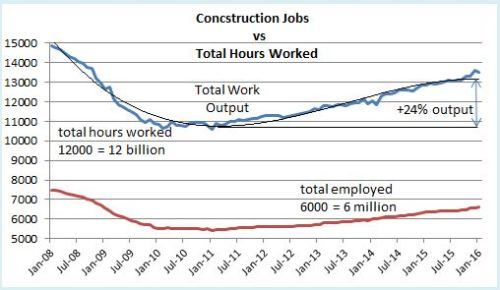
This data shows that over the last 5 years new volume increased by 22% while work output to produce that volume increased by 24%. Data clearly indicates we have added more work output than the volume of work we have produced. This indicates a drop in productivity over the last 5 years.
It is not uncommon at all that productivity declines during rapid growth. This pattern of growth appears prominently in the last two expansions between 1996 and 2006. Firms may be increasing staff based on revenue without strict attention to real volume growth, only to then slow jobs growth and allow volume production to catch up.
By measuring to previous productivity levels, we could say the construction workforce is currently overstaffed. Of course, spending (and net volume after inflation) is expanding rapidly and with it so must the workforce. But, if there is any hope that eventually productivity will return to previous levels, then we must hope for a minimum increase of 2%+ in volume with no matching additional increase in new jobs or hours worked.
Over the next two years I predict construction spending will increase close to 20%, BUT construction volume will increase only 10%, most of that in 2017. In a previous post, “How Many Construction Jobs Will Be Needed” I predicted jobs will grow by 500,000 to 600,000, only about 8%.
Filling positions with workers less qualified than those who were lost accounts for some of the decline in productivity. Working longer hours also leads to productivity loss. To regain lost productivity, new workers need to gain experience AND overall hours need to be reduced and that workload replaced with new jobs. That’s certainly not likely to happen all in one year, but it may account for some of the reason why volume is currently growing faster than jobs, and that’s a good thing. I expect that will continue at least for the next two years.
January 2016 Construction Economics Report
For the latest Construction Economics news follow this link
Construction Economic Outlook
…
…
January 2016 economic report:
BUILDING FOR THE FUTURE
Construction Economics – Market Conditions in Construction.
Construction spending may reach historic growth in 2016. We are currently near the most active 3 year period of growth in construction in more than 20 years, and it’s already been ongoing since 2013-2014.
Construction spending is forecast to increase 9.7% in 2016. Spending could reach a total 30% growth for the three years 2014-15-16. The only comparable periods in the last 20 years are 29% in 2003-04-05 and 27% in 2013-14-15.
Uneven growth rates ranging from rapidly increasing spending to slight dips is more an indication of the effects of uneven new starts patterns than a loss of growth momentum.
SPENDING
Nonresidential buildings spending is forecast to grow 13.7% in 2016 and the three-year total growth could reach 40% for 2014-15-16. The only comparable growth periods in the last 20 years are 40% in 2006-07-08 and 32% in 1995-96-97. Major contributions are increasing from institutional work in educational and healthcare markets. Office, commercial retail, lodging and manufacturing will decline considerably from from the levels in 2015 but still provide support to 2016 growth.
Residential spending increased 46% in 2013-14-15, similar to only one comparable period in the last 20 years, 48% in 2003-04-05. Residential spending will slow several percent early in 2016 before resuming upward momentum to finish the year with 12% growth, slightly less than growth in 2014 and 2015.
Non-building infrastructure projects, in two of the last three years have barely shown any gains, entirely due to declines in power plant projects. This will repeat in 2016. Spending will decline over the next six months due to the ending of massive projects that started 24 to 42 months ago, then resume moderate growth. Following a 0.5% increase in 2015, spending will increase only 1.2% in 2016, held down by a 10% drop in power projects, the second largest component of infrastructure work.
JOBS
Construction added 1.0 million jobs in the five years 2011-2015. 800,000 jobs were added in the last three years. In addition, hours worked increased to an all-time high adding the equivalent of 240,000 more jobs over the last five years.
In the two years 2014-2015, jobs increased the most since 2004-2005. Growth in nonresidential buildings and residential construction in 2014 and 2015 led to significant labor demand and wage growth. To support forecast spending, jobs need to grow by 500,000 to 600,000 in 2016-2017.
From the low-point of the recession in January 2010, the unemployment rate began declining as a result of the unfortunate reason of workers leaving the construction workforce. That decline halted in early 2013, at which point the workforce once again started growing. Since then the unemployment rate has been declining due to the non-working pool being reabsorbed into the the employed workforce.
There are numerous reports of labor shortages in some building professions. Average construction unemployment for Nov-Dec-Jan equaled the lowest on record (for this 3mo period) last seen in 2006, indicating a low available nonworking pool from which to grow jobs. This data supports the argument of labor shortages and potential difficulties ahead in growing employment. However, jobs continue to grow at the fastest rate in 10 years.
INFLATION
Construction inflation for buildings in 2016-2017 is quite likely to advance higher and more rapidly than previously thought. Long term construction cost inflation is normally about double consumer price inflation. Construction inflation in rapid growth years is much higher than average long-term inflation. Since 1993, long-term annual construction inflation for buildings has been 3.5%, even when including the recessionary period 2007-2011. During rapid growth periods, inflation averages more than 8%.
Spending growth, up 35% in the four-year period 2012-2015, exceeded the growth during 2003-2006 (33%) and 1996-1999 (32%) which were the two fastest growth periods on record with the highest rates of inflation and productivity loss. Construction spending growth for the four year period 2013-2016 is going to outpace all previous periods.
Inflation cost for residential buildings, nonresidential buildings and infrastructure projects do not follow the same pattern. For the last three years, the Gilbane Building Cost Index for nonresidential buildings has been increasing and has averaged just over +4%. Residential buildings cost indices averaged just over +6% but have been decreasing. Both are expected to climb in 2016. Caution: composite all-construction cost indices or indices that do not represent final cost should not be used to adjust project costs.
Infrastructure indices are so unique to the type of work that individual specific infrastructure indices should be used to adjust cost of work. The FWHA highway index dropped 4% in 2013-2014 but increased 4% in 2015 and is expected to increase in 2016-2017. The IHS power plant cost index gained 12% from 2011-2014 but then plummeted in 2015 to an eight year low. The Producer Price Index (PPI) industrial structures index and the PPI other nonresidential structures index both have been relatively flat or declining for the last three years.
Anticipate construction inflation for residential and nonresidential buildings during the next two years closer to the high end rapid growth rate of 6% to 8% rather than the long term average of 3.5%.
The full report provides analysis for what occurred in 2015, data that supports 2016 forecasts and historical trends that shape the construction industry.
Author’s note: I provided all opinion in this economic report. Now, as an independent construction economics analyst, I compile economic information and perform data analysis. You can now find all this analysis here in this new blog format. EdZ