2016 Construction Outlook Articles
Articles Detailing 2016 Construction Outlook
Links will open in a new tab
These links point to articles here on this blog that summarize end-of-year data for 2015 and point to articles with projections for 2016.
Most Recently Published
Summary of 2017 Construction Outlook 2-21-17
How Much Does A Steel Cost Increase Affect Construction? 9-18-16
2015 Results
Construction Spending 2015-2016 – How Do The Forecasts Compare? 12-9-15
Construction Spending 2015 and 2016 11-9-15
Construction Spending Market Performance of Nonresidential Bldgs 2015-2016 10-15-15
New Starts and 2016 Starting Backlog
Construction Backlog 2017 3-20-17
New Construction Starts Leading Into 2017 1-24-17
Behind The Headlines – Construction Backlog 1-16-17
Starts Point to Robust 2017 Spending 10-20-16
New Construction Starts Much Better Than Might Appear 9-23-16
Spending Forecast
Forecast 2017 Construction Spending 1-7-17
2016 Construction Spending year end 1-3-17
Are We at New Peak Construction Spending? 1-4-17
Construction Spending Gets Revised UP 10-6-17
Construction Spending 2016 – Midyear Summary
1st Quarter 2016 Construction Spending and Forecast
Construction Forecast 1st Look – What To Expect in 2016? 1-14-16
Erratic Pattern Ahead for 2016 Construction Spending. Why?
Nonresidential Buildings
Construction Spending 2016 – Midyear Nonresidential Markets
Updated 1-23-16 Forecasts of 2016 Nonres Buildings Construction Spending % Growth
Construction Spending Market Performance of Nonresidential Bldgs 2015-2016 10-15-15
Residential
Construction Spending vs Dodge Starts vs New Housing Unit Starts 4-27-16
Residential Work Flow From Housing Starts 4-25-16
Housing Starts > Look a Little Deeper 11-18-15
Claryifying Housing Starts Numbers 11-6-15
Residential Construction – Not All Data Tells The Same Story 10-25-15
Infrastructure Outlook
Infrastructure – Ramping Up to Add $1 trillion 1-30-17
Infrastructure Outlook 2017 1-12-17
Calls for Infrastructure Problematic 1-12-17
Saturday Morning Thinking Out Loud #1 – Infrastructure 10-29-16
Public Construction
Infrastructure & Public Construction Spending 3-5-17
Public Construction Spending 2016-2017 10-21-16
Jobs
Construction Spending vs Jobs 2-9-17
Behind The Headlines – Construction Jobs 2-16-17
Construction Jobs Show 3rd Qtr Growth 10-7-16
How Many Construction Jobs Needed to Support 2016-2017 Spending Forecast? 1-12-16
Inflation
How Much Does A Steel Cost Increase Affect Construction? 9-18-16
Construction Inflation Cost Index 1-31-16
How Many Construction Jobs Will Be Needed to Support 2016-2017 Spending Forecast?
1-12-16
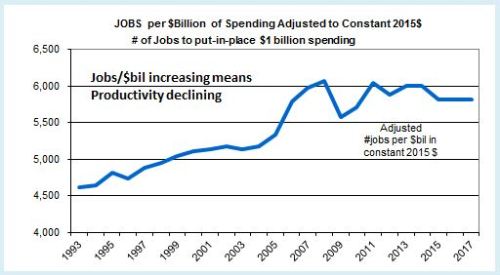
This is a pretty straight forward analysis. If productivity is to remain the same, then jobs need to grow by the same percentage as volume. If volume grows faster, then productivity increases. If jobs grow faster, then productivity declines. Let’s have a look at the numbers to find out what’s been going on and where we might be headed. Spending forecasts will give the basis for predicting jobs growth.
A few weeks back I commented on a study published by Bureau of Labor Statistics on how many construction jobs would be created by 2024. BLS Says +790,000 Construction Jobs by 2024. Let’s Look Behind The Headlines. Now that I’ve completed updating spending and jobs data and developed a forecast for 2016-2017, I will show what has taken place over the last 4 years and what to expect for the next two years.
Here’s what we know.
Volume is not the same as construction spending. Spending is the number nearly everyone follows. Volume is spending minus inflation. I use composite inflation factors based on tracking numerous construction selling price indices.
In 2015 nonresidential buildings spending grew by 17%, but after inflation, volume grew by only 12%. Overall construction spending in 2015 grew by 11%. Total all construction volume grew by 8%. Annual construction inflation varies for residential, nonresidential buildings and nonresidential infrastructure.
For the four years 2012 through 2015 construction spending grew by 35% but after inflation volume grew by 21%.
Work output grows by number of new jobs added and by any increase in total hours worked. For the four years 2012 through 2015 construction jobs increased from 5.5 million to 6.4 million, or 16%. In addition hours worked by the entire 6 million workforce increased by 2%. So effectively, total workforce output increased by 18%.
The last four years volume grew 21% and the effective number of jobs grew 18%. There was an increase in productivity over this four year period of 3%. An increase in productivity occurred because we put-in-place more volume than the (effective) number of jobs added.
Now we can ask the question, “How many construction jobs will be added in the next two years if we achieve the spending forecast?”
Let’s use what we know and apply it to the forecast.
I’m forecasting 10% spending growth in 2016 and 12% in 2017. I anticipate higher inflation than we have experienced in the last few years. After inflation, volume should grow 4% and 6%. So, total volume growth for the next two years is forecast 10%.
With rapid growth, I would expect productivity to decline slightly, but the last 4 years of growth showed a slight productivity gain, so let’s go with that. That means we will lower our estimate of jobs needed because some of the increased volume over the next 2 years will be supported with increased productivity.
Total volume growth for the next two years is forecast at 10%. If we follow the same pattern as the last 4 years, we may see an increase in productivity of 2%. So we need only an 8% increase in workforce output to put-in-place the forecast volume. The average number of jobs for 2015 is 6.4 million. An 8% increase in 2 years on the 6.4 million means we need to add 512,000 jobs in 2016-2017.
If we do not see gains or losses in productivity we need to add 10% to jobs, the same percentage jobs as we have volume growth. That would be 640,000 new jobs in 2016-2017.
As a result, based on this analysis expect a need of about 500,000 to 600,000 new construction jobs in the next two years.
For comparison, in 2014-2015, 601,000 new jobs were added. Then, spending grew 20% but volume after inflation was 12%. Jobs grew by 10%.
Jobs have increased more than 600,000 in two adjacent years only a few times. Any two years within 1996-1998 were over 600,000, also 83-84 and 93-94. The highest ever was 1998-99 when we added 770,000 new jobs, and that two year period had the same total jobs as 2014-2015. The only other recent high periods are 2004-05 added 700,000 and 2014-15 added 601,000.
Also, it’s easy to see now, had this been based on total spending increases for the two years rather than volume, the need would be 20+% or 1.0 to 1.2 million jobs, not just the 8% or 10% jobs growth used here. The last time jobs grew by more than 10-12% in two years was 1977-1978 at 18% and the highest growth ever was 770,000 jobs added in 1998-99, the only time over 700,000. So, as expected, 20+% growth and a million jobs in two years has never been reached.
BLS predicted construction will add 790,000 jobs over 10 years, the period from 2015 through 2024. In 2015 we’ve already gained 260,000 jobs so that would leave 530,000 new jobs expected over the remaining 9 years.
The spending forecast and past job growth patterns indicate that we will add far more jobs and much faster than is predicted by BLS.
Of course, another recession would alter this, but this is not based on another recession.
Welcome to the New Year. What’s Up With Construction?
It’s been about two weeks since I wrote a blog post. With good reason. I’ve spent the last few weeks working sometimes 10 or 12 hour days getting all the information for and writing a construction economics report. Coming soon!
Here’s a few tidbits out of the mass.
The nonresidential buildings construction boom that is going on right now could become an historic expansion. I’m predicting 13.7% growth in 2016. Added to 8.8% in 2014 and 17.1% in 2015 that could be 39.6% growth in 3 years 2014-15-16.
Only 3 year periods back to 1993 that are comparable: 2006-07-08 40.1% and 1995-96-97 32%.
Similarly,
Total construction spending growth for the 3 years 2014-15-16 could reach 30%. I forecast 9.7% growth in 2016.
Only 3 year periods back to 1993 that are comparable: 2003-04-05 29% and 1998-99-2000 25%.
Well, there is one more comparable. The last three years of total construction spending growth for 2013-14-15 was up 27%, so this expansion is already ranked 2nd.
What we see here is the 1st or 2nd most active 3 year period of growth in construction on record back to 1993, and it’s already been happening for two or three years.
For perspective, residential spending for 2013-14-15 grew 46%! Similar only to residential spending in 2003-04-05 at 48%.
Welcome to the new year. So let’s go see if we can break some records.
Updated 1-23-16 Forecasts of 2016 Nonres Buildings Construction Spending % Growth
Updated 1-23-16 – CMD, FMI and I have updated 2016 construction spending forecast in the last month and the latest is included in this table.

Original post 12-21-15
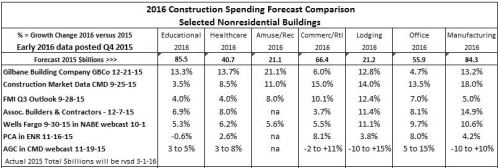
Below are early Q3-Q4 2015 forecasts for growth in 2016 nonresidential buildings construction spending markets.
Seven firms posted forecasts for spending growth. My 12-21-15 forecasts include new starts through November in my projection.
Most of the starts that will generate spending next year are already in place. For the 2016 forecast, new starts booked through December 2015 will contribute 75% to nonresidential buildings spending. We expect new starts growth in nearly every market. However, the pattern of spending will not be a constant upward slope.
Don’t expect 2016 forecast to change much with the last month of data. Commercial/Retail, Office and Manufacturing have been declining in recent months and are expected to continue to drop. Institutional work is on the increase.
As in the 2015 spending growth forecast, I’m well outside the range of predictions for several building types, particularly Educational, Healthcare, Amusement and Office. However I’m OK with my contrary positions since I had the same regarding 2015 spending and now as we near year end I may potentially have had the closest forecast for 5 or 6 of the 7 markets.
Look back at this chart a year from now to see how we did.
Forecasting Nonresidential Buildings Markets 2015 Results
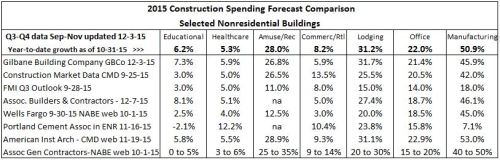
Here are latest updates for 2015 predictions in nonresidential buildings markets. Eight firms have posted forecasts for spending growth in nonresidential construction markets.
Actual spending put-in-place for October year-to-date (YTD) is included in the YTD shown at the top of the table. Don’t expect most markets to change much in the last two months of data. Both Commercial/Retail and Manufacturing have been declining in recent months and are expected to continue to drop slightly.
Once the September YTD data is in, a strong forecast for the year can be made with only three months outstanding. It will be interesting to look back at this chart when the final numbers for 2015 become available in February 2016 to see how we did. Earlier posts and reports can be referenced to see forecasts from midyear.
BLS Says +790,000 Construction Jobs by 2024. Let’s Look Behind The Headlines.
In a report released December 8, 2015 the Bureau of Labor Statistics (BLS) predicts jobs growth for industries. Construction is pegged as a leader with expected 790,000 new jobs from 2014 to 2024. Robert Deitz at NAHB provides a good summary of the BLS report.
Let me provide a few historical averages and break this down so we can see how it stacks up.
The prediction period is from 2014 through 2024, so all of 2014 is already in the BLS baseline. The average number of construction jobs in 2014 was 6,138,000 and BLS uses that baseline. BLS says 2024 will average 6,928,000 construction jobs, growth of 790,000 jobs over 10 years, from which we can infer 12.9% growth in 10 years or a 1.22% compounded growth rate.
In 2015 we’ve already gained 215,000 ytd through November. The average jobs for 2015 is currently 6,390,000, so that leaves 540,000 expected over the remaining 9 years. That would imply a growth rate of 8.5% in 9 years or an average compounded growth rate of only 0.9% per year.
Now here is where it gets interesting.
Spending growth is predicted by several firms between 5% and 10% per year for the next 4 years. My own forecast has 2016 growth at 11%. Average of forecasts for the period 2016-2019 are currently 8%, 7.5%, 6% and 7%.We need to take out inflation to get real volume growth, so we will assume 4% inflation per year for the next 4 years. Long term construction inflation is 3.5% per year, but in rapid growth years it has reached 6%-8% per year. For the period 2013-2015 construction inflation averaged 4%. Adjusting for inflation at 4% results in volume growth for 2016-2019 at 4%, 3.5%, 2% and 3%. This is much faster growth than the BLS average, so we will remain more conservative in this analysis.
Historical volume growth over the last 22 years is grossly distorted by the recession. Volume declined in 8 of those 22 years. In the three worst three years of the recession, 2008, 2009 and 2010, volume declined by 28%. When we take out those three years the typical growth period averages are more apparent. The historical average volume growth in construction with recession data removed and after adjusting for inflation is 2% per year for 19 years.
Jobs growth over the last 20 years averaged 1.6% per year, even when we include the catastrophic losses during the recession years of 2007 through 2010. The BLS is predicting 1.22% growth for 10 years, lower than the average with a recession. Without the four worst recession years of job losses the average growth jumps to 3.7% per year, almost triple the BLS predicted growth. Minus the recession years, there has never been a prolonged period where jobs growth has averaged growth less than 2% per year, so we shouldn’t expect such low growth.
BLS assumes productivity will increase 1% per year. This would lower the number of jobs needed. Construction productivity has never done this before. My records show over the last 20 years there has not even been two consecutive years of construction productivity increases. Long term productivity in the construction industry has declined by 1% per year. Data would indicate jobs growth must be greater than volume growth to make up for productivity losses.
We have differences based on my analysis of historical growth and productivity. Forecasts show expectations of rapid growth in the next few years. These differences would produce dramatically different estimates of jobs growth in coming years. How much different? Let’s see.
Let’s be conservative with assumptions. Based on:
- No productivity increases or losses. Therefore jobs will grow at the same rate as volume.
- Volume growth of 1.5% per year will be less than forecast and less than the historical non-recession average. This allows for some years to decline.
- There will be no recession, but there will be down years.
- Starting from 2015 baseline of 6,390,000 jobs
Jobs need to grow at 1.5% per year compounded for 9 years. That’s 14.3% in 9 years from the 2015 baseline of 6,390,000. Growing 14% in nine years adds 895,000 jobs by 2024. We’ve already gained 215,000 jobs in 2015. For the period of the BLS analysis, my conservative prediction is a total gain of 1,110,000 jobs over 10 years, 320,000 more than the BLS prediction.
Jobs reached a peak in 2006-2007 at 7,700,000. At conservative growth rates we will not reach the previous peak by 2024. However, if construction volume and jobs growth follow a little more closely to historical 20 year patterns, we will add 1,300,000 jobs from 2014 to 2024, but still be short of the previous peak. This scenario adds 500,000 to the BLS prediction.
If volume growth does reach forecast levels and if jobs growth does include some losses in productivity then my estimate for jobs is double BLS and we could reach the previous peak in jobs several years earlier.
Construction Spending 2015-2016 – How Do The Forecasts Compare?
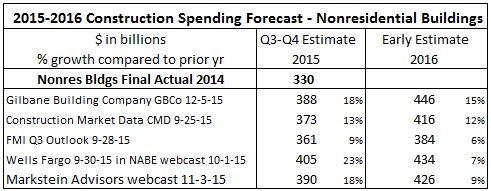
Throughout the year a number of firms provide forecasts of construction spending. Spending projections give us an indication of the level of activity to expect. Here’s a summary of the most recent forecasts.

Actual spending put-in-place for October year-to-date (YTD) became available December 1st and new construction starts for October became available November 23rd. My GBCo 12-5-15 forecast includes both of those data updates. Not all these firms have yet incorporated the October data into their analysis and some will update in the near future. Most all of these values will be updated in January. Also, the AIA semi-annual Consensus report, forecasts of nonresidential buildings only, will come out in January. Again I’ll point out, my numbers have not changed much since July when I predicted $1067 for total, $388 for residential and $397 for nonres bldgs spending in 2015. Click on this link to an older post that shows the midyear predictions for three firms.
Once spending data through September is available it allows an analysis of a select data set that gives a prediction of the year end result within +/- 1%. I use this analysis to check my forecast. It indicates 2015 should finish with total spending between $1.067 trillion and $1.087 trillion and nonresidential buildings spending between $386 billion and $395 billion. The actual spending total has not fallen outside the statistical range since 2001, as far back as I’ve been tracking the data. I’m confident that total spending for the year will fall within this predicted range. My 2015 forecast of $1.067 trillion total and $397 billion for nonresidential buildings falls within those ranges.
Spending in any given month is the sum total contributed by all the projects that started and are currently underway. That includes spending from projects that started recently with foundations just coming out of the ground and also projects that started 18-36 months ago that are near completion. Spending patterns are affected mostly by the pattern of starts recorded over the period 12-36 months ago. New starts will generate the next 2 to 3 years of spending. Only if the starts pattern is even in growth will spending be even in growth. That will not be the case in 2016.
What we do know is that most starts that will generate spending next year are already in place. For the 2016 forecast, new starts booked through December 2015 will contribute 75% to nonresidential buildings spending, 55% to residential spending and 80% to spending on nonbuilding infrastructure. The pattern of spending will not be a constant upward slope.
This table compares all 2015 values to the final of $330 billion in 2014. For 2016 each firm is compared to their own 2015 value. Once an actual value is determined for 2015 (which won’t be until March 1, 2016) I cannot be certain if some other firms forecast dollars change or percent floats. In the Gilbane forecast, 2016 percent would float. This will also affect the 2016 values in the first table in this blog post.
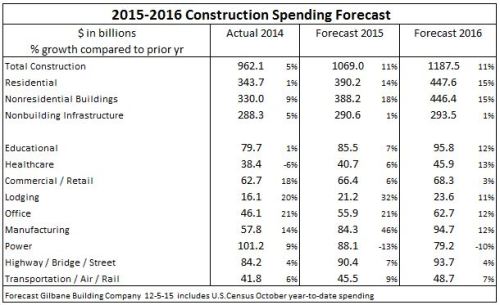
Construction Spending Forecast 2015 – 2016 Both Up 11%
The data continues to get tighter with each new release. This forecast is updated Dec 5th to include US Census October spending released Dec. 1 and Dodge Data & Analytics construction starts October released Nov. 20.
The six major nonresidential buildings markets reported here represent 90% of all nonresidential buildings and the three infrastructure markets represent 75% of all nonbuilding infrastructure. This gives a good picture of which markets contributed the most (least) to 2015 growth and which will offer the most (least) support to 2016 growth.
My forecast is construction spending for 2015 will total $1.069 trillion supported by an 18% increase in nonresidential buildings spending. For 2016 expect spending to total $1.187 trillion with increases of 15% in both residential and nonresidential buildings.
With the October spending results included, robust data allows predicting 2015 year-end results with great confidence. For the 2016 forecast, new starts booked through December 2015 will contribute 75% to nonresidential buildings spending, 55% to residential spending and 80% to spending on nonbuilding infrastructure.
This forecast may be revised slightly for the upcoming Winter Construction Economics report.
Construction Spending – Reports of It’s Death May Be Greatly Exaggerated
Is activity climbing or declining? Will costs go up or down? Will we have a winter slowdown? Where are the markets headed? I read an article this morning that stated “momentum is losing steam.” Is it?
I’ve been gathering Construction economic reports for comparison and I see some predictions for 2016 that frankly are only about what I’m predicting for 2015. To be fair, there are reliable predictions that indicate growth similar to what I predict. When data was available for two thirds or better of 2015 total activity there were still predictions for how specific markets would finish the year that varied by as much as 20% to 30%. In one instance the year-to-date actual through September has already exceeded the year end estimate from one firm. Surprising, once that much actual year-to-date information is in hand that there could be that much variation.
And how will markets perform in 2016? Here’s a few examples from a variety of sources; educational, healthcare, lodging and manufacturing all have more than one estimate for 2016 growth in the range of 0% to 4%, values that would not keep spending growth up with inflation, meaning volume would actually decline. My estimates for those markets are all 10% or higher. Variations of 10% to 15% in growth are common in the data.
So, here’s a few comments on predictions and on what to expect.
Unless something Earth-shattering happens, there is a select set of monthly data that statistically predicts the yearly outcome for total spending and market spending, within +/-1.5% for a smaller data set and within +/-1% for a slightly larger data set, but you have to wait longer to get that larger data set. It failed once in 14 years, by 1/2 of 1 percent. The same analysis can be performed individually for markets and sectors. The potential variance increases for some markets to about +/-3%.
The Dodge Momentum Index and the AIA Inquiries index are leading indicators to potential future work. They foretell activity in the Architectural Billings Index (ABI), which is a leading indicator to new construction starts. New starts provide the future cash flows for spending.
Spending in any given month is the sum of how much can be put-in-place generated by the cash flow from each of the project starts that got booked in the previous year or two, or three for long duration projects. For the next month the unknown amount is only about 3% or 5% that will be generated by new starts in the most recent 30 days. The remainder is already booked. Two months out the prediction includes 6% to 10% uncertainty, and so on.
Expect a winter slowdown. It’s not because of the weather. There may be additional repercussions if we experience severe weather, but the slowdown is predetermined because very large starts that got booked from a year to two years ago are reaching completion and dropping out of the monthly spending. Starts can be erratic. This causes periodic fluctuations in monthly spending. It’s normal.
Also what may not be apparent is what happens due to the difference in seasonally adjusted (SA) and not seasonally adjusted (NSA) values. Readers most often track the changes in SA values, but spending is generated from cash flow and cash flow is generated from the NSA values. Differences can be huge. As an example, August starts with an SA of $300bil produce 50% more actual NSA dollar volume to cash flow than February starts with an SA of $300bil. This may cause erratic spending patterns.
Residential spending will slow several percent to a low point in February before resuming upward momentum to finish the year stronger than 2015. Periods of low start volumes need to work their way thru the system and this produces growth patterns with periodic dips.
Nonresidential buildings will slow only moderately in the next few months before we see 15% growth through the middle of the year, only to see another slowdown late next year, leading into a considerably slower 2017. Office new construction starts in 2015 are up 50% from 3 years ago, educational up 25% over same period. Manufacturing starts are down 70% in 2015 and that is still at the second highest ever recorded. Total spending is still strong in 2016 at 10% growth. Major contributions appear from institutional work in educational and healthcare. Office and manufacturing still provide very strong support to growth.
Infrastructure projects spending will decline for the next six months due to the ending of massive projects that started 24 to 42 months ago. There will be large advances in spending midyear before we experience another slowdown later in 2016. I’m currently predicting spending will grow less than 2% in 2016, held down by a 10% drop in Power the second largest component of infrastructure work.
Mixed within the three sectors above are Private and Public spending. Residential is about 98% private and makes up about 50% of all private work. Along with manufacturing and large portions of power, commercial/retail, office and healthcare makes up nearly 90% of all private work. Private growth is the sum of the parts, predicted at 10%+ for 2016. Public work is all or a large portion of highway/street, educational, transportation and sewage/waste. Along with small contributions from water and a portion of power, these markets comprise 80% of all public work. Again, the sum of parts shows growth at 8% in 2016.
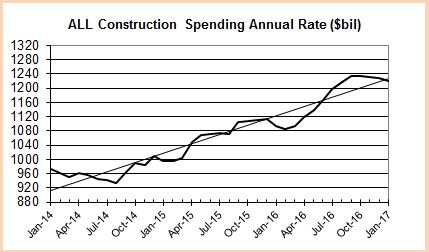
From the middle of Q1’16 to the end of Q3 we will register an annual growth rate of 20%, but due to the dips at the beginning and the end of the year total 2016 construction spending growth will come in at 11%. Construction spending momentum is not losing steam. We are seeing the affect of a few years of erratic growth patterns and a shift from commercial to institutional work.
Construction Spending Nonres Bldgs on a Roll > What it Means for Inflation
This is clearly going to measure up as the breakout year for spending on nonresidential buildings. Growth year-to-date (YTD) is up 18.3%. We will finish the year with total growth up 17%. The last time we saw growth like this was 2007. In fact, 2007 is the only time % growth (and $ volume growth) was ever larger than this year.
Since last December I have been predicting a range from 14% to 20% growth in 2015 nonresidential buildings spending. It looks like we will finish the year right in the middle of that range.
By far the largest $ contribution comes from the growth in manufacturing buildings, up 50% and up $23bil YTD. Next closest is office buildings, up 22% and up $8.3bil YTD. Lodging, Commercial-Retail, Educational and Amusement-Recreation are each up approximately $4bil YTD, quite impressive for Lodging and Amusement-Rec since they both total only $17bil YTD.
Nonresidential buildings spending will maintain greater than 10% growth in 2016 something achieved only 5 times in 25 years. Next year, educational and healthcare buildings will both contribute strongly to the total annual growth. Manufacturing, Office and Lodging will all settle back but still maintain 10% or greater growth. Commercial-retail, which had 3 years of substantial growth from 2012 to 2014 adding nearly 50% spending growth during that time, will grow only 2-3% next year.
With last year, this year and next, nonresidential buildings spending will reach growth of 40% in three years, a growth rate exceeded only once in history, during the last construction boom from 2006 to 2008. Along with that boom in spending came the highest construction inflation ever recorded, an average inflation over 8% per year for 4 years. I expect we are headed there again.

revised / updated table 12-9-15 to include ABC & BMarkstein forecasts.