BLS Says +790,000 Construction Jobs by 2024. Let’s Look Behind The Headlines.
In a report released December 8, 2015 the Bureau of Labor Statistics (BLS) predicts jobs growth for industries. Construction is pegged as a leader with expected 790,000 new jobs from 2014 to 2024. Robert Deitz at NAHB provides a good summary of the BLS report.
Let me provide a few historical averages and break this down so we can see how it stacks up.
The prediction period is from 2014 through 2024, so all of 2014 is already in the BLS baseline. The average number of construction jobs in 2014 was 6,138,000 and BLS uses that baseline. BLS says 2024 will average 6,928,000 construction jobs, growth of 790,000 jobs over 10 years, from which we can infer 12.9% growth in 10 years or a 1.22% compounded growth rate.
In 2015 we’ve already gained 215,000 ytd through November. The average jobs for 2015 is currently 6,390,000, so that leaves 540,000 expected over the remaining 9 years. That would imply a growth rate of 8.5% in 9 years or an average compounded growth rate of only 0.9% per year.
Now here is where it gets interesting.
Spending growth is predicted by several firms between 5% and 10% per year for the next 4 years. My own forecast has 2016 growth at 11%. Average of forecasts for the period 2016-2019 are currently 8%, 7.5%, 6% and 7%.We need to take out inflation to get real volume growth, so we will assume 4% inflation per year for the next 4 years. Long term construction inflation is 3.5% per year, but in rapid growth years it has reached 6%-8% per year. For the period 2013-2015 construction inflation averaged 4%. Adjusting for inflation at 4% results in volume growth for 2016-2019 at 4%, 3.5%, 2% and 3%. This is much faster growth than the BLS average, so we will remain more conservative in this analysis.
Historical volume growth over the last 22 years is grossly distorted by the recession. Volume declined in 8 of those 22 years. In the three worst three years of the recession, 2008, 2009 and 2010, volume declined by 28%. When we take out those three years the typical growth period averages are more apparent. The historical average volume growth in construction with recession data removed and after adjusting for inflation is 2% per year for 19 years.
Jobs growth over the last 20 years averaged 1.6% per year, even when we include the catastrophic losses during the recession years of 2007 through 2010. The BLS is predicting 1.22% growth for 10 years, lower than the average with a recession. Without the four worst recession years of job losses the average growth jumps to 3.7% per year, almost triple the BLS predicted growth. Minus the recession years, there has never been a prolonged period where jobs growth has averaged growth less than 2% per year, so we shouldn’t expect such low growth.
BLS assumes productivity will increase 1% per year. This would lower the number of jobs needed. Construction productivity has never done this before. My records show over the last 20 years there has not even been two consecutive years of construction productivity increases. Long term productivity in the construction industry has declined by 1% per year. Data would indicate jobs growth must be greater than volume growth to make up for productivity losses.
We have differences based on my analysis of historical growth and productivity. Forecasts show expectations of rapid growth in the next few years. These differences would produce dramatically different estimates of jobs growth in coming years. How much different? Let’s see.
Let’s be conservative with assumptions. Based on:
- No productivity increases or losses. Therefore jobs will grow at the same rate as volume.
- Volume growth of 1.5% per year will be less than forecast and less than the historical non-recession average. This allows for some years to decline.
- There will be no recession, but there will be down years.
- Starting from 2015 baseline of 6,390,000 jobs
Jobs need to grow at 1.5% per year compounded for 9 years. That’s 14.3% in 9 years from the 2015 baseline of 6,390,000. Growing 14% in nine years adds 895,000 jobs by 2024. We’ve already gained 215,000 jobs in 2015. For the period of the BLS analysis, my conservative prediction is a total gain of 1,110,000 jobs over 10 years, 320,000 more than the BLS prediction.
Jobs reached a peak in 2006-2007 at 7,700,000. At conservative growth rates we will not reach the previous peak by 2024. However, if construction volume and jobs growth follow a little more closely to historical 20 year patterns, we will add 1,300,000 jobs from 2014 to 2024, but still be short of the previous peak. This scenario adds 500,000 to the BLS prediction.
If volume growth does reach forecast levels and if jobs growth does include some losses in productivity then my estimate for jobs is double BLS and we could reach the previous peak in jobs several years earlier.
Construction Spending 2015-2016 – How Do The Forecasts Compare?
Throughout the year a number of firms provide forecasts of construction spending. Spending projections give us an indication of the level of activity to expect. Here’s a summary of the most recent forecasts.

Actual spending put-in-place for October year-to-date (YTD) became available December 1st and new construction starts for October became available November 23rd. My GBCo 12-5-15 forecast includes both of those data updates. Not all these firms have yet incorporated the October data into their analysis and some will update in the near future. Most all of these values will be updated in January. Also, the AIA semi-annual Consensus report, forecasts of nonresidential buildings only, will come out in January. Again I’ll point out, my numbers have not changed much since July when I predicted $1067 for total, $388 for residential and $397 for nonres bldgs spending in 2015. Click on this link to an older post that shows the midyear predictions for three firms.
Once spending data through September is available it allows an analysis of a select data set that gives a prediction of the year end result within +/- 1%. I use this analysis to check my forecast. It indicates 2015 should finish with total spending between $1.067 trillion and $1.087 trillion and nonresidential buildings spending between $386 billion and $395 billion. The actual spending total has not fallen outside the statistical range since 2001, as far back as I’ve been tracking the data. I’m confident that total spending for the year will fall within this predicted range. My 2015 forecast of $1.067 trillion total and $397 billion for nonresidential buildings falls within those ranges.
Spending in any given month is the sum total contributed by all the projects that started and are currently underway. That includes spending from projects that started recently with foundations just coming out of the ground and also projects that started 18-36 months ago that are near completion. Spending patterns are affected mostly by the pattern of starts recorded over the period 12-36 months ago. New starts will generate the next 2 to 3 years of spending. Only if the starts pattern is even in growth will spending be even in growth. That will not be the case in 2016.
What we do know is that most starts that will generate spending next year are already in place. For the 2016 forecast, new starts booked through December 2015 will contribute 75% to nonresidential buildings spending, 55% to residential spending and 80% to spending on nonbuilding infrastructure. The pattern of spending will not be a constant upward slope.
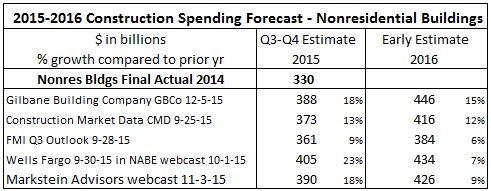
This table compares all 2015 values to the final of $330 billion in 2014. For 2016 each firm is compared to their own 2015 value. Once an actual value is determined for 2015 (which won’t be until March 1, 2016) I cannot be certain if some other firms forecast dollars change or percent floats. In the Gilbane forecast, 2016 percent would float. This will also affect the 2016 values in the first table in this blog post.
Construction Spending Forecast 2015 – 2016 Both Up 11%
The data continues to get tighter with each new release. This forecast is updated Dec 5th to include US Census October spending released Dec. 1 and Dodge Data & Analytics construction starts October released Nov. 20.
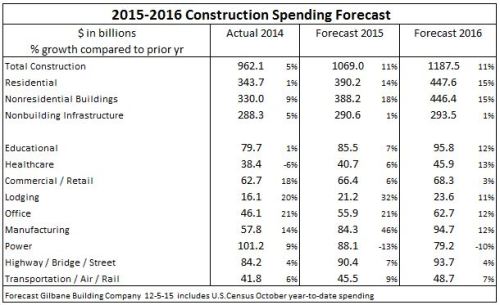
The six major nonresidential buildings markets reported here represent 90% of all nonresidential buildings and the three infrastructure markets represent 75% of all nonbuilding infrastructure. This gives a good picture of which markets contributed the most (least) to 2015 growth and which will offer the most (least) support to 2016 growth.
My forecast is construction spending for 2015 will total $1.069 trillion supported by an 18% increase in nonresidential buildings spending. For 2016 expect spending to total $1.187 trillion with increases of 15% in both residential and nonresidential buildings.
With the October spending results included, robust data allows predicting 2015 year-end results with great confidence. For the 2016 forecast, new starts booked through December 2015 will contribute 75% to nonresidential buildings spending, 55% to residential spending and 80% to spending on nonbuilding infrastructure.
This forecast may be revised slightly for the upcoming Winter Construction Economics report.
Construction Spending – Reports of It’s Death May Be Greatly Exaggerated
Is activity climbing or declining? Will costs go up or down? Will we have a winter slowdown? Where are the markets headed? I read an article this morning that stated “momentum is losing steam.” Is it?
I’ve been gathering Construction economic reports for comparison and I see some predictions for 2016 that frankly are only about what I’m predicting for 2015. To be fair, there are reliable predictions that indicate growth similar to what I predict. When data was available for two thirds or better of 2015 total activity there were still predictions for how specific markets would finish the year that varied by as much as 20% to 30%. In one instance the year-to-date actual through September has already exceeded the year end estimate from one firm. Surprising, once that much actual year-to-date information is in hand that there could be that much variation.
And how will markets perform in 2016? Here’s a few examples from a variety of sources; educational, healthcare, lodging and manufacturing all have more than one estimate for 2016 growth in the range of 0% to 4%, values that would not keep spending growth up with inflation, meaning volume would actually decline. My estimates for those markets are all 10% or higher. Variations of 10% to 15% in growth are common in the data.
So, here’s a few comments on predictions and on what to expect.
Unless something Earth-shattering happens, there is a select set of monthly data that statistically predicts the yearly outcome for total spending and market spending, within +/-1.5% for a smaller data set and within +/-1% for a slightly larger data set, but you have to wait longer to get that larger data set. It failed once in 14 years, by 1/2 of 1 percent. The same analysis can be performed individually for markets and sectors. The potential variance increases for some markets to about +/-3%.
The Dodge Momentum Index and the AIA Inquiries index are leading indicators to potential future work. They foretell activity in the Architectural Billings Index (ABI), which is a leading indicator to new construction starts. New starts provide the future cash flows for spending.
Spending in any given month is the sum of how much can be put-in-place generated by the cash flow from each of the project starts that got booked in the previous year or two, or three for long duration projects. For the next month the unknown amount is only about 3% or 5% that will be generated by new starts in the most recent 30 days. The remainder is already booked. Two months out the prediction includes 6% to 10% uncertainty, and so on.
Expect a winter slowdown. It’s not because of the weather. There may be additional repercussions if we experience severe weather, but the slowdown is predetermined because very large starts that got booked from a year to two years ago are reaching completion and dropping out of the monthly spending. Starts can be erratic. This causes periodic fluctuations in monthly spending. It’s normal.
Also what may not be apparent is what happens due to the difference in seasonally adjusted (SA) and not seasonally adjusted (NSA) values. Readers most often track the changes in SA values, but spending is generated from cash flow and cash flow is generated from the NSA values. Differences can be huge. As an example, August starts with an SA of $300bil produce 50% more actual NSA dollar volume to cash flow than February starts with an SA of $300bil. This may cause erratic spending patterns.
Residential spending will slow several percent to a low point in February before resuming upward momentum to finish the year stronger than 2015. Periods of low start volumes need to work their way thru the system and this produces growth patterns with periodic dips.
Nonresidential buildings will slow only moderately in the next few months before we see 15% growth through the middle of the year, only to see another slowdown late next year, leading into a considerably slower 2017. Office new construction starts in 2015 are up 50% from 3 years ago, educational up 25% over same period. Manufacturing starts are down 70% in 2015 and that is still at the second highest ever recorded. Total spending is still strong in 2016 at 10% growth. Major contributions appear from institutional work in educational and healthcare. Office and manufacturing still provide very strong support to growth.
Infrastructure projects spending will decline for the next six months due to the ending of massive projects that started 24 to 42 months ago. There will be large advances in spending midyear before we experience another slowdown later in 2016. I’m currently predicting spending will grow less than 2% in 2016, held down by a 10% drop in Power the second largest component of infrastructure work.
Mixed within the three sectors above are Private and Public spending. Residential is about 98% private and makes up about 50% of all private work. Along with manufacturing and large portions of power, commercial/retail, office and healthcare makes up nearly 90% of all private work. Private growth is the sum of the parts, predicted at 10%+ for 2016. Public work is all or a large portion of highway/street, educational, transportation and sewage/waste. Along with small contributions from water and a portion of power, these markets comprise 80% of all public work. Again, the sum of parts shows growth at 8% in 2016.
From the middle of Q1’16 to the end of Q3 we will register an annual growth rate of 20%, but due to the dips at the beginning and the end of the year total 2016 construction spending growth will come in at 11%. Construction spending momentum is not losing steam. We are seeing the affect of a few years of erratic growth patterns and a shift from commercial to institutional work.
Construction Spending Nonres Bldgs on a Roll > What it Means for Inflation
This is clearly going to measure up as the breakout year for spending on nonresidential buildings. Growth year-to-date (YTD) is up 18.3%. We will finish the year with total growth up 17%. The last time we saw growth like this was 2007. In fact, 2007 is the only time % growth (and $ volume growth) was ever larger than this year.
Since last December I have been predicting a range from 14% to 20% growth in 2015 nonresidential buildings spending. It looks like we will finish the year right in the middle of that range.
By far the largest $ contribution comes from the growth in manufacturing buildings, up 50% and up $23bil YTD. Next closest is office buildings, up 22% and up $8.3bil YTD. Lodging, Commercial-Retail, Educational and Amusement-Recreation are each up approximately $4bil YTD, quite impressive for Lodging and Amusement-Rec since they both total only $17bil YTD.
Nonresidential buildings spending will maintain greater than 10% growth in 2016 something achieved only 5 times in 25 years. Next year, educational and healthcare buildings will both contribute strongly to the total annual growth. Manufacturing, Office and Lodging will all settle back but still maintain 10% or greater growth. Commercial-retail, which had 3 years of substantial growth from 2012 to 2014 adding nearly 50% spending growth during that time, will grow only 2-3% next year.
With last year, this year and next, nonresidential buildings spending will reach growth of 40% in three years, a growth rate exceeded only once in history, during the last construction boom from 2006 to 2008. Along with that boom in spending came the highest construction inflation ever recorded, an average inflation over 8% per year for 4 years. I expect we are headed there again.

revised / updated table 12-9-15 to include ABC & BMarkstein forecasts.
Predictions – 2015 Spending for Nonresidential Construction Markets
Compiled in one neat table, here are 2015 predictions from eleven construction data firms for spending growth in nonresidential markets. Several firms provided mid-year estimates and recent estimates. Some provided only mid-year and some just recent estimates. Midyear estimates are separated so changes can be seen to current estimates.
Actual spending put-in-place for September year-to-date (YTD) became available November 2nd and new construction starts for October became available November 23rd.
There is a wide range of variance in predictions with the closest spreads at 9% and the widest spreads in lodging and manufacturing markets. It will be interesting to look back at this chart when the final numbers for 2015 become available in February 2016 to see how we did.
- One recent estimate published in Engineering News Record (ENR) magazine 11-16-15 lists 7% growth for manufacturing buildings. Each of the first nine months in 2015, the year over year growth has ranged between 40% and 60%, so the huge growth expected has been apparent for some time. Even if the last three months drop 15% below the current average we will still finish the year up 40%.
- For growth in educational buildings to fall to only 3%, the last three months would need to drop 15% below the current six month average, a change we will not very likely see.
- The spread on lodging is 18%, from the low estimate of 15% to high of 33%. YTD lodging through nine months is up 31% over last year. To finish at less than 25% growth in 2015, spending for the next three months would need to drop 20% from current levels.
We get a chance to tweak these numbers a little tighter when October spending gets released on December 1st.

Construction Spending – What You Need to Know About YTD Mo/Mo Yr/Yr
Common comparisons published in news reports for construction spending are, from best to worst:
- Current year-to-date vs same period previous year. YTD
- Current month vs previous month. Mo/Mo or MOM
- Current month vs same month last year. Yr/Yr or YOY
- Number of months to current value since last time that value achieved.
In some cases a comparison uses Not Seasonally Adjusted (NSA) dollars and in other cases Seasonally Adjusted Annual Rate (SAAR) dollars. NSA dollars is the actual amount spent within the month. SAAR dollars represents the annual rate that monthly amount would generate based on the normal proportion typical spent within that month. Typical spending is always much higher in summer months than winter to produce the same SAAR.
Year-to-date is the best comparison. It increases in strength as more months are added to the YTD. It is a value that gives a strong indication of growth over the previous year. Comparisons must be made using Not Seasonally Adjusted (NSA) dollars. Although it does lack adjustment for inflation, only one year of inflation is involved. Not adjusting for inflation is explained as the difference between current dollars and constant dollars.
Current month to month (MOM) comparisons are not generally affected by inflation but may not give a clear indication of movement due to monthly fluctuations. Comparisons absolutely must be made using Seasonally Adjusted Annual Rate (SAAR) dollars. It is a gross error to make month to month comparisons using NSA dollars, since there is a normal spending curve that shows the percent of total annual spending can vary considerably from month to month, sometimes by as much as 10%. This variation is accounted for in the SAAR.
When comparing to the same month last year (YOY), the question arises, “Is any big change in YOY caused by the current month performance or by the performance in the same month last year?” Again, YOY is missing adjustment for one year of inflation. Comparison can be NSA or SAAR dollars.
Number of months/years since current value was last achieved is almost always presented as a current dollar comparison. When dealing with cost, because of the long duration often involved it would be much better if it were a constant dollar comparison to account for construction inflation. However, construction inflation may not be readily available and this type of comparison is rarely if ever published using constant dollar comparisons. Comparison should use either entire year total dollars or should use SAAR dollars.

Current dollars = dollars are reported in the value of the year reported 2008=2008$, 2015 = 2015$. 99% of news reports use current dollars and therefore do not account for the influence of inflation.
Constant dollars = all dollars adjusted to represent dollars in the year of comparison. Adjusts for inflation so 2008$ in this case are converted to equivalent 2015$.
It’s not to hard to understand why we need to use constant dollars when you think of it in terms of buying products like food or heating oil. Today heating oil costs $1.90/gallon. In 2008 heating oil cost $3.50/gallon. So, with respect to oil, $350 in 2008 dollars is no different than $190 in 2015 dollars.
In addition to the Year-to-date growth values, here’s two more less common stats for looking at the same information.
Percent change from the last cycle high current$ (contant 2015$)
- Residential – Q1 2006 $390b vs $$680b -43% (-50%)
- Nonresidential Buildings – Q1 2008 $392b vs $$439b -11% (-22%)
- Nonbuilding Infrastructure – Q1 2008 $298b vs $$286b +4% (-10%)
Percent change from the recent recession low current$ (contant 2015$)
- Residential – Q1 2011 $390b vs $$239b +64% (+48%)
- Nonresidential Buildings – Q1 2011 $392b vs $$267b +49% (+35%)
- Nonbuilding Infrastructure – Q1 2008 $298b vs $$243b +22% (+13%)
Constant dollars makes a huge difference in the statistics. Just take a look at Nonresidential buildings. Current dollars would indicate we are now only 11% below the previous high and we’ve had growth of 49% from the recession low. Constant dollars adjusting for inflation shows we are still 22% below the previous cycle high and we’ve had growth of only 35% since the recession lows.
You can find a complete section providing constant dollar cost comparison in my quarterly report. Access the report through the Featured Economic Report tab at the top of this blog
Housing Starts > Look a Little Deeper
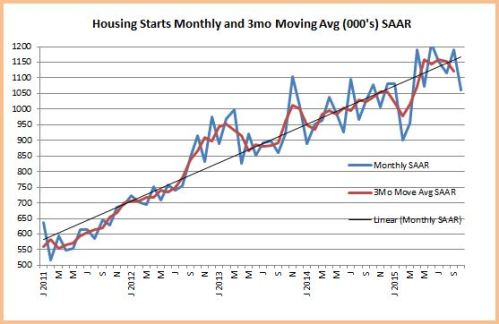
October housing starts released Nov. 18th didn’t come in as expected. The annual rate for October is 1,060,000 new starts vs 1,191,000 in September and 1,079,000 in October last year. BUT look a little deeper than just one month.
The last 4 months of starts have been pretty high, averaging 14% higher than the previous 4 months and 16% higher than the same 4 months last year.
Take a look at this chart. Monthly starts periodically peak and dip erratically. Look at February 2015, the biggest dip in 5 years. But then notice it took less than 4 months for starts to come right back to the trend line and the trend remained intact. This is how the monthly housing starts data goes.
So don’t get too alarmed over one month of data. Now if this downward trend were to continue for several months, go ahead get concerned, but that hasn’t been the pattern.
Construction Inflation
LINK to most recent articles on inflation 2019
11-17-2015
( Also See 1-31-2016 comments and chart on inflation )
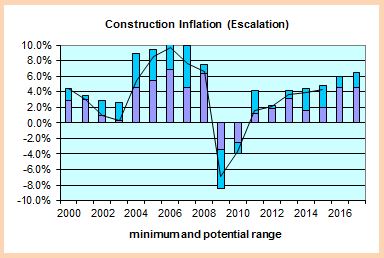
Over the last 24 months work volume has increased and short-term construction inflation has increased to more than double consumer inflation. It appears construction inflation is already advancing faster than and well ahead of consumer inflation, which supports that consumer inflation is not an indication of movements or magnitude of construction inflation.
It is always important to carry the proper value for cost inflation. Whether adjusting the cost of a recently built project to predict what it might cost to build a similar project in the near future or answering a client question “What will it cost if I delay my project start by one year?”, whether you carry the proper value for inflation (which can differ every year) can make or break your estimate.
- Long term construction cost inflation is normally about double consumer price inflation (CPI).
- Since 1993 but taking out 2 years of recession (-8%), the 20-year average inflation is 4.2%.
- Average long term (30 years) construction cost inflation is 3.5% even with any/all recession years included.
- In times of rapid construction spending growth, construction inflation averages about 8%.
- Although inflation is affected by labor and material costs, a large part of the change in inflation is due to change in contractors/suppliers margins.
- When construction volume increases rapidly, margins increase rapidly.
- Construction inflation can be very different from one major sector to the other and can vary from one market to another. It can even vary considerably from one material to another.
In the 5 years of rapid growth in spending for nonresidential buildings from 2004 through 2008, nonresidential buildings cost inflation totaled 39%, or averaged ~8% per year.
In the 6 years of spending during the residential construction boom from 2000 through 2005, residential building cost inflation totaled 47%, or averaged ~8% per year.
Neither the producer price index (PPI) for construction inputs nor the CPI are good indicators of total construction cost inflation.
Some construction cost indices include only the cost changes for a market basket of labor and materials and do not include any change for margins. Those indices are not a complete analysis of construction cost inflation.
Construction cost inflation must include all changes related to labor wages, productivity, materials cost, materials availability, equipment and finally contractors margins. Margins are affected by the volume growth of new work and demand for new buildings. So be sure to verify what is included in any cost index you reference for real construction cost inflation.
For the last three years residential construction inflation has averaged 5.7% and nonresidential buildings inflation has averaged 4.2%. Nonresidential buildings cost inflation has increased for five consecutive years. Both are likely to increase next year since anticipated volume in both sectors will grow next year.
In my construction spending data set, which goes back to 1993, there were six years with greater than 9% spending growth. By far the largest spending growth years were 2004 and 2005, 11.2% and 11.5%. We are about to repeat that historic level of spending growth. I am predicting 2015 will finish with growth of 11.6% and 2016 will experience 11% growth.
(8-12-16) 2015 finished at 10.6% because 2014 was revised up. Construction spending for 2016 will probably finish closer to 8%.
I expect historic levels of growth in spending will be accompanied by inflation relative to historic high growth periods. Don’t expect long term average inflation in high growth periods. Don’t be caught short in your construction cost budgets!
Graphic updated 1-8-16
The chart shows the low and high range of various independent nonresidential buildings construction actual cost indices. In 2015, the range of estimates was from 2% to 5%. The actual inflation came in at 4%. The plotted line is my result of where inflation actually ended up. A chart for residential construction would show much different values.
( Also See 1-31-2016 comments and chart on inflation )
Erratic Pattern Ahead for 2016 Construction Spending. Why?
The good news is 2016 construction spending will be up across the board, although growth will vary between the three major sectors, residential, nonresidential buildings and nonresidential infrastructure. This post is about how we will get there.
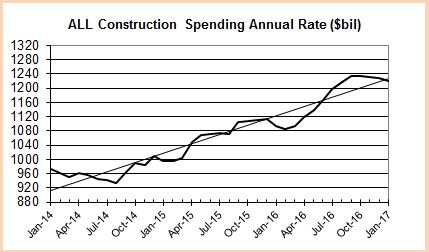
This plot shows a three year pattern of spending for nonresidential construction. The seasonally adjusted annual rate is plotted every month and the horizontal bars show the total average spending for each year.
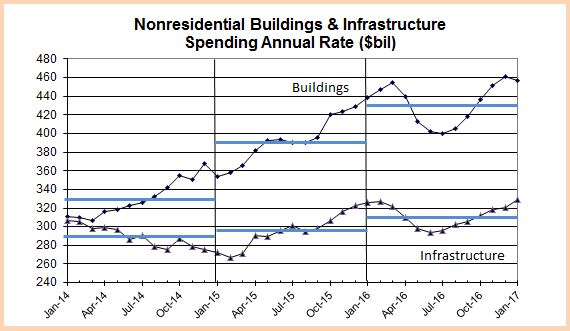
I often include a linear trend line in my plots because it’s good to be reminded of the long term direction and rate of growth rather than the monthly fluctuations. I’ve removed the trend lines from this plot to make a point. A fairly typical growth year shows spending finishing the year at a higher rate than when we started. The total spending for the year (shown by the horizontal bars) is the sum of the unadjusted monthly values, which is the same as the average of the monthly adjusted rates of spending. The plot above shows spending for buildings totals of $330 billion in 2014, $390 billion in 2015 and $430 billion in 2016.
If spending always occurred evenly we would see a smooth constant slope plot line indicating the rate of growth, sometimes punctuated with minor monthly declines but over the long term up at a constant rate. The plot for buildings shows a pretty constant growth pattern from March 2014 to March 2016. We see a few slight monthly dips and a flat spot in mid-2015, but overall fairly constant growth.
That will all change in 2016.
The plot shows both buildings and infrastructure will experience multi-month declines in 2016. By midyear both will dip so low that the year over year comparison will drop to near zero percent. Spending on buildings will drop more than 10% from the 1st quarter 2016 high to the midyear low. (edit 11-16. Most recent analysis is showing the nonresidential buildings peak and drop is moved out about 4 to 6 months. The plot above does not reflect this most recent analysis.) Infrastructure will drop in a similar pattern but not as dramatically. Both will resume growth and finish the year at or near the yearly high. Together these major sectors make up 60% of total construction spending with residential being the other 40%. The magnitude of these declines will be large enough to drag total construction spending down for the period, but it too will resume growth and finish the year well above where it started.
What causes that pattern?
Spending in any given month is the sum total contributed by all the projects that started and are currently underway. That includes spending from projects that started recently with foundations just coming out of the ground and also projects that started 18 to 24 months ago that are near completion and near ready for occupancy. Spending is affected by the pattern of starts recorded over the previous 24 months. Only if that pattern is even in growth will spending be even in growth.
Let’s make some assumptions for an example that should be easy to understand.
- All projects take 20 months to build.
- The construction budget gets spent at a constant rate of 5% per month.
Of course, reality never occurs as simple as that, but it makes for an easy to understand example. With these simple assumptions we know this about spending;
- Every month includes some spending from all starts over the previous 20 months.
- New starts in any given month contribute only 1/20th or 5% to total spending that month.
- Predicted spending 3 months out includes only 15% from new starts, 4 months out 20%, etc.
Now, back to reality.
Nonresidential buildings spending in 2016 includes projects that started all the way back to mid 2014. From April 2014 to April 2015, concentrated mostly in mid to late 2014, there were several instances where monthly starts exceeded the previous month by 50%-60%, then settled back. Those were great months and indicated a huge growth spurt in nonresidential building construction. We see that growth from early 2014 all the way up to a peak in early 2016. Nonresidential buildings spending experienced growth of 9% in 2014 and 19% in 2015, with 9% growth predicted for 2016.
We don’t typically see a seesaw pattern in spending from the starts when all the projects are ongoing at the same time, we see flatter and steeper rates of spending growth. The six biggest months from that period averaged more than 30% higher than the current rate of new starts growth. So we’ve had a pause in the rate of increase for new starts. We see the big affect on the spending pattern when a very large volume of spending from starts 18 or 24 months ago reaches completion and drops out of the current month spending. That is what will happen in 2016.
New 2016 nonresidential buildings starts is not the cause of a 10% dip in spending in 2016. It is the completion of a very large volume of starts from 2014 that will no longer be contributing a large share to monthly spending. That will work itself out by year end. But for those who do not look at the patterns that contribute to current spending it will create quite a stir. Three to five months of consistent declines in spending will look like the end of recovery in nonresidential construction. It is not the end.